doi:10.3926/jiem.2009.v2n2.p387-406 ©© JIEM, 2009 – 2(2): 387-406 - ISSN: 2013-0953
Simulation modeling and analysis of a complex system of a
thermal power plant
Sorabh Gupta
1, Puran C. Tewari
21
Haryana College of Technology & Management (INDIA);
2
National Institute of Technology (INDIA)
;
Received March 2009 Accepted July 2009
Abstract:
The present paper deals with the opportunities for the modeling of flue gas and
air system of a thermal power plant by making the performance evaluation using
probabilistic approach. The present system of thermal plant under study consists of four
subsystems with three possible states: full working, reduced capacity working and failed.
Failure and repair rates for all the subsystems are assumed to be constant. Formulation of
the problem is carried out using Markov Birth-Death process using probabilistic approach
and a transition diagram represents the operational behavior of the system.
Interrelationship among the full working and reduced working states has been
developed. A probabilistic model has been developed, considering some assumptions.
Data in feasible range are selected from a survey of thermal plant and the effect of each
subsystem on the system availability is tabulated in the form of availability matrices, which
provides various performance/availability levels for different combinations of failure and
repair rates of all subsystems. Based upon various availability values obtained in availability
matrices and graphs of failure/repair rates of different subsystems, performance and
optimum values of failure/repair rates for maximum availability, of each subsystem is
analyzed and then maintenance priorities are decided for all subsystems.
Keywords:
performance evaluation, probabilistic approach, transition diagram and
doi:10.3926/jiem.2009.v2n2.p387-406 ©© JIEM, 2009 – 2(2): 387-406 - ISSN: 2013-0953
1 Introduction
The thermal industry is becoming quite complex with a huge capital investment being incurred on process automation to enhance the reliability of system. Invariably, the proper maintenance of such systems and the frequency of maintenance are some of the issues that are gaining importance in industry. The production suffers due to failure of any intermediate system even for small interval of time. The cause of failure may be due to poor design, system complexity, poor maintenance, lack of communication and coordination, defective planning, lack of expertise/experience and scarcity of inventories. Thus, to run a process plant highly skilled/ experienced maintenance personnel are required. According to Kumar and Pandey (1993), for efficient functioning, it is essential that various systems of the plant remain in upstate as far as possible. However, during operation they are liable to fail in a random fashion. The failed subsystem can however be inducted back into service after repairs/replacements. The rate of failure of the subsystems in the particular system depends upon the operating conditions and repair policies used.
A probabilistic analysis of the system under given operative conditions is helpful in forecasting the equipment behavior which further helps in design to achieve minimum failure in the system i.e. to optimize the system working. A thermal power plant is a complex engineering system comprising of various systems: coal handling, steam generation, cooling water, crushing, ash handling, power generation, feed water, steam & water analysis system and flue gas & air system. These systems are connected in complex configuration. One of the most important functionaries of a thermal plant is flue gas & air system. The optimization of each system in relation to one another is imperative to make the plant profitable and viable for operation. Effectiveness of thermal power plant is mainly influenced by the availability, reliability and maintainability of the plant, and its capability to perform as expected. The present paper provides a probabilistic model to plant personnel to analyse system performance and to achieve the maximum availability.
Some of the salient features of the proposed model are as follows:
doi:10.3926/jiem.2009.v2n2.p387-406 ©© JIEM, 2009 – 2(2): 387-406 - ISSN: 2013-0953
The proposed model combines a strong mathematical foundation with an intuitive graphical representation.
The transition diagram represents the possible states of the system.
1.1 Background
Reliability analysis techniques have been gradually accepted as standard tools for the planning and operation of automatic and complex thermal power plants. Barabady and Kumar (2007) state that, the most important performance measures for repairable system designers and operators are system reliability and availability. Availability and reliability are good evaluations of a system’s performance. Their values depend on the system structure as well as the component availability and reliability. Kumar, Kumar and Mehta (1996) showed that the rate of failure of the components in the system depends upon the operating conditions and repair policy used. Barabady and Kumar (2008) conclude that from an economic point of view, high reliability is desirable to reduce the maintenance costs of systems. Blischke and Murthy (2003) suggested that since failure cannot be prevented entirely, it is important to minimize both its probability of occurrence and the impact of failures when they do occur. To maintain the designed reliability, availability and maintainability characteristics and to achieve expected performance, an effective maintenance program is a must and the effective maintenance is characterized by low maintenance cost. The maintenance of repairable systems has been widely studied by many authors, considering different focus of interest, such as the repair/replacement policy, periodic inspections, degrading, optimization problems, among other topics. The behaviour of complex systems can be studied in terms of their reliability, availability and maintainability (RAM). For example, Kurien (1988) developed a simulation model for analyzing the reliability and availability of an aircraft training facility. The model was useful for evaluating various maintenance alternatives. According to Ebling (1997), factors that affect RAM of a repairable system include machinery operating conditions, maintenance and infra-structural facilities.
doi:10.3926/jiem.2009.v2n2.p387-406 ©© JIEM, 2009 – 2(2): 387-406 - ISSN: 2013-0953
modeling paradigms such as fault trees, Markov chains, Petri nets and Activity nets. Advantages of Markov chains are the capability of modeling systems with shared repair. Lim and Chang (2000) studied a repairable system modeled by a Markov chain with two repair modes. According to Malhotra and Trivedi (1994), if the system structure is dynamic rather than static, this can be modeled accurately by Markov chains but only approximately by fault trees or reliability block diagrams. Some of the Markov analysis tools are; EHARP: suggested by Somani, Sharma and Nguyen (1994), HIMAP: by Krishnamurthy, Gupta and Somani (1996), SURE: given by Butler (1986), TANGRAM: by Bernson, De souza and Muntz (1991), SHARPE: described by Sahner and Trivedi (1987) and SURF-2: suggested by Beounes et al. (1993). In the past, several mathematical models, for example; Balaguruswamy (1984) and Dhillon (1983) have been developed, which handle wide degree of complexities for the prediction of availability. Most of these models are based on the Markovian approach, wherein the failure and the repair rates are assumed to be constant. In other words, the times to failure and the times to repair follow exponential distribution.
Further, according to Raje, Olaniya, Wakhare and Deshpande (2000), simulation has also become an important tool for assessing the availability of complex process plants. The advantage with the simulation model is that the non-Markovian failure and the repair processes can be modeled easily. Such modeling techniques help to investigate the more complex operations, failure and repair patterns.
1.2 Organization of the Paper
The section 2 presents and discusses the processing and description of flue gas and air system used for making the transition diagram. The assumptions used for development of model are also listed in this section. Section 3 describes the development of a mathematical model. Section 4 describes the performance analysis/evaluation made in this study. Section 5 and 6 describes the results and conclusions respectively of ‘present study’.
2 Fuel gas and air system
doi:10.3926/jiem.2009.v2n2.p387-406 ©© JIEM, 2009 – 2(2): 387-406 - ISSN: 2013-0953
upwards through the boiler, being sucked by an induced draught fan. During their upward flow, they lose heat in super-heaters (to superheat the steam), reheaters (for reheating the steam), economizer (to heat the boiler feed water) and in the air-heaters (for heating the air required for combustion in the boiler furnace). After passing through the ash precipitators, the flue gases leave through the chimney.
2.1 System structure
A typical system consists of a number of subsystems connected to each other logically either in series or in parallel in most cases. The performance of the system depends on the configuration and performance of its subsystems. Before analyzing the failure data, it is better to describe the configuration of fuel gas and air system and classify it into various subsystems so that the failures can be categorized. The present system consists of following four subsystems:
The assembly of four heaters & economizer (in series) constituting one subsystem, denoted by A, in which, failure of anyone results in to system failure.
Two ESP (Electrostatic precipitator) constituting one subsystem, denoted by B, failure of anyone leads to system failure.
Two FD (Forced draft) fans in parallel, constituting one subsystem and is denoted by C. Failure of any one reduces the capacity of plant & loss in production. Complete failure occurs when both units fails.
Three ID (Induced draft) fans in parallel, constituting one subsystem and is denoted by D. Failure of any one reduces the capacity of plant & loss in production. Complete failure occurs when all units fails.
2.2 Assumptions
The assumptions used in developing the probabilistic model are:
There is no simultaneous failure (Khanduja, Tewari, and Kumar, 2008).
doi:10.3926/jiem.2009.v2n2.p387-406 ©© JIEM, 2009 – 2(2): 387-406 - ISSN: 2013-0953
Service includes repair and/or replacement (Gupta, Tewari and Sharma, 2009a).
System failure/repair follows the exponential distribution.
Standby subsystems are of the same nature and capacity as that of active subsystems (Gupta, Tewari and Sharma, 2009b).
At any given time, the system is either in operating state or in the failed state (Gupta, Tewari and Sharma, 2008b).
Failure/repair rates are constant over time and statistically independent (Kumar, Tewari and Kumar, 2007).
Sufficient repair facilities are available (Srinath, 1994).
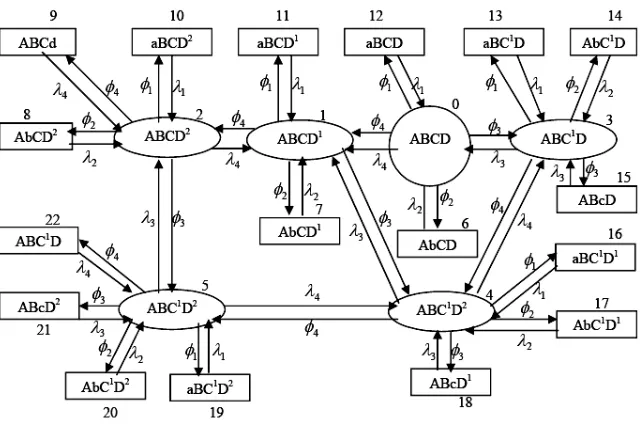
Figure 1. “Transition Diagram of flue gas and air system”.
3 System simulation modeling
state-doi:10.3926/jiem.2009.v2n2.p387-406 ©© JIEM, 2009 – 2(2): 387-406 - ISSN: 2013-0953
space model and describes the transitions of one state to another. The flow of states for the system under consideration has been described in a transition diagram, which is based upon concepts given by Kumar, Kumar1 and Mehta (1999), as shown in Figure 3, which is logical representation of all possible state’s probabilities encountered during the failure analysis of fuel gas and air system. Wolstenholme (1999) states that the transition probabilities only depend on the present state of the system. The model should include all components, the states they can be in and the frequency at which they change state. The failure and repair rates of the different subsystems are used as standard input information to the model. Formulation is carried out using the joint probability functions based on the transition diagram. These probabilities are mutually exclusive and provide the scope to implement Markovian approach for availability analysis of power generation process.
According to Markov, if P0(t) represent the probability of zero occurrences in time t,
then the probability of zero occurrences in time (t + ∆t) is given by
)
(
).
1
(
)
(
00
t
t
t
P
t
P
(1)Similarly
P
1(
t
t
)
(
.
t
).
P
0(
t
)
(
1
.
t
).
P
1(
t
)
(2)The equation 2, as stated by Srinath (1994), shows the probability of one occurrence in time (t+∆t) and is composed of two parts, namely, (a) probability of zero occurrences in time t multiplied by the probability of one occurrence in the interval ∆t and (b) the probability of one occurrence in time t multiplied by the probability of no occurrences in the interval ∆t. Then simplifying and putting
t
→0, one gets
)
(
.
)
(
)
(
P
1t
P
0t
dt
d
(3)Using the concept used in equation 3 and various probability considerations, the following differential equations associated with the transition diagram of fuel gas and air system are formed, as described by Kumar, Tewari and Sharma (2007).
(
)(
)
(
)
)
(
'
t
P
0t
P
t
doi:10.3926/jiem.2009.v2n2.p387-406 ©© JIEM, 2009 – 2(2): 387-406 - ISSN: 2013-0953
For
i
1
,
2
,
3
,
4
;j
1
,
k
12
;
j
2
,
k
6
;
j
3
,
k
3
;
j
4
,
k
1
(
)
(
)
(
)
(
)
)
(
'
t
P
t
P
t
4P
1t
P
i
r
m i
j k
i (5)For
i
1
,
r
1
,
2
,
3
,
4
,
m
4
;j
1
,
k
11
;
j
2
,
k
7
;
j
3
,
k
4
;
j
4
,
k
2
For
i
2
,
r
1
,
2
,
3
,
4
,
m
4
;j
1
,
k
10
;
j
2
,
k
8
;
j
3
,
k
5
;
j
4
,
k
9
(
)
(
)
(
)
(
)
)
(
'
t
P
t
P
t
3P
3t
P
i
r
m i
j k
i (6)For
i
3
,
r
1
,
2
,
3
,
4
,
m
3
For
j
1
,
k
13
;
j
2
,
k
14
;
j
3
,
k
15
;
j
4
,
k
4
(
)
(
)
(
)
(
)
(
)
)
(
'
t
P
t
P
t
3P
3t
4P
1t
P
i
r
m i
j k
i
i (7)For
i
4
,
r
1
,
2
,
3
,
4
,
m
3
,
4
For
j
1
,
k
16
;
j
2
,
k
17
;
j
3
,
k
18
;
j
4
,
k
5
For
i
5
,
r
1
,
2
,
3
,
4
,
m
3
,
4
For
j
1
,
k
19
;
j
2
,
k
20
;
j
3
,
k
21
;
j
4
,
k
22
)
(
)
(
)
(
'
t
2P
t
2P
t
P
i
i
k Fori
6
,
7
,
8
k
0,1,2
(8))
(
)
(
)
(
'
t
4P
t
4P
t
P
i
i
k Fori
9
k
2
(9))
(
)
(
)
(
'
t
1P
t
1P
t
P
i
i
k Fori
10
,
11
,
12
k
2,1,0
(10))
(
)
(
)
(
'
t
12P
t
12P
t
P
i
i i
i k Fori
13
,
14
,
15
k
3
(11))
(
)
(
)
(
'
t
15P
t
15P
t
P
i
i i
i k Fori
16
,
17
,
18
k
4
(12))
(
)
(
)
(
'
t
18P
t
18P
t
P
i
i i
i k Fori
19
,
20
,
21
,
22
k
5
(13)With the initial condition P0 (0) =1 and zero otherwise. Since any thermal plant is a
doi:10.3926/jiem.2009.v2n2.p387-406 ©© JIEM, 2009 – 2(2): 387-406 - ISSN: 2013-0953
continuously till the final product is obtained. Thus, as stated by Arora and Kumar (1997), putting derivative of all probabilities equal to zero yields the long run
availability of the system of a thermal plant
P
'
i(
t
)
0
at
t
into differentialequations (4-13), and solving these equations recursively, following are the values of all state probabilities in terms of full working state probability.
i.e. P0.
0 12
1
C
P
P
4 13 04
9
C
P
P
0 11 1 116
C
P
P
0 132
C
P
P
1 13 01
10
C
P
P
0 11 2 217
C
P
P
0 143
C
P
P
1 12 01
11
C
P
P
0 11 3 318
C
P
P
0 114
C
P
P
1 01
12
P
P
15 01 1
19
C
P
P
0 155
C
P
P
1 14 01
13
C
P
P
0 15 2 220
C
P
P
0 2 2 6P
P
14 02 2
14
C
P
P
15 03 3
21
C
P
P
0 12 2 27
C
P
P
0 14 3 315
C
P
P
0 15 4 422
C
P
P
0 13 2 28
C
P
P
doi:10.3926/jiem.2009.v2n2.p387-406 ©© JIEM, 2009 – 2(2): 387-406 - ISSN: 2013-0953
3.1 Normalizing condition
The probability of full working capacity, namely, P0 determined by using
normalizing condition: (i.e. sum of the probabilities of all working states, reduced capacity and failed states is equal to 1)
22 01
i iP
, therefore putting the values of P0-P22 and solving, one gets ) ( ) ( ) ( 1 )( 1 ( 1 15 14 4 4 15 14 11 3 3 2 2 1 1 15 14 13 12 11 0 C C C C C C C C C C P
(14)Where
4 3 1
C
2 4 84 7 3 9
C
C
C
C
4 4 32
C
2 4 84 10
C
C
C
4 3 3
C
3 4 9 4 44 4 10 3 3 4 1
11
C
C
C
C
C
C
C
3 4 4
C
C
12
C
9C
11
C
104 3 4
5
C
C
13
C
7C
11
C
8C
124 3 6
C
43 4 1 1 14
C
C
C
3 3 6 3 3 4
7
C
C
C
6 4 11 3 13 15C
C
C
C
3 3 6 3 6 4
8
doi:10.3926/jiem.2009.v2n2.p387-406 ©© JIEM, 2009 – 2(2): 387-406 - ISSN: 2013-0953
3.2 Steady state availability
Now, the steady state availability of fuel gas and air system may be obtained as summation of all working states probabilities as:
Av.=Summation of all working states
5 4 3 2 1
0
P
P
P
P
P
P
A
v
)
1
(
11 12 13 14 150
C
C
C
C
C
P
(15)4 Analysis of system model
The simulation model is used to predict the availability/performance of fuel gas and air system for known input values of failure and repair rates of its subsystems. The performance of fuel gas and air system of thermal power plant is mainly affected by the failure and repair rates of each subsystem. From maintenance history sheet of fuel gas and air system and through the discussions with the plant personnel, appropriate failure and repair rates of all subsystems are taken and decision matrices (availability values) are prepared accordingly by putting these failure and repair rates values in expression 15, the availability simulation model (Av.). This
model forms the foundation for all other performance improvement activities (e.g. solution design and development, implementation and analysis). These unit parameters ensure the high availability/performance of the fuel gas and air
system. This model includes all possible states of nature, that is, failure events (
i) and the identification of all the courses of action, i.e, repair priorities (
i). Tables1-4 represent the availability matrices for various subsystems of the fuel gas and air system. These matrices simply reveal the various availability levels for different combinations of failure and repair rates/priorities. On the basis of analysis made, the best possible combinations (
,
) may be selected. These availability values indoi:10.3926/jiem.2009.v2n2.p387-406 ©© JIEM, 2009 – 2(2): 387-406 - ISSN: 2013-0953
5 Results and Discussion
The performance of each subsystem is analyzed using the developed model. On the basis of availability values, as given in Table 1-5 and plotted in Figure 2-5, the following observations are made, which reveals the effect of failure and repair rates of various subsystems on the availability of fuel gas and air system.
Availability (Av.) →
λ1
1.1 .175 .250 .325 .4 Constant values
.005 .9408 .9601 .9681 .9725 .9752
35 . , 0225 .
31 . , 0283 .
3 . , 0015 .
4 4
3 3
2 2
.0063 .9294 .9533 .9633 .9687 .9721 .0076 .9183 .9466 .9585 .9649 .9691 .0089 .9075 .9400 .9537 .9612 .9660 .0102 .8969 .9335 .9490 .9575 .9630
Table 1. “Availability matrix of heater assembly subsystem of Flue gas and air system”.
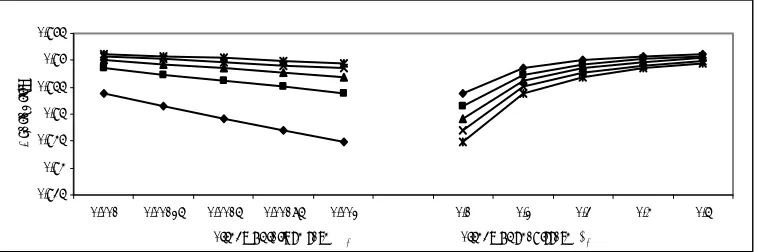
Figure 2. “Effect of failure & repair rate of heater assembly subsystem on subsystem availability”.
Table 1 and Figure 2 reveal the effect of failure and repair rates of first subsystem (assembly of heaters & economizer) on the availability of flue gas and air system. It is observed that for some known values of failure / repair rates of other three subsystems, as failure rate of first subsystem increases from 0.005 (once in 200 hrs) to 0.01 (once in 100 hrs), the subsystem availability decreases by only 5%. Similarly as repair rate of first subsystem increases from 0.1 (once in 10 hrs) to 0.4 (once in 2.5 hrs), the subsystem availability increases by about 3.5%.
0.84 0.86 0.88 0.9 0.92 0.94 0.96 0.98 1
0.005 0.0063 0.0076 0.0089 0.0102 0.1 0.175 0.25 0.325 0.4
Effect of failure rate (Φ1) Effect of reapirrate (λ1)
A
vai
la
b
ili
doi:10.3926/jiem.2009.v2n2.p387-406 ©© JIEM, 2009 – 2(2): 387-406 - ISSN: 2013-0953
Availability (Av.) →
λ2
2
.1 .2 .3 .4 .5 Constant values.001 .9539 .9585 .9600 .9608 .9612
35 . , 0225 . 31 . , 0283 . 25 . , 0076 . 4 4 3 3 1 1
.00125 .9516 .9573 .9592 .9602 .9608 .00150 .9492 .9562 .9585 .9596 .9604 .00175 .9471 .9551 .9577 .9590 .9598 .0020 .9449 .9539 .9569 .9585 .9594
Table 2. “Availability matrix of ESP subsystem of Flue gas and air system”.
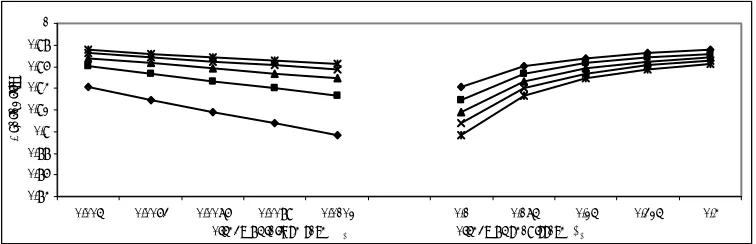
Figure 3. “Effect of failure & repair rate of ESP subsystem on subsystem availability”.
Table 2 and Figure 3 reveal the effect of failure and repair rates of ESP subsystem on the availability of flue gas and air system. It is observed that for some known values of failure / repair rates of other three subsystems, as failure rate of ESP increases from 0.001 (once in 1000 hrs) to 0.002 (once in 500 hrs), the subsystem availability decreases by only 1%. Similarly as repair rate of ESP increases from 0.1 (once in 10 hrs) to 0.5 (once in 02 hrs), the subsystem availability increases by about 1%.
Availability (Av.) →
λ3
3
.125 .219 .312 .406 .500 Constant values.0067 .9630 .9647 .9651 .9653 .9654
35 . , 0225 . 3 . , 0015 . 25 . , 0076 . 4 4 2 2 1 1
.0175 .9498 .9600 .9628 .9639 .9644 .0283 .9281 .9519 .9585 .9613 .9627 .0391 .9007 .9410 .9527 .9601 .9603 .0500 .8696 .9275 .9453 .9531 .9571
Table 3. “Availability matrix of FD fans subsystem of Flue gas and air system”.
0.935 0.94 0.945 0.95 0.955 0.96 0.965
0.001 0.00125 0.0015 0.00175 0.002 0.1 0.2 0.3 0.4 0.5
Effect of failure rate (Φ2) Effect of reapirrate (λ2)
doi:10.3926/jiem.2009.v2n2.p387-406 ©© JIEM, 2009 – 2(2): 387-406 - ISSN: 2013-0953
Figure 4. “Effect of failure & repair rate of FD fans Subsystem on subsystem availability”.
Table 3 and Figure 4 reveal the effect of failure and repair rates of FD fans subsystem on the availability of flue gas and air system. It is observed that for some known values of failure / repair rates of other three subsystems, as failure rate of FD fans increases from 0.0067 (once in 150 hrs) to 0.05 (once in 20 hrs), the subsystem availability decreases by only 10%. Similarly as repair rate of FD fans increases from 0.125 (once in 8 hrs) to 0.5 (once in 02 hrs), the subsystem availability increases but slightly.
Availability (Av.) →
λ4
4
.2 .275 .350 .425 .5 Constant values.0050 .9587 .9587 .9587 .9587 .9587
31 . , 0283 . 3 . , 0015 . 25 . , 0076 . 3 3 2 2 1 1
.0137 .9584 .9586 .9586 .9587 .9587 .0225 .9575 .9582 .9585 .9586 .9586 .0313 .9557 .9575 .9581 .9583 .9585 .04 .9528 .9563 .9575 .9580 .9583
Table 4. “Availability matrix of ID fans subsystem of Flue gas and air system”.
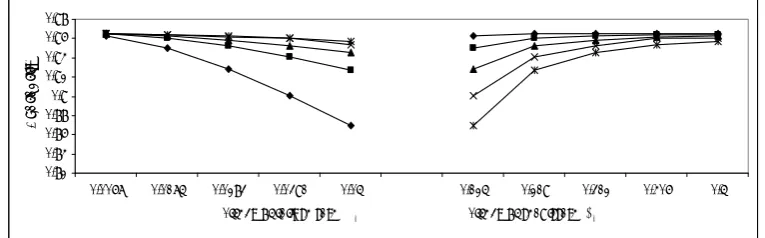
Figure 5. “Effect of failure & repair rate of ID fans subsystem on subsystem availability”.
Table 4 and Figure 5 reveal the effect of failure and repair rates of ID Fans subsystem on the availability of flue gas and air system. It is observed that for
0.82 0.84 0.86 0.88 0.9 0.92 0.94 0.96 0.98
0.0067 0.0175 0.0283 0.0391 0.05 0.125 0.219 0.312 0.406 0.5
Effect of failure rate (Φ3) Effect of reapirrate (λ3)
A v a ila b ili ty 0.9490.95 0.951 0.952 0.953 0.954 0.955 0.956 0.957 0.958 0.959 0.96
0.005 0.0137 0.0225 0.0313 0.04 0.2 0.275 0.35 0.425 0.5
Effect of failure rate (Φ4) Effect of reapirrate (λ4)
doi:10.3926/jiem.2009.v2n2.p387-406 ©© JIEM, 2009 – 2(2): 387-406 - ISSN: 2013-0953
some known values of failure / repair rates of other three subsystems, the effect of failure and repair rates of ID fans on the availability of flue gas and air system is negligible.
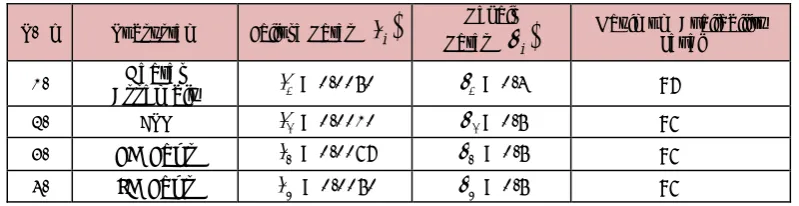
S.No Subsystem Failure Rates
i Rates Repair
i
Maximum Availability Level1. Heater
Assembly 1 = 0.0050 1 = 0.4 97 %
2. ESP 2 = 0.0010 2= 0.5 96 %
3. FD Fans 3 = 0.0067 3 = 0.5 96 %
4. ID Fans 4 = 0.0050 4 = 0.5 96 %
Table 5. “Optimum values of failure/repair rates of Subsystems of Fuel gas and air system”.
Table 5 helps in identifying the subsystem with maximum availability. It is observed that first subsystem is having maximum availability (97%). The optimum values of failure and repair rates for maximum availability level for each subsystem is also shown in table 5.
6 Conclusions
It can thus be concluded that this availability model is effectively used for the analysis of availability and hence the evaluation of performance of various sub-systems of flue gas and air system of thermal plant. It also shows the relationship among various failure and repair rates (
,
) for each subsystem of flue gas anddoi:10.3926/jiem.2009.v2n2.p387-406 ©© JIEM, 2009 – 2(2): 387-406 - ISSN: 2013-0953
Appendices
Notations:
Indicates the system is in operating state.
Indicates the system is in reduced capacity state.
Indicates the system is in failed state.
A, B, C, and D: Represent full working states of first subsystem (assembly of heaters & economizer), second subsystem (Electrostatic Precipitator (ESP)), third subsystem (Forced Draft (FD) fans) and fourth subsystem (Induced Draft (ID) fans) respectively.
C1: Denotes that sub-system C is working in reduced capacity.
D1
, D2: Denotes that sub-system D is working in reduced capacity (double stage).
a, b, c, and d : Represent failed states of first, second, third and fourth subsystem respectively.
P0 (t): Probability of full capacity working without standby unit.
Pi (t), i=1-5: Probabilities of reduced capacity working.
Pi (t), i=6-22: Probabilities of the system in failed states.
i
, i=1-4: Mean failure rates of A, B, C and D subsystems respectively.i
, i=1-4: Mean repair rates of A, B, C and D subsystems respectively.Pi'(t): Represents the derivative w.r.t. time (t).
Av.: Steady state availability of the system.
References
doi:10.3926/jiem.2009.v2n2.p387-406 ©© JIEM, 2009 – 2(2): 387-406 - ISSN: 2013-0953
Balaguruswamy, E. (1984). Reliability engineering. New Delhi: Tata McGraw Hill.
Barabady, J., & Kumar, U. (2007). Availability allocation through importance measures. International Journal of Quality and Reliability Management, 24(6), 643-657.
Barabady, J., & Kumar, U. (2008). Reliability analysis of mining equipment: a case study of a crushing. Reliability Engineering and System Safety, 93, 647–653.
Beounes, C. et al. (1993). SURF-2: A program for dependability evaluation of complex hardware and software systems. Paper presented at 23rd int. symp. on fault-tolerant computing. Toulouse, France.
Bernson, S., de Souza e Silva, E., & Muntz, R. (1991). A methodology for the specification of markov models. In Stewart, W. (Ed.), Numerical solution to markov chains (pp 11–37). Boston, MA: Kluwer.
Blischke, W. R., & Murthy, D. N. P. (2003). Case Studies in Reliability and Maintenance. USA: Wiley.
Butler, R. (1986). The SURE reliability analysis program. Paper presented at the AIAA guidance, navigation and control conference, Williamsburg, VA.
Ciardo, G., Muppala, J., & Trivedi, K. (1989). SPNP: Stochastic Petri Net Package. Paper presented at the 3rd Int. Workshop on petri nets and performance models, Kyoto, Japan.
Dhillon, B. S. (1983). Reliability engineering in systems design and operation. New York: Van Nostrand-Reinhold.
Ebling, C. E. (1997). An Introduction to reliability and maintainability Engineering. New Delhi: TMH Publishing Company Limited.
Gupta, S., Tewari, P. C., & Sharma, A. K. (2008a). Performance modeling and decision support system of feed water unit of a thermal power plant. South African Journal of Industrial Engineering, 19(2), 125-134.
doi:10.3926/jiem.2009.v2n2.p387-406 ©© JIEM, 2009 – 2(2): 387-406 - ISSN: 2013-0953
Gupta, S., Tewari, P. C., & Sharma, A. K. (2009a). Availability simulation model and performance analysis of coal handling unit a typical thermal power plant.
South African Journal of Industrial Engineering, 20(1), 159-171.
Gupta, S., Tewari, P. C., & Sharma, A. K. (2009b). Reliability and availability analysis of ash handling unit of a steam thermal power plant. South African Journal of Industrial Engineering, 20(1), 147-158.
Johnson, Jr. A.M., & Malek, M. (1988). Survey of software tools for evaluating reliability, availability and serviceability. ACM Computing Surveys, 20(4), 227– 269.
Khanduja, R., Tewari, P. C., & Kumar, D. (2008). Availability analysis of bleaching system of paper plant. Journal of Industrial Engineering, Udyog Pragati, N.I.T.I.E. Mumbai (India), 32(1), 24-29.
Koren, J. M., & Gaertner, J. (1987). CAFTA: a fault tree analysis tool designed for PSA. Paper presented at the Probabilistic safety assessment and risk management: PSA, Zurich, Switzerland.
Krishnamurthi, G., Gupta, A., & Somani, A.K. (1996). The HIMAP modeling environment. Paper presented at the 9th International conference on parallel and distributed computing systems: Dijon, France.
Kumar, D., & Pandey, P. C. (1993). Maintenance planning and resource allocation in urea fertilizer plant. Quality and reliability Engineering International Journal, 9, 411-423.
Kumar, S., Kumar, D., & Mehta, N. P. (1996). Behavioral analysis of shell gasification and carbon recovery process in urea fertilizer plant. Microelectron Reliability, 36 (5), 671-673.
Kumar, S., Kumar, D., & Mehta, N. P. (1999). Maintenance management for ammonia synthesis system in a urea fertilizer plant. International Journal of Management and System (IJOMAS), 15(3), 211-214
doi:10.3926/jiem.2009.v2n2.p387-406 ©© JIEM, 2009 – 2(2): 387-406 - ISSN: 2013-0953
Kumar, S., Tewari, P. C., & Kumar, S. (2007). Performance modeling and simulated availability of shell gasification and carbon recovery system of urea plant. Paper presented at the 16th IASTED International Conference held, Spain.
Kumar, S., Tewari, P. C., & Sharma, R. (2007). Simulated availability of Co2 cooling
system in a fertilizer plant. Industrial Engineering Journal (Indian Institution of Industrial Engineering, Mumbai), 36(10), 19-23.
Kurien, K. C. (1988). Reliability and availability analysis of repairable system using discrete event simulation. Ph. D. thesis, IIT, New Delhi.
Lim, T. J., & Chang, H. K. (2000). Analysis of system reliability with dependent repair models. IEEE Trans Reliab, 49(2), 153–62.
Malhotra, M., & Trivedi, K. S. (1994). Power-hierarchy of dependability-model types. IEEE Transactions on Reliabilit, 43(3), 493–502.
Raje, D. V., Olaniya, R. S., Wakhare, P. D., & Deshpande, A. W. (2000). Availability assessment of a two-unit stand-by pumping system. Reliability Engineering and System Safety, 68, 269–274.
Sahner, R. A., & Trivedi, K. S. (1987). Reliability modeling using SHARPE. IEEE Trans Reliability, 36 (2), 186–193.
Sanders, W. H., & Obal II, W. D. (1993). Dependability evaluation using UltraSAN. Paper presented at the twenty-third international symposium on fault-tolerant computing.
Somani, A. K., Sharma, T., & Nguyen, P. H. (1994). Reliability computation of systems with latent-failures and monitoring. Paper presented at the 1994 annual reliability and maintainability symposium.
Srinath, L. S. (1994). Reliability Engineering. 3rd edition, New Delhi, India.
East-West Press Pvt. Ltd.
doi:10.3926/jiem.2009.v2n2.p387-406 ©© JIEM, 2009 – 2(2): 387-406 - ISSN: 2013-0953
©© Journal of Industrial Engineering and Management, 2009 (www.jiem.org)
Article's contents are provided on a Attribution-Non Commercial 3.0 Creative commons license. Readers are allowed to copy, distribute and communicate article's contents, provided the author's and Journal of Industrial Engineering and Management's names are included. It must not be used for commercial purposes. To see the complete