doi:10.3926/jiem.2011.v4n2.p206-230 JIEM, 2011 – 4(2): 206-230 – Online ISSN: 2013-0953 Print ISSN: 2013-8423
Application of a concept development process to evaluate
process layout designs using value stream mapping and
simulation
Ki-Young Jeong
1, Don T Phillips
21
University of Houston-Clear Lake (UNITED STATES);
2Texas A&M University (UNITED
STATES)
[email protected]
;
[email protected]
Received September 2010 Accepted January 2011
Abstract:
Purpose: We propose and demonstrate a concept development process (CDP) as
a framework to solve a value stream mapping (VSM) related process layout design
optimization problem.
Design/methodology/approach: A case study approach was used to
demonstrate the effectiveness of CDP framework in a portable fire extinguisher
manufacturing company. To facilitate the CDP application, we proposed the
system coupling level index (SCLI) and simulation to evaluate the process layout
design concepts.
Findings: As part of the CDP framework application, three process layout design
concepts - current layout (CL), express lane layout (ELL) and independent zone
layout (IZL) - were generated. Then, the SCLI excluded CL and simulation selected
IZL as the best concept. The simulation was also applied to optimize the
performance of IZL in terms of the number of pallets. Based on this case study,
we concluded that CDP framework worked well.
doi:10.3926/jiem.2011.v4n2.p206-230 JIEM, 2011 – 4(2): 206-230 – Online ISSN: 2013-0953 Print ISSN: 2013-8423
initiated the relevant discussion by showing the feasibility of CDP as a framework
in this issue.
Practical implications: The CDP and SCLI are very practice-oriented approaches
in the sense that they do not require any complex analytical knowledge.
Originality/value: We discussed a not well-addressed issue with a systematic
framework. In addition, the SCLI presented was also unique.
Keywords: concept development process, lean manufacturing, simulation, value stream
mapping, concept selection
1 Introduction
doi:10.3926/jiem.2011.v4n2.p206-230 JIEM, 2011 – 4(2): 206-230 – Online ISSN: 2013-0953 Print ISSN: 2013-8423
also addressed the integration of VSM and simulation at a large steel mill. They first used VSM to identify the opportunities for lean principles, and then used simulation to analyze and evaluate both current and future state maps. Ferrin, Muller, and Muthler (2005) used simulation as a tool to identify system design and operational requirements before implementing lean process improvements. Hung and Liker (2007) used simulation to identify the effect of batch size on production lead time in a multi-stage assembly line with a pull-based material control policy. They found out that the interaction of quality inspections, logistical policies and equipment reliability has a significant impact on pull system responsiveness. Mehra, Inman and Tuite (2006) applied simulation to evaluate batch size in a continuous process industry. Grimard, Marvel and Standridge (2005) and Maas and Standridge (2005) also provided examples of how to use simulation for future state validation.
However, there are few published papers in the second category. Marvel and Standridge (2009) proposed an enhanced lean design framework by adding simulation modeling and experimentation as a primary validation tool for the future state map. Their simulation-enhanced approach consisted of “lean assessment”, “current state gap”, “future state design”, “future state validation” and “implementation”. They illustrated their approach with two industrial case studies. Lian and Van Landeghem (2007) proposed an integrated simulation model generation procedure using VSM as the data specification methodology, and demonstrated their procedure with software called “SimVSM”. SimVSM automatically develops a simulation model from a VSM model. The procedure was demonstrated on a small manufacturing system with 8 workstations. SigmaFlow (2006) is a commercially available software product to transform a detailed operational level VSM model to a simulation model.
doi:10.3926/jiem.2011.v4n2.p206-230 JIEM, 2011 – 4(2): 206-230 – Online ISSN: 2013-0953 Print ISSN: 2013-8423
sets of critical resources when more specifications are obtained. The HOP-VSM primarily focuses on information sharing for process flow, product scheduling and forecasting, material supply and delivery schedules, etc. without displaying specific Kanban control and scheduling information, whereas an operational level VSM (OL-VSM) focuses more on LMS implementation at an operational level (e.g. shop floor). The HOP-VSM is a useful communication and design vehicle, particularly when there is significant complexity and uncertainty in the process flow as in a new process layout design case.
We could also classify a new process layout design into two types: a logical design and a physical design. The logical design provides logical relationships among all elements in a system (e.g. process sequence and information exchange, etc.) while a physical design displays a physical view or layout of a system with detailed specifications. For example, both VSM and HIP are logical designs, since they provide a logical relationship on how a system works to satisfy requirements without displaying specific physical architectures or interactions. Logical designs are transformed into physical designs when detailed operational level specifications become available. During this transformation, design optimization and validation issues should be considered.
It was noticed that all papers reviewed discussed the design (e.g. future sate) validation issue with well defined operational level VSM’s. However, the design optimization issue was hardly discussed. This paper attempts to initiate discussions dealing with this issue. In doing so, we demonstrate a systematic framework for VSM related design optimization using a case study from an actual portable fire extinguisher company. We discuss the VSM from a new product development perspective (NPD). From the NPD perspective, the design optimization can be accomplished through a concept development process (CDP). Hence, we attempt to use CDP as a framework to solve the process layout design optimization problem identified during the VSM phase.
2 Overview of the Concept Development Process (CDP)
doi:10.3926/jiem.2011.v4n2.p206-230 JIEM, 2011 – 4(2): 206-230 – Online ISSN: 2013-0953 Print ISSN: 2013-8423
target specifications). The goal of the concept generation is to generate any possible concepts that meet the customers’ needs. Typically, concepts are generated through storyboarding and brainstorming.
Figure 1. “Overall concept development process”. Source: Ulrich and Eppinger (2008)
The concept selection is one of the most important stages in the CDP. It evaluates and optimizes the proposed concepts using relevant performance metrics. The concept selection does not simply mean the selection of the best concept suggested but also includes the optimization of the concept through new invention or merger of existing concepts. In this paper, a concept corresponds to a specific process layout design. To properly conduct the concept selection, we propose a performance metric called the system coupling level index (SCLI) and evaluate alternative solutions using simulation. The SCLI is used to measure the topological complexity of a process layout design, whereas simulation is used to evaluate each concept in terms of the time-dependent dynamic performance metric such as system throughput. Both will be described later in detail. The concept test is to evaluate the performance of the selected concept from diverse aspects (e.g. robustness) and what-if scenario analysis may be conducted. Once all of the possible design and process layout alternatives are evaluated, the final specification and detailed product (design) development plans are selected and implemented.
It should be noted that each stages in Figure 2 is iterative. For example, the target specification could be repeated and revised several times until the resulting target specification appropriately reflects the design requirements.
3 Problem descriptions in the case study
doi:10.3926/jiem.2011.v4n2.p206-230 JIEM, 2011 – 4(2): 206-230 – Online ISSN: 2013-0953 Print ISSN: 2013-8423
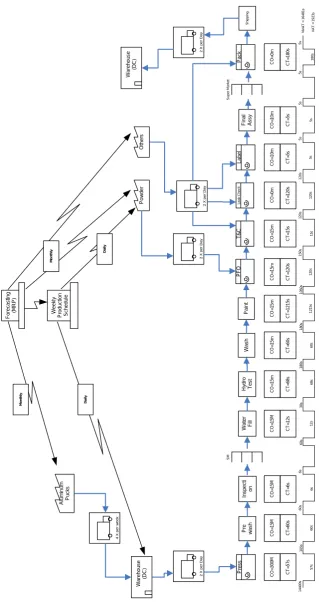
2.90 and 4.50 inches. Weight of the powder varies between 1.35 and 6.00 lb depending upon the size of the cylinder. The company has been building a new facility in Mexico to take advantage of the North America Free Trade Agreement (NAFTA), low production cost and tax benefits. One of the most difficult challenges is to design the process layout to meet the expected annual demand. The project management team began with a VSM approach and generated the future state map shown in Figure 2 through multiple iterations – note that there is no current state map since this is new facility construction.
The future state map shown in Figure 2 provides an overall view of the process layout, material supply, final goods shipment, and production planning and scheduling. For example, the company uses a Material Requirements Planning (MRP) system for weekly supply of raw material. A weekly and monthly MRP-based forecasted production schedule is shared with all suppliers, and the raw material is delivered twice per day to the facility. Inside the facility, an aluminum puck is transformed into a cylinder through a press operation, and this cylinder is then stored in a local supermarket (SM) after washing and inspection to check if there is any crack or leak. Then it is filled with water and a final hydro test conducted. Once the hydro test is completed, the cylinder is cleaned and appropriately painted.
The painted cylinder is then filled with powdered carbon dioxide (CO2) in a power fill operation (PFO). A torque and charge (T&C) quality control check is then conducted to test the pressure that can be sustained inside the cylinder. After this, another leak check is performed and followed by the labeling and final assembly operations sequentially. The final assembly is to add small items such a handle and a hose to the cylinder. The cylinder is then packaged and stored in a finished goods supermarket. The packaged cylinder is transported to a final distribution center twice a day. All operations from the press to the final assembly and packaging (FAP) are connected by conveyor belts.
doi:10.3926/jiem.2011.v4n2.p206-230 JIEM, 2011 – 4(2): 206-230 – Online ISSN: 2013-0953 Print ISSN: 2013-8423
Figure 2. “HOP-VSM - future state map”. Source: authors
Forecasting
(MRP
)
Weekly
Production Schedule
Aluminum Pucks
Monthly
4
X per week
Warehouse
(DC
)
2
X per Day Press Pre wash
Inspecti
on
SM
Water Fill Hydro Test
Wash Paint PFO T & C Leak Check Label
Final Assy
Super Market Pack Shipping Daily Powder Daily Others Monthly 2
X per Day
2
X per Day
2
X per Day
doi:10.3926/jiem.2011.v4n2.p206-230 JIEM, 2011 – 4(2): 206-230 – Online ISSN: 2013-0953 Print ISSN: 2013-8423
The contracted vendors were fully responsible for system assembly, and capacity test, and to meet design requirements. For example, one vendor is responsible for both the powder fill operation (PFO) and torque and charge (T&C) operation at its site. Since both systems are HIP, both are composed of multiple low-level operations – the detailed design is explained later. The vendor was responsible for developing an initial process layout design for the integrated system. However, the team found that its initial process layout design did not always pass the demand capacity test. Solving this issue became an urgent business problem.
4 Application of the Concept Development Process
One of the authors was involved in solving this business problem as a team member. Jeong and Hong (2009) analyzed the system purely from a material handling system analysis perspective. However, this paper attempts to analyze this system from the concept development process perspective. It should be notified that some data has been masked to protect company’s proprietary information. The actual process layout design requires the transformation of a logical design (e.g. VSM and HIPs) to a physical design with more specifications.
Some examples of the identified customer needs include: the integrated system will be fully automated to minimize operator intervention; it will also be designed to facilitate easy installation and maintenance. It should also be capable of producing a minimum of 8.5M units per year. The following are some examples of the design specifications: all operations in PFO and T&C will meet predetermined cycle times. Each operational resource (machine) is connected by a conveyor belt, and the predetermined speed of the conveyor belt is 0.5 inch/sec. Based on annual production requirements, the target throughput per minute (note that the reciprocal of this is called TAKT time), dPFO, with two individual nine hour shifts can be calculated as follows:
dPFO = 8.5M/[(2 shifts)(9 working hours/shift)(5 days/week)(52 weeks/yr)] = 31 units/min
doi:10.3926/jiem.2011.v4n2.p206-230 JIEM, 2011 – 4(2): 206-230 – Online ISSN: 2013-0953 Print ISSN: 2013-8423
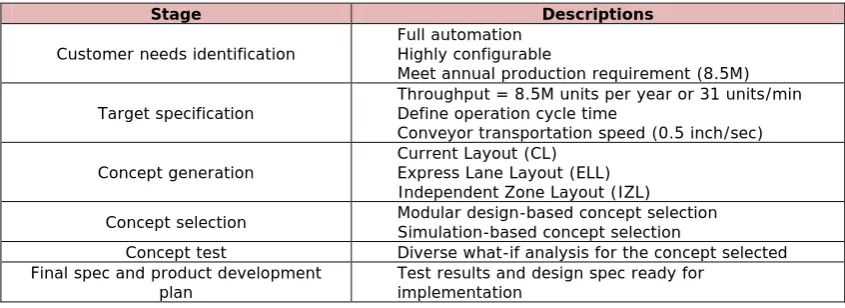
quantitative metrics were used. For a quantitative metric, the authors proposed a modular design-based performance metric called the system coupling level index (SCLI) and simulation. The SCLI is a way to measure the topological complexity of a process layout design, whereas simulation is used to evaluate the concept using specified metrics of performance. Table 1 summarizes information collected at each stage in the CDP.
Stage Descriptions
Customer needs identification •• Full automation Highly configurable
• Meet annual production requirement (8.5M)
Target specification •• Throughput = 8.5M units per year or 31 units/min Define operation cycle time
• Conveyor transportation speed (0.5 inch/sec)
Concept generation •• Current Layout (CL) Express Lane Layout (ELL)
• Independent Zone Layout (IZL) Concept selection •• Modular design-based concept selection Simulation-based concept selection
Concept test • Diverse what-if analysis for the concept selected Final spec and product development
plan • Test results and design spec ready for implementation
Table 1. “Information on concept development process”. Source: authors
4.1 Concept generation
Three concepts were generated through brainstorming.
Current Layout (CL)
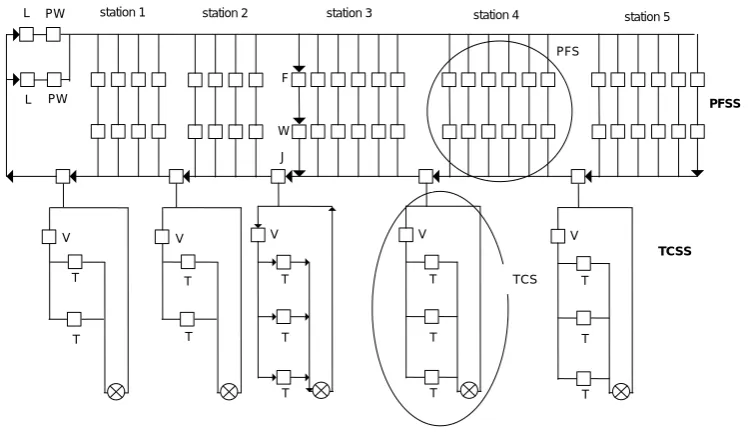
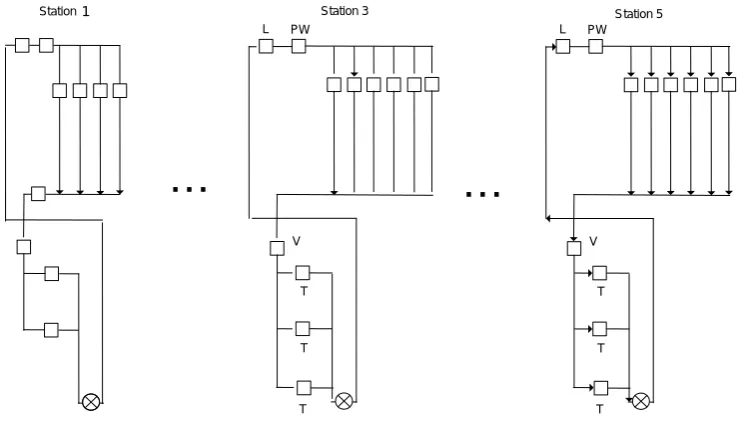
As previously shown in Figure 2, once a cylinder finishes the paint process, it is delivered to the PFO. The current layout (CL) of the integrated PFO and T&C system is shown in Figure 3, where a rectangle and a solid line represent a machine and the conveyor belt respectively, and an arrow indicates the direction of product movement.
doi:10.3926/jiem.2011.v4n2.p206-230 JIEM, 2011 – 4(2): 206-230 – Online ISSN: 2013-0953 Print ISSN: 2013-8423
The TCSS consists of five T&C stations (TCSs), each of which is connected to a corresponding PFS. The first two TCSs have one valve insertion machine (V) and two parallel torque & charge machines (T), while the last three TCSs have one value insertion machine and three parallel torque & charge machines. Note that a PFS and its corresponding TCS meet at a junction (J) and a pick & place operation is performed when a robot arm picks up a filled cylinder from a pallet in the PFS and moves it onto an unloaded pallet in the corresponding TCS.
Figure 3. “Current layout (CL)”. Source: Jeong and Hong (2009)
The operational sequence can be described as follows: Whenever an empty pallet passes through loading machines, the pallet is loaded with an empty cylinder that was fed by the paint process. The weight of the loaded pallet is measured on a pre-weighing machine, and the loaded pallet is assigned to one of powder fill machines available at a specific PFS as determined by the production schedule. Once a cylinder is filled with CO2 at the PFS, its weight is measured on a post-weighing machine, and the pallet with a filled cylinder resumes its movement along the conveyor belt. When it reaches a junction, the filled cylinder is picked up from the pallet and transferred by a robot arm onto an unloaded pallet in the corresponding TCS. Then the original unloaded pallet at the junction moves toward the loading machines in the PFSS, and the newly loaded pallet in the TCS circulates counterclockwise and goes through a valve insertion machine and one of T&C machines. The cylinder is eventually transferred into the next final assembly
PFS
L L
T
station 1 station 2 station 3 station 5
PFSS
TCSS
TCS J
PW PW
W F
station 4
T
T V
T T
T V
T T
T V
T T V
T
T
T
doi:10.3926/jiem.2011.v4n2.p206-230 JIEM, 2011 – 4(2): 206-230 – Online ISSN: 2013-0953 Print ISSN: 2013-8423
process through the transfer machine denoted by the ⊗ mark, and the unloaded pallet continues its travel toward the junction.
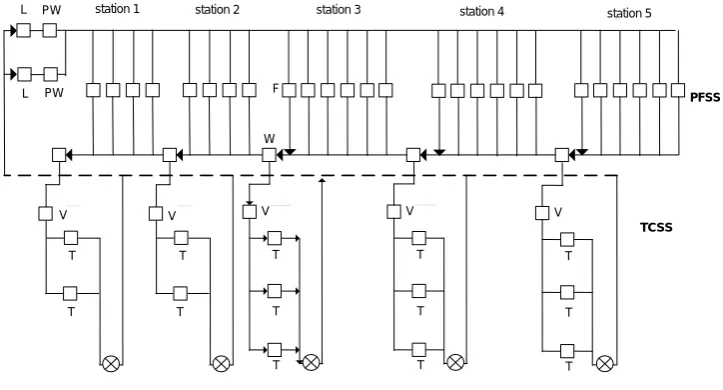
Express Lane Layout (ELL)
In the CL, the loaded pallets in each PFS share the same conveyor belt path when they move toward the loading machines, with the unloaded pallets coming from the downstream PFSs. For example, suppose that a loaded pallet completes its operation at one of the lanes in the third PFS. This pallet shares the same conveyor belt path with the unloaded pallets coming from the fourth and fifth PFSs as it moves toward the loading machine.
Figure 4. “Express lane layout (ELL)”. Source: Jeong and Hong (2009)
This mix of empty and loaded pallets sometimes creates a congestion problem during the initial test. To solve this problem, an express lane layout (ELL) as shown in Figure 4 was designed, where a dedicated express lane (a solid dotted line) is added to exclusively transport the unloaded pallets from the TCSS to loading machines.
The operational sequence in the ELL can be described as follows: Whenever a pallet passes through a loading machine (L), it is loaded with an empty cylinder. The weight of the loaded pallet is then measured on a pre-weighing machine (PW), and the loaded pallet travels to one of the available PFSs. It is then processed at a powder fill machine (F). Once the cylinder on the pallet is filled, its weight is
L
L station 1 station 2 station 3 station 5
PFSS
PW PW
W F
station 4
T
TCSS
T
T V
T T
T V
T T
T V
T T
V V
T
T
T
doi:10.3926/jiem.2011.v4n2.p206-230 JIEM, 2011 – 4(2): 206-230 – Online ISSN: 2013-0953 Print ISSN: 2013-8423
measured on the post-weighing machine (W). Then, without pallet switching, the same loaded pallet with a filled cylinder travels to a corresponding TCS. Once the cylinder finishes its operations at the TCS, it is transferred to the final assembly station through the transfer machine denoted by the ⊗ mark. Then the unloaded pallet resumes its travel toward the loading machines using the express lane. Team expects that the express lane layout can alleviate the congestion observed in the CL since there is no mix of the loaded and unloaded pallets on the returning conveyor belt to the loading machines. Note also that there is no junction between PFS and TCS. The conveyor belt from PFS is installed underneath the express lane using the escalator-like equipment. That is, there is no pick and place operation in this layout.
Independent Zone Layout (IZL)
The independent zone layout (IZL) is shown in Figure 5. It uses a zone control concept where the entire system is split into five independent zones, each of which consists of a PFS and a TCS with its own loading machine. The first two stations have the four-lane zone while the last three have the six-lane zone. Since there is no interaction between zones, this layout simplifies traffic control.
Figure 5. “Independent zone layout (IZL)”. Source: Jeong and Hong (2009)
T PW L
T V
T
. . .
. . .
Station 3 Station 5
Station 1
T PW L
T V
doi:10.3926/jiem.2011.v4n2.p206-230 JIEM, 2011 – 4(2): 206-230 – Online ISSN: 2013-0953 Print ISSN: 2013-8423
4.2 Concept selection
Once all concepts are generated, both qualitative and quantitative concept selection approaches are applied to evaluate all concepts. The qualitative approach is typically based on a domain expert’s observation, and brainstorming, while the quantitative approach is based on system coupling level index and simulation.
Qualitative analysis
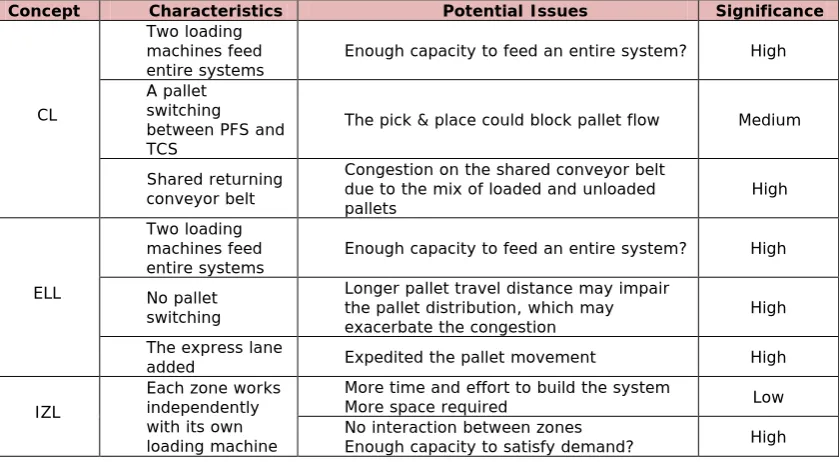
The characteristics and potential issues associated with each characteristic are shown in Table 2. Each concept is identified with one of three estimated significance levels - high, medium or low - as shown in Table 2. Some of the potential issues were pre-identified from domain knowledge and experience with similar systems. It is important to recognize that the following system configuration characteristics (SCC) here.
Concept Characteristics Potential Issues Significance
CL
• Two loading machines feed
entire systems • Enough capacity to feed an entire system? High
• A pallet switching between PFS and TCS
• The pick & place could block pallet flow Medium
• Shared returning conveyor belt
• Congestion on the shared conveyor belt due to the mix of loaded and unloaded
pallets High
ELL
• Two loading machines feed
entire systems • Enough capacity to feed an entire system? High
• No pallet switching
• Longer pallet travel distance may impair the pallet distribution, which may
exacerbate the congestion High
• The express lane
added • Expedited the pallet movement High
IZL
• Each zone works independently with its own loading machine
• More time and effort to build the system
• More space required Low
• No interaction between zones
• Enough capacity to satisfy demand? High
Table 2. “Qualitative concept comparison”. Sources: authors
doi:10.3926/jiem.2011.v4n2.p206-230 JIEM, 2011 – 4(2): 206-230 – Online ISSN: 2013-0953 Print ISSN: 2013-8423
is processed, all other pallets waiting for the processor are lifted from the segment at specific positions in front of the processor while the conveyor belt underneath the lifted pallet is still running. In this way, the material handling system continuously works without any stoppage while the product is processed. However, this SCC has one side effect - The initial distance between pallets could change and this change sometimes adds difficulty to the control of the distance between pallets. This unbalanced distance between pallets could be a reason for frequent system halt due to heavy congestion in a specific segment.
As described in Table 2, some characteristics can introduce both positive and negative effect. For example, in case of ELL, it is expected that the pallet movement might become faster by eliminating the pallet switching. However it also increases each pallet’s travel distance, which adds difficulty to the control of the distance between pallets due to SCC described previously. The team was favorable to the IZL. However, none was sure whether it could meet the demand or not. Qualitative concept analysis provides a useful insight to understanding the overall system but it does not provide any solution for the issues discussed. For example, the team believed that many of these potential issues were related to the topological complexity of each concept. However, there is no specific metric to measure complexity in the process layout design study.
The system coupling level index
doi:10.3926/jiem.2011.v4n2.p206-230 JIEM, 2011 – 4(2): 206-230 – Online ISSN: 2013-0953 Print ISSN: 2013-8423
believe that one way to represent dependence between modules is to calculate the level of interface between modules. A module with higher interfaces is considered more complex than one with lower interfaces. We suggest using an N2 diagram to measure the interface among modules. An N2 matrix is a symmetric (n x n) matrix showing all interfaces among n modules (NASA, 2007). Hence, we proposed the following steps to measure the system coupling level index (SCLI) in this study:
Step 1: Define modules from each concept.
Step 2: Compute total number of possible interfaces (TPI) between modules using an N2 diagram. Define the following equation (1):
Total Possible Interfaces (TPI) = m(m+1)/2 where m is the number of modules
Equation 1. “Index for total possible interface (TPI)”. Source: authors
Step 3: Calculate total number of existing interfaces (TEI) from N2 diagram.
Step 4: Compute the system coupling level index (SCLI) using equation (2)
SCLI = TEI/TPI
Equation 2. “Index for system coupling level (SCLI)”. Source: authors
doi:10.3926/jiem.2011.v4n2.p206-230 JIEM, 2011 – 4(2): 206-230 – Online ISSN: 2013-0953 Print ISSN: 2013-8423
Figure 6. “Conceptual interface schema between modules”. Source: authors
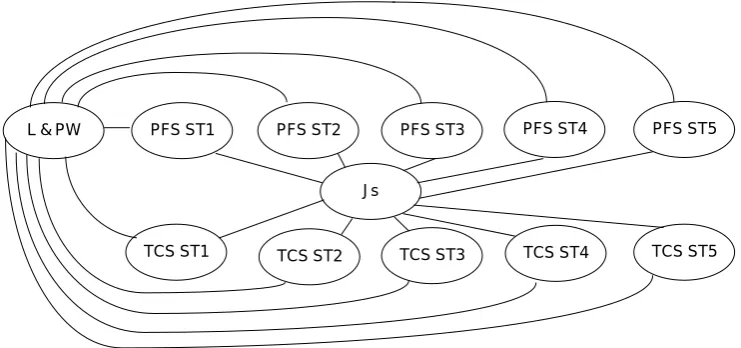
The matrix in Figure 7 is called the N2 matrix and its last column displays the total number of existing interfaces (TEI) for each module denoted in the row.
Figure 7. “N2 matrix for CL”. Source: authors
It is important to recognize that since the matrix was symmetric, it is only necessary to consider the upper diagonal. Hence the sum of the last column in Figure 7 generates the total number of existing interfaces (TEI), 32. According to Equation (1), the TPI is 78 since the CL has 12 modules. This generates the corresponding SCLI of 41. In the case of the ELL, all modules are the same as in the CL except that the ELL has no junction between PFS and TCS, which eliminates the junction module (Js). Hence it has 11 modules. In case of the IZL, each of five zones has three modules (L & PW, PFS and TCS). Since there is no interaction
L & PW PFS ST1 PFS ST2 PFS ST3 PFS ST4 PFS ST5
TCS ST2
TCS ST1 TCS ST3 TCS ST4 TCS ST5
Js
L & PW PFS1 PFS2 PFS3 PFS4 PFS5 Js TCS1 TCS2 TCS3 TCS4 TCS5 Total
L & PW 1 1 1 1 1 1 1 1 1 1 1 11
PFS1 1 1 2
PFS2 1 1 2
PFS3 1 1 2
PFS4 1 1 2
PFS5 1 1 2
Js 1 1 1 1 1 1 6
TCS1 1 1
TCS2 1 1
TCS3 1 1
TCS4 1 1
doi:10.3926/jiem.2011.v4n2.p206-230 JIEM, 2011 – 4(2): 206-230 – Online ISSN: 2013-0953 Print ISSN: 2013-8423
between zones, there are only five clusters in the N2 matrix and its TEI is 30 as shown in Figure 8.
Figure 8. “N2 matrix for IZL”. Source: authors
Table 3 summarizes all SCLIs for all three concepts. The CL is the most complex whereas the IZL is the least complex. The ELL is closer to the CL than the IZL. Based on this analysis, the IZL is the most favorable process layout design in terms of the modular design. It also reveals that the IZL is less complex than the CL and ELL by 39% and 36%, respectively.
Equation 2 well represents the topological complexity of each concept without complex mathematics, and helps to choose better concepts. Based on this SCLI analysis and the result from the initial on-site test, the CL was excluded from further consideration. It is now necessary to analyze dynamic performance metrics and answer relevant questions such as those listed in Table 2 (e.g. could IZL satisfy the capacity requirement?).
Metrics CL ELL IZL
TEI 32 26 30
TPI 78 66 120
SCLI (%) 41 39 25
Table 3. “Concept comparison using SCLI”. Sources: authors
Simulation analysis
Flexsim simulation software (Flexsim, 2006) was used to model both ELL and IZL concepts. Domain experts collected initial process data and the data was sanitized
L&PW1 PFS1 TCS1 L&PW 2 PFS2 TCS2 L&PW 3 PFS3 TCS3 L&PW 4 PFS4 TCS4 L&PW 5 PFS5 TCS5 Total
L&PW1 1 1 1 3
PFS1 1 1 2
TCS1 1 1
L&PW 2 1 1 1 3
PFS2 1 1 2
TCS2 1 1
L&PW 3 1 1 1 3
PFS3 1 1 2
TCS3 1 1
L&PW 4 1 1 1 3
PFS4 1 1 2
TCS4 1 1
L&PW 5 1 1 1 3
PFS5 1 1 2
doi:10.3926/jiem.2011.v4n2.p206-230 JIEM, 2011 – 4(2): 206-230 – Online ISSN: 2013-0953 Print ISSN: 2013-8423
for model development. The physical dimensions of the PFO and T&C system were obtained from its original blueprint of the CL. The dimension of the ELL and IZL layouts was estimated from that of the CL since both are generated from the CL. The velocity of conveyor belt was assumed to be 0.5 inch/sec based on CL system specification. Table 4 summarizes some important processing time input date – note that ‘second’ is used as time unit.
System Operation Average Time (s)
PFOS
Loading 4
Pre-weigh 4
PFO 25
Post-weigh 4
TCOS Valve insertion T&C processing 7.5 15
Transfer to FAP 5
Table 4. “Processing time information”. Source: authors
Simulations were run for one year with a one month warm up period, and replicated five times with following assumptions:
• Since the operation times had little variance, the uniform distribution with 2.5% variation in terms of minimum and maximum was used for all operation times.
• In case of the ELL, pallets were proportionally distributed from loading machines to PFSs according to the number of lanes in the PFS. That is, the pallet distribution probability to PFSs is (4/24, 4/26, 6/26, 6/26, 6/26) where the order of fractions is aligned with the order of PFSs. For example, the total number of lanes in the PFSS is twenty six, and the first two PFSs have four lanes each. That is why 4/26 was used to feed both stations.
• Since the number of pallets sensitively affects the total throughput, the simulation was run with the different number of pallets for different experiments. For ELL, the model was run with number of pallets starting at 55 and incrementing by five to a maximum of 165 pallets. For IZL, the model was run with number of pallets varying from 10 to 30, and incrementing by five for each zone and performance measures calculated.
doi:10.3926/jiem.2011.v4n2.p206-230 JIEM, 2011 – 4(2): 206-230 – Online ISSN: 2013-0953 Print ISSN: 2013-8423
• The ELL could not satisfy the demand capacity requirement. Its average annual capacity ranged between 1.5M and 6M units for all ranges of pallets between 55 and 175. When the number of pallets is greater than or equal to 120 pallets, it frequently halted due to the congestion generated by the previously described system configuration characteristics (SCC).
• For ELL, when the number of pallets increased beyond 120, the express lane became highly congested, blocking the flow of pallets from TCSS as seen in Figure 9. This is because the pallet’s travel distance becomes longer with 120 pallets, and it is difficult to keep the balanced distance between pallets due to SCC. Hence the ELL was excluded from the further consideration.
• In case of the IZL, since there is no interaction between zones, the four-lane and six-four-lane zones could be separately analyzed. Table 5 shows the annual throughput from the simulation output when the number of pallets changes from 10 to 30 by 5 increment. Please note that the throughput increase stops when the number of pallets reaches 15 and 20 in case of the four-lane and six-lane zones, respectively.
Figure 9. “Express zone layout screen”. Source: authors
No. of pallets 10 15 20 25 30
Four-lane zone 1,333,734 1,925,508 1,925,508 1,925,508 1,925,508 Six-lane zone 1,198,773 1,793,707 2,246,419 2,246,419 2,246,419
doi:10.3926/jiem.2011.v4n2.p206-230 JIEM, 2011 – 4(2): 206-230 – Online ISSN: 2013-0953 Print ISSN: 2013-8423
As seen in Table 5, it is interesting to observe that when the number of pallets is smaller than or equal to 15, the four-lane zone has higher throughput than the lane zone. This is probably because the extra capacity is not fully utilized in the six-lane zone, and the pallet’s longer travel distance negatively affects the throughput. However, as the number of pallets increase, the positive effect from the extra capacity becomes more significant than the negative effect from the longer travel distance.
Figure 10. “Throughput against possible pallet combination”. Source: authors
Figure 10 shows the annual capacity of IZL against several possible combinations of the numbers of pallets, which were taken from Table 5.
The x-axis shows the pallet distribution and total number of pallets - The number in parenthesis represents the number of pallets in each of five stations. The dotted line represents the annual capacity requirement – 8.5M units. As seen in the figure, several possible combinations of pallets could satisfy the annual capacity requirement. If the critical number of pallets (CP) is defined as the minimum number of pallets required to maximize the throughput – the number of products produced per time, the preferred IZL has 90 pallets as the system-wide CP. In fact, the IZL with the CP as 90 pallets has 2.0M unit buffer above the annual capacity
6,263,787 6,858,721
7,453,655 8,048,588
8,640,362
9,232,136 9,406,726
9,998,500 10,590,274 10,590,274 10,590,274 6,000,000 6,500,000 7,000,000 7,500,000 8,000,000 8,500,000 9,000,000 9,500,000 10,000,000 10,500,000 11,000,000 (1 0, 10 ,1 0, 10 ,1 0) (1 0, 10 ,1 0, 10 ,1 5) (1 0, 10 ,1 0, 15 ,1 5) (1 0, 10 ,1 5, 15 ,1 5) (1 0, 15 ,1 5, 15 ,1 5) (1 5, 15 ,1 5, 15 ,1 5) (1 0, 10 ,2 0, 20 ,2 0) (1 0, 15 ,2 0, 20 ,2 0) (1 5, 15 ,2 0, 20 ,2 0) (1 5, 20 ,2 0, 20 ,2 0) (2 0, 20 ,2 0, 20 ,2 0)
50 55 60 65 70 75 80 85 90 95 100
doi:10.3926/jiem.2011.v4n2.p206-230 JIEM, 2011 – 4(2): 206-230 – Online ISSN: 2013-0953 Print ISSN: 2013-8423
requirement. In general, adding more pallets beyond CP is not recommended since it generates more congestion without any contribution to the capacity.
4.3 Concept test and product development plan
Based on the results from the qualitative and quantitative analysis, the IZL was selected as the final concept for implementation. A what-if scenario analysis was conducted as part of the concept test stage to evaluate the robustness of the IZL. For example, consider a product mix where a four-lane zone is separately used for aluminum and steel cylinders. The steel cylinder’s PFO time is approximately 55 second per cylinder. Figure 11 graphs annual capacity against the number of pallets used in the four-lane and six-lane zones for aluminum (AL) and steel (ST) cylinders.
Figure 11. “Product mix”. Source: authors
The CP of the four-lane zone with steel cylinders is 15 with a converged capacity 1.2M units. Based on this analysis, an assessment of annual throughput versus the possible combinations of pallets with any product mix can be developed.
Since the IZL was selected as the best concept and it has excess capacity beyond the specified annual requirement, its specifications (e.g. processing time, conveyor belt speed and dimension information etc) were deemed appropriate. In addition, the simulation analysis identified the optimal pallet numbers. All of this information was used in the final product development plan. Although the IZL requires more
1,000,000 1,200,000 1,400,000 1,600,000 1,800,000 2,000,000 2,200,000 2,400,000
10 15 20 25 30
number of pallets
4 lane zone (AL) 6 lane zone (AL) 4 lane zone (ST) 1.9M
2.5M
doi:10.3926/jiem.2011.v4n2.p206-230 JIEM, 2011 – 4(2): 206-230 – Online ISSN: 2013-0953 Print ISSN: 2013-8423
space than the other designs, it was not considered to be a significant factor in the new facility.
5 Discussion
This paper describes a systematic framework for the VSM related design optimization problem, and applied the concept development process (CDP) as a framework to a process layout design problem defined in a leading portable fire extinguisher company.
Within this CDP framework, the authors noticed that design optimization could be considered in two distinct stages of development: the concept generation and concept selection stages. Since concepts are typically generated through brainstorming, the generated concepts may already have some optimized features, particularly if they come from workers on the shop floor with extensive experience. For example, the ELL was improved from the CL with an express lane and the IZL was designed for no interference between zones, by brainstorming. Design optimization was also considered in concept selection. There may be two possibilities in this phase of study: there may be no feasible concept in terms of performance requirements. In this case, the design phase needs to be revisited and the concept generation state repeated, since new design concepts will need to be developed. In the second case, the preliminary design is deemed feasible and design optimization is conducted in the sense that the performance of the selected concept is improved. In this study, the second case occurred relative to the IZL design concept. This case study indicates that the concept development process could become an effective framework when it is supported by appropriate metrics and tools such as SCLI and simulation. Without this CDP, it would have taken extensive real time development and system experimentation to find out a satisfactory solution for the stated business problem.
6 Conclusions and further research
doi:10.3926/jiem.2011.v4n2.p206-230 JIEM, 2011 – 4(2): 206-230 – Online ISSN: 2013-0953 Print ISSN: 2013-8423
concept during the concept selection stage was used to support the CDP framework. Based on the 8.5M unit annual capacity requirement identified, the CDP was effective in identifying three important process design concepts - CL, ELL and IZL. Both ELL and IZL were suggested to overcome the limitations observed in the current layout. As part of the concept selection stage, the SCLI quantified the degree of dependency of modules in a system based on the system’s topology without using complex mathematic and it excluded the CL. Then, the simulation modeling was used to evaluate the overall system performance and it eventually chose the IZL. Simulation also optimized the performance of the IZL by optimizing the number of pallets required to satisfy the capacity requirement.
In general, it would have been very difficult to select and fine tune the best design concept without CDP and simulation. Hence, we believe that the approach mentioned here provides a solid framework to solve VSM related process layout design optimization problems.
This study is intended to provide a framework for successful VSM related design verification. In the future, authors expect further studies to refine and extend this framework. For example, any software development to support this framework and the automatic simulation model development from a generic VSM could be promising research fields. Authors also expect additional studies to apply this or refined framework to an entire VSM using lean technologies as an extension of this study. More detailed design models could be utilized addressing the proper use of TAKT time as a stochastic parameter; determining the proper pallet sizing and conveyor speeds for generic product mixes, and the cost-time tradeoffs of dedicated lines.
References
Abdulmalek, F. A., & Rajgopal, J. (2007). Analyzing the benefits of lean manufacturing and value stream mapping via simulation: A process sector case study. International Journal of Production Economics, 107(1), 223-236.
doi:10.1016/j.ijpe.2006.09.009
doi:10.3926/jiem.2011.v4n2.p206-230 JIEM, 2011 – 4(2): 206-230 – Online ISSN: 2013-0953 Print ISSN: 2013-8423
Defense Acquisition University (2001). System Engineering Fundamental. Defense Acquisition University Press, Fort Belvoir, VA.
Duggan, K. (2002). Creating mixed model value streams. New York, NY: Productivity Press.
Flexsim (2006). Flexsim Simulation Software User Guide Version 3.5. Flexsim Software Products Inc.
Ferrin, D. M., Miller M. J., & Muthler D. (2005). Lean sigma and simulation, so what’s the correlation? Proceedings of the 2005 Winter Simulation Conference. Paper presented at the 2005 Winter Simulation Conference, Orlando, Florida.
Grimard, C., Marvel, J. H., & Standridge C. R. (2005). Validation of the re-design of a manufacturing work cell using simulation. Proceedings of the 2005 Winter Simulation Conference, Orlando, Florida.
doi:10.1109/WSC.2005.1574402
Hung, K.-T., & Liker, J. K. (2007). A simulation study of pull system responsiveness considering production condition influences. International Journal of Industrial and Systems Engineering, 2(2), 123-136.
doi:10.1504/IJISE.2007.011924
Jeong, K., & Hong, J.. (2009). A simulation study for fire extinguisher manufacturing process layout design. International Journal of Management Science and Engineering Management, 4(4), 281-293.
Lian, Y. H., & Van Landeghem, H. (2007). Analyzing the effects of Lean manufacturing using a value stream mapping-based simulation generator. International Journal of Production Research, 45(13), 3037-3058.
doi:10.1080/00207540600791590
Maas, S., & Standridge, C. (2005). Applying simulation to iterative manufacturing cell design. Proceedings of the 2005 Winter Simulation Conference, Orlando, Florida.
doi:10.1109/WSC.2005.1574403
doi:10.3926/jiem.2011.v4n2.p206-230 JIEM, 2011 – 4(2): 206-230 – Online ISSN: 2013-0953 Print ISSN: 2013-8423
McDonald, T., Van Aken, E., & Rentes, A. (2002). Utilizing Simulation to Enhance Value Stream Mapping: A Manufacturing Case Application. International Journal of Logistics, 5(2), 213-232.
doi:10.1080/13675560210148696
Mehra, S., Inman, R. A., & Tuite, G. (2006). A simulation-based comparison of batch sizes in a continuous processing industry. Production Planning & Control, 17(1), 54-66.
doi:10.1080/09537280500363883
NASA (2007). Systems Engineering Handbook, Washington DC.
SigmaFlow. (2006). Process simulation. Retrieved December 15th, 2010, from
http://www.sigmaflow.com/vsm/vsm_software.html.
Ulrich, Karl T., & Eppinger, Steven D. (2008). Product Design and Development. Boston: McGraw-Hill.
Journal of Industrial Engineering and Management, 2011 (www.jiem.org)
Article's contents are provided on a Attribution-Non Commercial 3.0 Creative commons license. Readers are allowed to copy, distribute and communicate article's contents, provided the author's and Journal of Industrial Engineering and Management's names are included. It must not be used for commercial purposes. To see the complete