Cite as
Olszewski R, Szyper-Szczurowska J, Opach M, Bednarczyk P, Zapala J, Szczepanik S. Accuracy of digital dental models using the low-cost DAVID laser scanner. Adv Clin Exp Med. 2019;28(12):1647–1656. doi:10.17219/acem/110318
DOI
10.17219/acem/110318
Copyright
© 2019 by Wroclaw Medical University This is an article distributed under the terms of the Creative Commons Attribution 3.0 Unported (CC BY 3.0) (https://creativecommons.org/licenses/by/3.0/)
Address for correspondence
Raphael Olszewski
E-mail: [email protected]
Funding sources
None declared
Conflict of interest
None declared
Received on December 21, 2018 Review on January 22, 2019 Accepted on June 27, 2019
Published online on November 28, 2019
Abstract
Background.
Accurate laser scanning of plaster casts using validated, low-cost hardware represents a key
issue in 3D orthodontics.
Objectives.
The aim of this study was to compare the accuracy of measurements taken from plaster casts
(gold standard) with digital models of those casts created with a low-cost structural light DAVID laser scanner.
Material and methods.
Five different measurements were taken on each of 14 plaster casts by 2
inde-pendent observers with an electronic caliper. The measurements were repeated 10 times on all 14 plaster
casts by each observer, with a 1-week interval between each set of measurements. All 14 plaster casts were
digitized using a low-cost DAVID SLS 3 laser scanner. The same 5 measurements were performed on each
of the 3D virtual surface models of the 14 plaster casts by 2 independent observers using MeshLab software
in a manner similar to that used with the digital caliper. The measurements were repeated 10 times by the 2
observers with 1 week between each set of measurements.
Results.
The laser-scanned models were more accurate than the plaster cast models in defining
measure-ments based on simple tooth fissures. The accuracy of measuremeasure-ments based on complex tooth fissures were
equivalent for the 2 types of model. For measurements based on interproximal dental contacts, the 2 methods
of measurement were similar and both were notably poor in terms of accuracy.
Conclusions.
Three-dimensional virtual models obtained from the low-cost DAVID laser scanner can be
used clinically, but only for certain types of measurements and indications.
Key words:
orthodontics, laser scanner, digital dental models, plaster cast
Accuracy of digital dental models
using the low-cost DAVID laser scanner
Raphael Olszewski
1,A–F, Joanna Szyper-Szczurowska
2,B–F, Maciej Opach
3,B–F,
Piotr Bednarczyk
4,B–F, Jan Zapala
3,E,F, Stefan Szczepanik
4,A–F1 Department of Oral and Maxillofacial Surgery, Cliniques universitaires Saint-Luc, Catholic University of Louvain, Brussels, Belgium 2 Department of Orthodontics, Jagiellonian University Medical College, Kraków, Poland
3 Department of Cranio-maxillofacial Surgery, Jagiellonian University Medical College, Kraków, Poland 4 Department of Metal Forming, AGH University of Science and Technology, Kraków, Poland
A – research concept and design; B – collection and/or assembly of data; C – data analysis and interpretation; D – writing the article; E – critical revision of the article; F – final approval of the article
Introduction
Digital dental models are used in orthodontics because
they are easy to store, save time and space and facilitate
the sharing of information with colleagues over
the inter-net.
1Digital models do not deteriorate over time.
1Laser
scanners are accessible to clinicians through
a digitiza-tion service, such as OrtoCad (Align Technology Inc.,
San Jose, USA)
2,3or “emodels” (GeoDigm Corp., Falcon
Heights, USA),
2,3through desktop laser scanners (i.e.,
3Shape R500, 3Shape R700, 3Shape R1000, 3Shape R2000,
Medianetx grande, Medianetx colori, DentaCore CS
UL-TRA, Dentaurum OrthoX, Maestro 3D, Imetric IScan
D104i and GC Aadva Lab Scan
4), through cone-beam
computed tomography (CT)
5and, recently, through
in-traoral laser scanners.
6All of these technologies are still
very expensive and limit the spread of digital orthodontics
to the wealthiest clinical practices and private hospitals.
Moreover, desktop laser scanners present sufficient
ac-curacy, so further improvement would not provide
ad-ditional benefit for use in orthodontics.
4Nowak et al.
4concluded that research on laser scanners in orthodontics
and orthognathic surgery should focus primarily
on re-ducing time and cost.
4With the advent of the low-cost three-dimensional (3D)
printing era, a number of companies have also attempted
to develop low-cost laser scanners. Among the 3 types
of low-cost laser scans currently available on the market,
only the DAVID SLS 3 laser scanner provides
a maxi-mum resolution of 0.05% of the scanned object
at a price
of 3,275 USD
(www.aniwaa.com/comparison/3d-scan-ners). Therefore, our objective for this study was
to com-pare the accuracy of measurements taken from plaster
casts (gold standard) with digital models obtained from
the low-cost DAVID laser scanner. The null hypothesis
is that the digital model is as accurate as a plaster-cast
model, and that the low-cost DAVID laser scanner could
be used clinically.
The DAVID SLS 3 laser scanner uses structural light and
consists of a light projector, 2 detectors and a rotary table.
A calibration kit for the device is also provided
by the man-ufacturer. The projector projects 48 light structures onto
the object to be scanned and the detectors analyze
the de-formation of these light structures on the scanned object,
which is rotated on the rotary table.
Material and methods
Initially, 31 plaster-cast models from patients treated
with orthodontics and orthognathic surgery and
present-ing maxillomandibular Angle class III discrepancies were
used. From the 31 plaster casts, we discarded 17 with
miss-ing teeth in the areas of further distance measurements
and selected the remaining 14. The plaster casts were
cre-ated in the same laboratory, and a similar length of time
separated the alginate impression from casting.
2Two
calibrated observers participated in this study. Observer
#1 was an experienced orthodontist, while observer #2
was a maxillofacial surgeon. The 2 examiners were
cali-brated by collaborating on 2 sample cases of plaster casts
and 2 sample cases of laser-scanned casts.
2The measure-ments were directly compared and discussed until final
definition.
2Five measurements (A–E) (Table 1) were performed
on each of the 14 plaster casts by the 2 independent
observ-ers using an electronic caliper (OTLT, Otelo,
Saint-Ouen-l’Aumône, France) with a measurement error of 0.02 mm.
The measurements were repeated on all 14 of the plaster
casts 10 times each by the 2 observers, with a 1-week
in-terval between each set of measurements.
All plaster casts (#1 to #14) were also digitized using
a DAVID SLS 3 laser scanner v. 4.5.3 (DAVID; Antonius
Köster, Meschede, Germany). The scanning angle was
36°. Each digitalized model was created from 10
mea-surements (a full rotation of the table is 360°). The cloud
of points was then analyzed with DAVID SLS 3 software
v. 4.5.3 (Antonius Köster). A 3D virtual surface model
(.obj file) of each plaster cast was saved for further
mea-surements by the 2 observers. Five meamea-surements (A–E)
(Table 1) were performed on each of the 3D virtual surface
models of the 14 plaster casts by 2 independent observers
with MeshLab software (v. 1.3.2) (Consiglio Nazionale
delle Ricerche – CNR, Rome, Italy) in a manner
analo-gous to that employed with the digital caliper.
The mea-surements were repeated on all of the 3D virtual surface
models of the 14 plaster casts 10 times by 2 independent
observers. A 1-week period of time elapsed between each
set of measurements. Measurement A on model #4 was
impossible to perform because one of the premolars was
missing on the plaster-cast model. Palatal width
defini-tion was proposed according to the study by Howe et al.
7Table 1. Definition of the measurements
Name Definition
Measurement A
Anterior width of the upper dental arch: distance between the most lower points of the transversal groove of the first upper premolar teeth.
Measurement B
Posterior width of the upper dental arch: distance between the points of intersection of the transversal groove with the buccal groove of the first upper permanent molar teeth.
Measurement C
Palatal width: distance between the intersection points of the palatal groove with the gingival margin of first upper permanent molar teeth (Howe et al.2).
Measurement D
Anterior width of the lower dental arch: distance between the vestibular contact points of the first and the second lower premolars.
Measurement E
Figure 1 shows the measurements performed
on the plas-ter casts, while Fig. 2 and 3 illustrate the measurements
performed on the laser-scanned virtual 3D models
of the plaster casts.
Results
For statistical analysis, we assumed that
the popula-tion presented a normal distributhe popula-tion. The populathe popula-tions
represent 2 small groups of 14 elements, each consisting
of measurements (Table 1) performed by observer #1 and
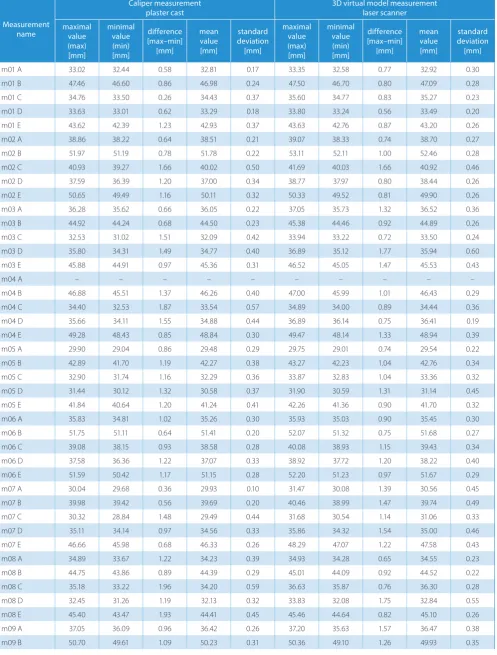
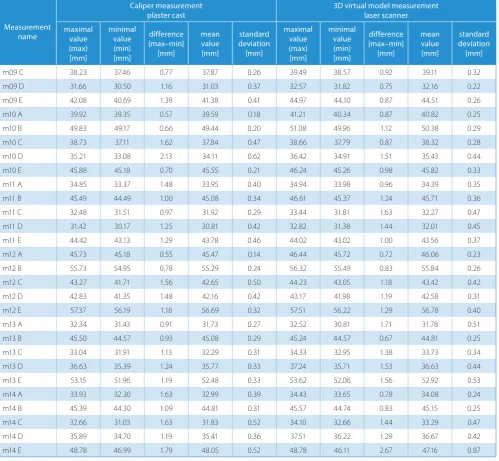
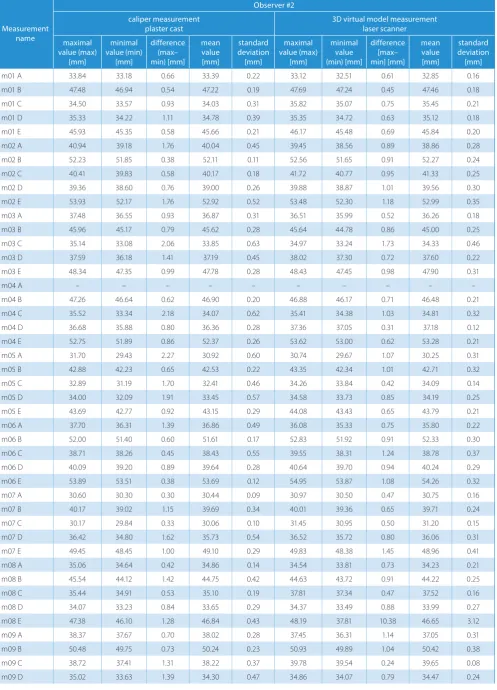
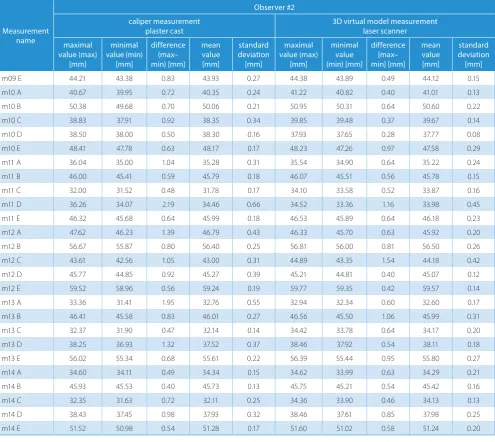
observer #2. Table 2 (observer #1) and Table 3 (observer
#2) show the pairs of measurements obtained from the 14
plaster casts with the minimum and maximum values,
the difference between these values, the mean values, and
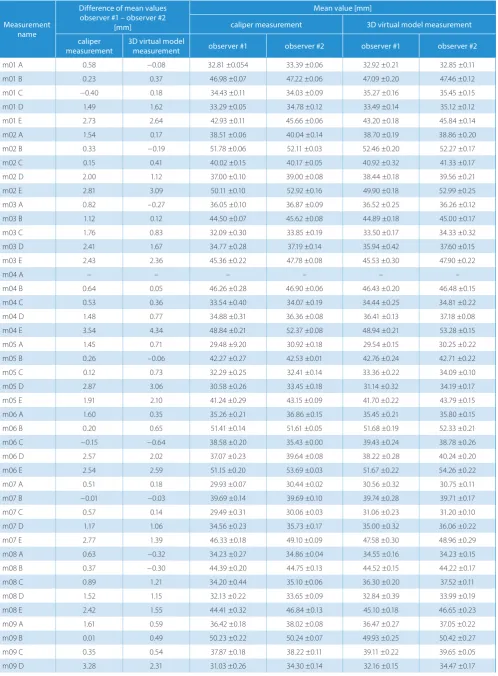
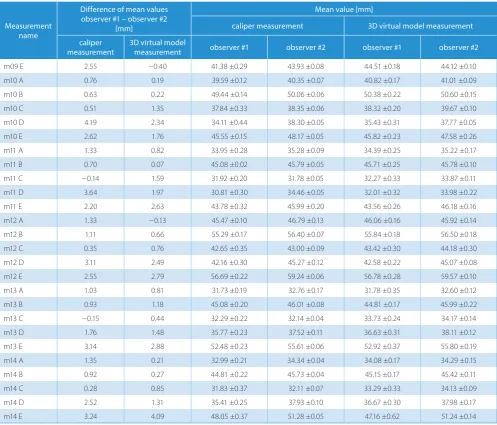
their standard deviation (SD). Table 4 shows a comparison
of the measurements taken by observers #1 and #2 and
the confidence interval (95% CI) with α = 0.05. Table 5
shows the Cis for the differences between
the measure-ments observed by observer #1 and observer #2, according
to the type of method (caliper vs 3D virtual model) and
the type of measurement (A–E).
The CIs for the measurements performed by observer #1
(orthodontist) on the plaster casts and on the digital models are
0.069–0.196 mm and 0.057–0.329 mm, respectively. The CIs
for the measurements performed by observer #2 (maxillofacial
surgeon) on the plaster casts and on the digital models are
0.054–0.408 mm and 0.136–0.429 mm, respectively.
Measurement A was based on the anatomical
defini-tion of a simple tooth fissure. The laser-scanned models
were more accurate than the plaster-cast models
in defin-ing measurement A (Table 5). Measurement B was based
on the anatomical definition of a complex tooth fissure.
Measurement C was based on the intersection between 2
different structures, such as a tooth fissure and
the im-pression of the palatal gingiva on the tooth. The accuracy
of measurements B and C was equivalent for
the laser-scanned and the plaster models. Measurement D was based
on interproximal dental contacts. Measurement E was
based on the tips of cusps (curvature areas). Measurements
D and E were equivalent and provided notably poor
accu-racy. Our findings related to measurements D and E were
in accordance with the literature.
2Fig. 1. Measurements A–C performed on the plaster cast of the upper maxilla. Measurements D and E performed on the plaster cast of the mandible
Fig. 2. Measurements A–C performed on the virtual 3D model of the laser-scanned upper maxilla plaster cast
Table 2. Measurements performed by observer #1
Measurement name
Caliper measurement
plaster cast 3D virtual model measurement laser scanner maximal
value (max) [mm]
minimal value (min) [mm]
difference [max–min]
[mm]
mean value [mm]
standard deviation [mm]
maximal value (max) [mm]
minimal value (min) [mm]
difference [max–min]
[mm]
mean value [mm]
standard deviation [mm]
m01 A 33.02 32.44 0.58 32.81 0.17 33.35 32.58 0.77 32.92 0.30
m01 B 47.46 46.60 0.86 46.98 0.24 47.50 46.70 0.80 47.09 0.28
m01 C 34.76 33.50 0.26 34.43 0.37 35.60 34.77 0.83 35.27 0.23
m01 D 33.63 33.01 0.62 33.29 0.18 33.80 33.24 0.56 33.49 0.20
m01 E 43.62 42.39 1.23 42.93 0.37 43.63 42.76 0.87 43.20 0.26
m02 A 38.86 38.22 0.64 38.51 0.21 39.07 38.33 0.74 38.70 0.27
m02 B 51.97 51.19 0.78 51.78 0.22 53.11 52.11 1.00 52.46 0.28
m02 C 40.93 39.27 1.66 40.02 0.50 41.69 40.03 1.66 40.92 0.46
m02 D 37.59 36.39 1.20 37.00 0.34 38.77 37.97 0.80 38.44 0.26
m02 E 50.65 49.49 1.16 50.11 0.32 50.33 49.52 0.81 49.90 0.26
m03 A 36.28 35.62 0.66 36.05 0.22 37.05 35.73 1.32 36.52 0.36
m03 B 44.92 44.24 0.68 44.50 0.23 45.38 44.46 0.92 44.89 0.26
m03 C 32.53 31.02 1.51 32.09 0.42 33.94 33.22 0.72 33.50 0.24
m03 D 35.80 34.31 1.49 34.77 0.40 36.89 35.12 1.77 35.94 0.60
m03 E 45.88 44.91 0.97 45.36 0.31 46.52 45.05 1.47 45.53 0.43
m04 A – – – – – – – – – –
m04 B 46.88 45.51 1.37 46.26 0.40 47.00 45.99 1.01 46.43 0.29
m04 C 34.40 32.53 1.87 33.54 0.57 34.89 34.00 0.89 34.44 0.36
m04 D 35.66 34.11 1.55 34.88 0.44 36.89 36.14 0.75 36.41 0.19
m04 E 49.28 48.43 0.85 48.84 0.30 49.47 48.14 1.33 48.94 0.39
m05 A 29.90 29.04 0.86 29.48 0.29 29.75 29.01 0.74 29.54 0.22
m05 B 42.89 41.70 1.19 42.27 0.38 43.27 42.23 1.04 42.76 0.34
m05 C 32.90 31.74 1.16 32.29 0.36 33.87 32.83 1.04 33.36 0.32
m05 D 31.44 30.12 1.32 30.58 0.37 31.90 30.59 1.31 31.14 0.45
m05 E 41.84 40.64 1.20 41.24 0.41 42.26 41.36 0.90 41.70 0.32
m06 A 35.83 34.81 1.02 35.26 0.30 35.93 35.03 0.90 35.45 0.30
m06 B 51.75 51.11 0.64 51.41 0.20 52.07 51.32 0.75 51.68 0.27
m06 C 39.08 38.15 0.93 38.58 0.28 40.08 38.93 1.15 39.43 0.34
m06 D 37.58 36.36 1.22 37.07 0.33 38.92 37.72 1.20 38.22 0.40
m06 E 51.59 50.42 1.17 51.15 0.28 52.20 51.23 0.97 51.67 0.29
m07 A 30.04 29.68 0.36 29.93 0.10 31.47 30.08 1.39 30.56 0.45
m07 B 39.98 39.42 0.56 39.69 0.20 40.46 38.99 1.47 39.74 0.49
m07 C 30.32 28.84 1.48 29.49 0.44 31.68 30.54 1.14 31.06 0.33
m07 D 35.11 34.14 0.97 34.56 0.33 35.86 34.32 1.54 35.00 0.46
m07 E 46.66 45.98 0.68 46.33 0.26 48.29 47.07 1.22 47.58 0.43
m08 A 34.89 33.67 1.22 34.23 0.39 34.93 34.28 0.65 34.55 0.23
m08 B 44.75 43.86 0.89 44.39 0.29 45.01 44.09 0.92 44.52 0.22
m08 C 35.18 33.22 1.96 34.20 0.59 36.63 35.87 0.76 36.30 0.28
m08 D 32.45 31.26 1.19 32.13 0.32 33.83 32.08 1.75 32.84 0.55
m08 E 45.40 43.47 1.93 44.41 0.45 45.46 44.64 0.82 45.10 0.26
m09 A 37.05 36.09 0.96 36.42 0.26 37.20 35.63 1.57 36.47 0.38
Discussion
The measurements taken by the orthodontist were more
accurate than those taken by the maxillofacial surgeon,
possibly because of personal experience and the clinical
use of plaster casts in daily orthodontic practice. However,
the mean values differ between the observers and
the meth-ods. The difference in measurements observed between
both observers and both methods may be related
to the ob-server’s aptitude of correctly selecting landmarks which
cor-respond to their theoretical definition. This selection may
be influenced by 1) the subjective interpretation
of the land-mark’s definition, 2) the quality of the occlusal surfaces
and the interproximal contact points of the patient’s teeth,
3) the quality of the impression obtained, 4) the type
of ma-terial used for the plaster cast, 5) the color of the plaster
cast, 6) the color of the 3D virtual rendering
on the com-puter screen, and 7) 3D manipulation of the digital cast
in the software (zooming, rotating and selecting views).
8Measurements A–C performed on the digital models
(Table 5) were included below the threshold difference
of 1.5 mm which was suggested by Profitt as a limiting value
for clinical significance.
9The majority of measurements
D and E were above the threshold difference of 1.5 mm for
both methods (Table 5). Therefore, measurements D and E
should be discarded from further comparative studies
re-garding the accuracy of laser-scanned and plaster-cast
models.
Measurement name
Caliper measurement plaster cast
3D virtual model measurement laser scanner maximal
value (max) [mm]
minimal value (min) [mm]
difference [max–min]
[mm]
mean value [mm]
standard deviation [mm]
maximal value (max) [mm]
minimal value (min) [mm]
difference [max–min]
[mm]
mean value [mm]
standard deviation [mm]
m09 C 38.23 37.46 0.77 37.87 0.26 39.49 38.57 0.92 39.11 0.32
m09 D 31.66 30.50 1.16 31.03 0.37 32.57 31.82 0.75 32.16 0.22
m09 E 42.08 40.69 1.39 41.38 0.41 44.97 44.10 0.87 44.51 0.26
m10 A 39.92 39.35 0.57 39.59 0.18 41.21 40.34 0.87 40.82 0.25
m10 B 49.83 49.17 0.66 49.44 0.20 51.08 49.96 1.12 50.38 0.29
m10 C 38.73 37.11 1.62 37.84 0.47 38.66 37.79 0.87 38.32 0.28
m10 D 35.21 33.08 2.13 34.11 0.62 36.42 34.91 1.51 35.43 0.44
m10 E 45.88 45.18 0.70 45.55 0.21 46.24 45.26 0.98 45.82 0.33
m11 A 34.85 33.37 1.48 33.95 0.40 34.94 33.98 0.96 34.39 0.35
m11 B 45.49 44.49 1.00 45.08 0.34 46.61 45.37 1.24 45.71 0.36
m11 C 32.48 31.51 0.97 31.92 0.29 33.44 31.81 1.63 32.27 0.47
m11 D 31.42 30.17 1.25 30.81 0.42 32.82 31.38 1.44 32.01 0.45
m11 E 44.42 43.13 1.29 43.78 0.46 44.02 43.02 1.00 43.56 0.37
m12 A 45.73 45.18 0.55 45.47 0.14 46.44 45.72 0.72 46.06 0.23
m12 B 55.73 54.95 0.78 55.29 0.24 56.32 55.49 0.83 55.84 0.26
m12 C 43.27 41.71 1.56 42.65 0.50 44.23 43.05 1.18 43.42 0.42
m12 D 42.83 41.35 1.48 42.16 0.42 43.17 41.98 1.19 42.58 0.31
m12 E 57.37 56.19 1.18 56.69 0.32 57.51 56.22 1.29 56.78 0.40
m13 A 32.34 31.43 0.91 31.73 0.27 32.52 30.81 1.71 31.78 0.51
m13 B 45.50 44.57 0.93 45.08 0.29 45.24 44.57 0.67 44.81 0.25
m13 C 33.04 31.91 1.13 32.29 0.31 34.33 32.95 1.38 33.73 0.34
m13 D 36.63 35.39 1.24 35.77 0.33 37.24 35.71 1.53 36.63 0.44
m13 E 53.15 51.96 1.19 52.48 0.33 53.62 52.06 1.56 52.92 0.53
m14 A 33.93 32.30 1.63 32.99 0.39 34.43 33.65 0.78 34.08 0.24
m14 B 45.39 44.30 1.09 44.81 0.31 45.57 44.74 0.83 45.15 0.25
m14 C 32.66 31.03 1.63 31.83 0.52 34.10 32.66 1.44 33.29 0.47
m14 D 35.89 34.70 1.19 35.41 0.36 37.51 36.22 1.29 36.67 0.42
m14 E 48.78 46.99 1.79 48.05 0.52 48.78 46.11 2.67 47.16 0.87
Table 3. Measurements performed by observer #2
Measurement name
Observer #2 caliper measurement
plaster cast 3D virtual model measurement laser scanner maximal
value (max) [mm]
minimal value (min)
[mm]
difference (max– min) [mm]
mean value [mm]
standard deviation [mm]
maximal value (max)
[mm]
minimal value (min) [mm]
difference [max– min] [mm]
mean value [mm]
standard deviation
[mm]
m01 A 33.84 33.18 0.66 33.39 0.22 33.12 32.51 0.61 32.85 0.16
m01 B 47.48 46.94 0.54 47.22 0.19 47.69 47.24 0.45 47.46 0.18
m01 C 34.50 33.57 0.93 34.03 0.31 35.82 35.07 0.75 35.45 0.21
m01 D 35.33 34.22 1.11 34.78 0.39 35.35 34.72 0.63 35.12 0.18
m01 E 45.93 45.35 0.58 45.66 0.21 46.17 45.48 0.69 45.84 0.20
m02 A 40.94 39.18 1.76 40.04 0.45 39.45 38.56 0.89 38.86 0.28
m02 B 52.23 51.85 0.38 52.11 0.11 52.56 51.65 0.91 52.27 0.24
m02 C 40.41 39.83 0.58 40.17 0.18 41.72 40.77 0.95 41.33 0.25
m02 D 39.36 38.60 0.76 39.00 0.26 39.88 38.87 1.01 39.56 0.30
m02 E 53.93 52.17 1.76 52.92 0.52 53.48 52.30 1.18 52.99 0.35
m03 A 37.48 36.55 0.93 36.87 0.31 36.51 35.99 0.52 36.26 0.18
m03 B 45.96 45.17 0.79 45.62 0.28 45.64 44.78 0.86 45.00 0.25
m03 C 35.14 33.08 2.06 33.85 0.63 34.97 33.24 1.73 34.33 0.46
m03 D 37.59 36.18 1.41 37.19 0.45 38.02 37.30 0.72 37.60 0.22
m03 E 48.34 47.35 0.99 47.78 0.28 48.43 47.45 0.98 47.90 0.31
m04 A – – – – – – – – – –
m04 B 47.26 46.64 0.62 46.90 0.20 46.88 46.17 0.71 46.48 0.21
m04 C 35.52 33.34 2.18 34.07 0.62 35.41 34.38 1.03 34.81 0.32
m04 D 36.68 35.88 0.80 36.36 0.28 37.36 37.05 0.31 37.18 0.12
m04 E 52.75 51.89 0.86 52.37 0.26 53.62 53.00 0.62 53.28 0.21
m05 A 31.70 29.43 2.27 30.92 0.60 30.74 29.67 1.07 30.25 0.31
m05 B 42.88 42.23 0.65 42.53 0.22 43.35 42.34 1.01 42.71 0.32
m05 C 32.89 31.19 1.70 32.41 0.46 34.26 33.84 0.42 34.09 0.14
m05 D 34.00 32.09 1.91 33.45 0.57 34.58 33.73 0.85 34.19 0.25
m05 E 43.69 42.77 0.92 43.15 0.29 44.08 43.43 0.65 43.79 0.21
m06 A 37.70 36.31 1.39 36.86 0.49 36.08 35.33 0.75 35.80 0.22
m06 B 52.00 51.40 0.60 51.61 0.17 52.83 51.92 0.91 52.33 0.30
m06 C 38.71 38.26 0.45 38.43 0.55 39.55 38.31 1.24 38.78 0.37
m06 D 40.09 39.20 0.89 39.64 0.28 40.64 39.70 0.94 40.24 0.29
m06 E 53.89 53.51 0.38 53.69 0.12 54.95 53.87 1.08 54.26 0.32
m07 A 30.60 30.30 0.30 30.44 0.09 30.97 30.50 0.47 30.75 0.16
m07 B 40.17 39.02 1.15 39.69 0.34 40.01 39.36 0.65 39.71 0.24
m07 C 30.17 29.84 0.33 30.06 0.10 31.45 30.95 0.50 31.20 0.15
m07 D 36.42 34.80 1.62 35.73 0.54 36.52 35.72 0.80 36.06 0.31
m07 E 49.45 48.45 1.00 49.10 0.29 49.83 48.38 1.45 48.96 0.41
m08 A 35.06 34.64 0.42 34.86 0.14 34.54 33.81 0.73 34.23 0.21
m08 B 45.54 44.12 1.42 44.75 0.42 44.63 43.72 0.91 44.22 0.25
m08 C 35.44 34.91 0.53 35.10 0.19 37.81 37.34 0.47 37.52 0.16
m08 D 34.07 33.23 0.84 33.65 0.29 34.37 33.49 0.88 33.99 0.27
m08 E 47.38 46.10 1.28 46.84 0.43 48.19 37.81 10.38 46.65 3.12
m09 A 38.37 37.67 0.70 38.02 0.28 37.45 36.31 1.14 37.05 0.31
m09 B 50.48 49.75 0.73 50.24 0.23 50.93 49.89 1.04 50.42 0.38
m09 C 38.72 37.41 1.31 38.22 0.37 39.78 39.54 0.24 39.65 0.08
Our results were difficult to compare with reports
in the literature because studies comparing plaster and
digital dental models used considerably different
method-ologies, with variable numbers of observers, observations
and repetitions of measurements, as well as using different
types of digital calipers, laser scans, file formats, and
soft-ware for reconstruction and analysis.
10Better
standardiza-tion is required in order to compare studies and to find
stronger evidence for the accuracy of digital models.
More-over, even though measurement with caliper on a plaster
cast is recognized as the gold standard, we also found
er-rors in the measurements using this method, which follows
the same pattern as those performed using digital models.
A methodological alternative may be a comparison
of mea-surements of digital models using a validated industrial
laser scanner (gold standard) and a low-cost laser scanner
using the same software for measurements.
In conclusion, the null hypothesis was partially
accept-ed. Three-dimensional virtual models from the low-cost
DAVID laser scanner can be used clinically, but only for
certain types of measurements (types A, B and C).
The low-cost DAVID laser scanner cannot be used clinically for
measurements related to interproximal contact points.
Therefore, the DAVID laser scanner is not suitable for
analyses of teeth width, such as Bolton analysis.
11ORCID iDs
Raphael Olszewski https://orcid.org/0000-0002-2211-7731 Joanna Szyper-Szczurowska https://orcid.org/0000-0003-3354-1287 Maciej Opach https://orcid.org/0000-0003-0728-5945
Piotr Bednarczyk https://orcid.org/0000-0003-3725-5894 Jan Zapala https://orcid.org/0000-0002-5439-9614 Stefan Szczepanik https://orcid.org/0000-0001-8680-7750
Measurement name
Observer #2 caliper measurement
plaster cast 3D virtual model measurement laser scanner maximal
value (max) [mm]
minimal value (min)
[mm]
difference (max– min) [mm]
mean value [mm]
standard deviation
[mm]
maximal value (max)
[mm]
minimal value (min) [mm]
difference [max– min] [mm]
mean value [mm]
standard deviation [mm]
m09 E 44.21 43.38 0.83 43.93 0.27 44.38 43.89 0.49 44.12 0.15
m10 A 40.67 39.95 0.72 40.35 0.24 41.22 40.82 0.40 41.01 0.13
m10 B 50.38 49.68 0.70 50.06 0.21 50.95 50.31 0.64 50.60 0.22
m10 C 38.83 37.91 0.92 38.35 0.34 39.85 39.48 0.37 39.67 0.14
m10 D 38.50 38.00 0.50 38.30 0.16 37.93 37.65 0.28 37.77 0.08
m10 E 48.41 47.78 0.63 48.17 0.17 48.23 47.26 0.97 47.58 0.29
m11 A 36.04 35.00 1.04 35.28 0.31 35.54 34.90 0.64 35.22 0.24
m11 B 46.00 45.41 0.59 45.79 0.18 46.07 45.51 0.56 45.78 0.15
m11 C 32.00 31.52 0.48 31.78 0.17 34.10 33.58 0.52 33.87 0.16
m11 D 36.26 34.07 2.19 34.46 0.66 34.52 33.36 1.16 33.98 0.45
m11 E 46.32 45.68 0.64 45.99 0.18 46.53 45.89 0.64 46.18 0.23
m12 A 47.62 46.23 1.39 46.79 0.43 46.33 45.70 0.63 45.92 0.20
m12 B 56.67 55.87 0.80 56.40 0.25 56.81 56.00 0.81 56.50 0.26
m12 C 43.61 42.56 1.05 43.00 0.31 44.89 43.35 1.54 44.18 0.42
m12 D 45.77 44.85 0.92 45.27 0.39 45.21 44.81 0.40 45.07 0.12
m12 E 59.52 58.96 0.56 59.24 0.19 59.77 59.35 0.42 59.57 0.14
m13 A 33.36 31.41 1.95 32.76 0.55 32.94 32.34 0.60 32.60 0.17
m13 B 46.41 45.58 0.83 46.01 0.27 46.56 45.50 1.06 45.99 0.31
m13 C 32.37 31.90 0.47 32.14 0.14 34.42 33.78 0.64 34.17 0.20
m13 D 38.25 36.93 1.32 37.52 0.37 38.46 37.92 0.54 38.11 0.18
m13 E 56.02 55.34 0.68 55.61 0.22 56.39 55.44 0.95 55.80 0.27
m14 A 34.60 34.11 0.49 34.34 0.15 34.62 33.99 0.63 34.29 0.21
m14 B 45.93 45.53 0.40 45.73 0.13 45.75 45.21 0.54 45.42 0.16
m14 C 32.35 31.63 0.72 32.11 0.25 34.36 33.90 0.46 34.13 0.13
m14 D 38.43 37.45 0.98 37.93 0.32 38.46 37.61 0.85 37.98 0.25
m14 E 51.52 50.98 0.54 51.28 0.17 51.60 51.02 0.58 51.24 0.20
Table 4. Comparison of the measurements between observers #1 and #2 and the confidence interval with α = 0.05
Measurement name
Difference of mean values observer #1 – observer #2
[mm]
Mean value [mm]
caliper measurement 3D virtual model measurement
caliper measurement
3D virtual model
measurement observer #1 observer #2 observer #1 observer #2
m01 A 0.58 −0.08 32.81 ±0.054 33.39 ±0.06 32.92 ±0.21 32.85 ±0.11
m01 B 0.23 0.37 46.98 ±0.07 47.22 ±0.06 47.09 ±0.20 47.46 ±0.12
m01 C −0.40 0.18 34.43 ±0.11 34.03 ±0.09 35.27 ±0.16 35.45 ±0.15
m01 D 1.49 1.62 33.29 ±0.05 34.78 ±0.12 33.49 ±0.14 35.12 ±0.12
m01 E 2.73 2.64 42.93 ±0.11 45.66 ±0.06 43.20 ±0.18 45.84 ±0.14
m02 A 1.54 0.17 38.51 ±0.06 40.04 ±0.14 38.70 ±0.19 38.86 ±0.20
m02 B 0.33 −0.19 51.78 ±0.06 52.11 ±0.03 52.46 ±0.20 52.27 ±0.17
m02 C 0.15 0.41 40.02 ±0.15 40.17 ±0.05 40.92 ±0.32 41.33 ±0.17
m02 D 2.00 1.12 37.00 ±0.10 39.00 ±0.08 38.44 ±0.18 39.56 ±0.21
m02 E 2.81 3.09 50.11 ±0.10 52.92 ±0.16 49.90 ±0.18 52.99 ±0.25
m03 A 0.82 –0.27 36.05 ±0.10 36.87 ±0.09 36.52 ±0.25 36.26 ±0.12
m03 B 1.12 0.12 44.50 ±0.07 45.62 ±0.08 44.89 ±0.18 45.00 ±0.17
m03 C 1.76 0.83 32.09 ±0.30 33.85 ±0.19 33.50 ±0.17 34.33 ±0.32
m03 D 2.41 1.67 34.77 ±0.28 37.19 ±0.14 35.94 ±0.42 37.60 ±0.15
m03 E 2.43 2.36 45.36 ±0.22 47.78 ±0.08 45.53 ±0.30 47.90 ±0.22
m04 A – – – – – –
m04 B 0.64 0.05 46.26 ±0.28 46.90 ±0.06 46.43 ±0.20 46.48 ±0.15
m04 C 0.53 0.36 33.54 ±0.40 34.07 ±0.19 34.44 ±0.25 34.81 ±0.22
m04 D 1.48 0.77 34.88 ±0.31 36.36 ±0.08 36.41 ±0.13 37.18 ±0.08
m04 E 3.54 4.34 48.84 ±0.21 52.37 ±0.08 48.94 ±0.21 53.28 ±0.15
m05 A 1.45 0.71 29.48 ±9.20 30.92 ±0.18 29.54 ±0.15 30.25 ±0.22
m05 B 0.26 –0.06 42.27 ±0.27 42.53 ±0.01 42.76 ±0.24 42.71 ±0.22
m05 C 0.12 0.73 32.29 ±0.25 32.41 ±0.14 33.36 ±0.22 34.09 ±0.10
m05 D 2.87 3.06 30.58 ±0.26 33.45 ±0.18 31.14 ±0.32 34.19 ±0.17
m05 E 1.91 2.10 41.24 ±0.29 43.15 ±0.09 41.70 ±0.22 43.79 ±0.15
m06 A 1.60 0.35 35.26 ±0.21 36.86 ±0.15 35.45 ±0.21 35.80 ±0.15
m06 B 0.20 0.65 51.41 ±0.14 51.61 ±0.05 51.68 ±0.19 52.33 ±0.21
m06 C −0.15 −0.64 38.58 ±0.20 35.43 ±0.00 39.43 ±0.24 38.78 ±0.26
m06 D 2.57 2.02 37.07 ±0.23 39.64 ±0.08 38.22 ±0.28 40.24 ±0.20
m06 E 2.54 2.59 51.15 ±0.20 53.69 ±0.03 51.67 ±0.22 54.26 ±0.22
m07 A 0.51 0.18 29.93 ±0.07 30.44 ±0.02 30.56 ±0.32 30.75 ±0.11
m07 B −0.01 −0.03 39.69 ±0.14 39.69 ±0.10 39.74 ±0.28 39.71 ±0.17
m07 C 0.57 0.14 29.49 ±0.31 30.06 ±0.03 31.06 ±0.23 31.20 ±0.10
m07 D 1.17 1.06 34.56 ±0.23 35.73 ±0.17 35.00 ±0.32 36.06 ±0.22
m07 E 2.77 1.39 46.33 ±0.18 49.10 ±0.09 47.58 ±0.30 48.96 ±0.29
m08 A 0.63 −0.32 34.23 ±0.27 34.86 ±0.04 34.55 ±0.16 34.23 ±0.15 m08 B 0.37 −0.30 44.39 ±0.20 44.75 ±0.13 44.52 ±0.15 44.22 ±0.17
m08 C 0.89 1.21 34.20 ±0.44 35.10 ±0.06 36.30 ±0.20 37.52 ±0.11
m08 D 1.52 1.15 32.13 ±0.22 33.65 ±0.09 32.84 ±0.39 33.99 ±0.19
m08 E 2.42 1.55 44.41 ±0.32 46.84 ±0.13 45.10 ±0.18 46.65 ±0.23
m09 A 1.61 0.59 36.42 ±0.18 38.02 ±0.08 36.47 ±0.27 37.05 ±0.22
m09 B 0.01 0.49 50.23 ±0.22 50.24 ±0.07 49.93 ±0.25 50.42 ±0.27
m09 C 0.35 0.54 37.87 ±0.18 38.22 ±0.11 39.11 ±0.22 39.65 ±0.05
Measurement name
Difference of mean values observer #1 – observer #2
[mm]
Mean value [mm]
caliper measurement 3D virtual model measurement
caliper
measurement 3D virtual model measurement observer #1 observer #2 observer #1 observer #2 m09 E 2.55 −0.40 41.38 ±0.29 43.93 ±0.08 44.51 ±0.18 44.12 ±0.10
m10 A 0.76 0.19 39.59 ±0.12 40.35 ±0.07 40.82 ±0.17 41.01 ±0.09
m10 B 0.63 0.22 49.44 ±0.14 50.06 ±0.06 50.38 ±0.22 50.60 ±0.15
m10 C 0.51 1.35 37.84 ±0.33 38.35 ±0.06 38.32 ±0.20 39.67 ±0.10
m10 D 4.19 2.34 34.11 ±0.44 38.30 ±0.05 35.43 ±0.31 37.77 ±0.05
m10 E 2.62 1.76 45.55 ±0.15 48.17 ±0.05 45.82 ±0.23 47.58 ±0.26
m11 A 1.33 0.82 33.95 ±0.28 35.28 ±0.09 34.39 ±0.25 35.22 ±0.17
m11 B 0.70 0.07 45.08 ±0.02 45.79 ±0.05 45.71 ±0.25 45.78 ±0.10
m11 C −0.14 1.59 31.92 ±0.20 31.78 ±0.05 32.27 ±0.33 33.87 ±0.11
m11 D 3.64 1.97 30.81 ±0.30 34.46 ±0.05 32.01 ±0.32 33.98 ±0.22
m11 E 2.20 2.63 43.78 ±0.32 45.99 ±0.20 43.56 ±0.26 46.18 ±0.16
m12 A 1.33 −0.13 45.47 ±0.10 46.79 ±0.13 46.06 ±0.16 45.92 ±0.14
m12 B 1.11 0.66 55.29 ±0.17 56.40 ±0.07 55.84 ±0.18 56.50 ±0.18
m12 C 0.35 0.76 42.65 ±0.35 43.00 ±0.09 43.42 ±0.30 44.18 ±0.30
m12 D 3.11 2.49 42.16 ±0.30 45.27 ±0.12 42.58 ±0.22 45.07 ±0.08
m12 E 2.55 2.79 56.69 ±0.22 59.24 ±0.06 56.78 ±0.28 59.57 ±0.10
m13 A 1.03 0.81 31.73 ±0.19 32.76 ±0.17 31.78 ±0.35 32.60 ±0.12
m13 B 0.93 1.18 45.08 ±0.20 46.01 ±0.08 44.81 ±0.17 45.99 ±0.22
m13 C −0.15 0.44 32.29 ±0.22 32.14 ±0.04 33.73 ±0.24 34.17 ±0.14
m13 D 1.76 1.48 35.77 ±0.23 37.52 ±0.11 36.63 ±0.31 38.11 ±0.12
m13 E 3.14 2.88 52.48 ±0.23 55.61 ±0.06 52.92 ±0.37 55.80 ±0.19
m14 A 1.35 0.21 32.99 ±0.21 34.34 ±0.04 34.08 ±0.17 34.29 ±0.15
m14 B 0.92 0.27 44.81 ±0.22 45.73 ±0.04 45.15 ±0.17 45.42 ±0.11
m14 C 0.28 0.85 31.83 ±0.37 32.11 ±0.07 33.29 ±0.33 34.13 ±0.09
m14 D 2.52 1.31 35.41 ±0.25 37.93 ±0.10 36.67 ±0.30 37.98 ±0.17
m14 E 3.24 4.09 48.05 ±0.37 51.28 ±0.05 47.16 ±0.62 51.24 ±0.14
Table 5. Threshold differences of the measurements between the 2 observers and the 2 methods
Threshold [mm] Method of measurement Measurement A Measurement B Measurement C Measurement D Measurement E
<0.5 plaster cast 0 7 9 0 0
laser scan 10 11 5 0 1
0.51–1.00 plaster cast 5 5 4 0 0
laser scan 4 2 6 1 0
1.01–1.50 plaster cast 6 2 0 3 0
laser scan 0 1 2 5 1
1.51–2.00 plaster cast 3 0 1 3 1
laser scan 0 0 1 3 2
>2 plaster cast 0 0 0 8 13
laser scan 0 0 0 5 10
References
1. Jiménez-Gayosso SI, Lara-Carrillo E, López-González S, et al. Differ-ence between manual and digital measurements of dental arches of orthodontic patients. Medicine (Baltimore). 2018;97(22):e10887. 2. Reuschl RP, Heuer W, Stiesch M, Wenzel D, Dittmer MP. Reliability
and validity of measurements on digital study models and plaster models. Eur J Orthod. 2016;38(1):22–26.
3. Peluso MJ, Josell SD, Levine SW, Lorei BJ. Digital models: An intro-duction. Semin Orthod. 2004;10(3):226–238.
4. Nowak R, Wesemann C, Robben J, Muallah J, Bumann A. An in-vitro study comparing the accuracy of full-arch casts digitized with desk-top scanners. Quintessence Int. 2017;20:667–676.
5. Robben J, Muallah J, Wesemann C, et al. Suitability and accuracy of CBCT model scan: An in vitro study. Int J Comput Dent. 2017;20(4): 363–375.
6. Goracci C, Franchi L, Vichi A, Ferrari M. Accuracy, reliability, and effi-ciency of intraoral scanners for full-arch impressions: A systematic review of the clinical evidence. Eur J Orthod. 2016;38(4):422–428.
7. Howe RP, McNamara JA, Jr, O’Connor KA. An examination of dental crowding and its relationship to tooth size and arch dimension. Am J Orthod. 1983;83(5):363–373.
8. Horton HM, Miller JR, Gaillard PR, Larson BE. Technique comparison for efficient orthodontic tooth measurements using digital models. Angle Orthod. 2010;80(2):254–261.
9. Kim J, Lagravére MO. Accuracy of Bolton analysis measured in laser scanned digital models compared with plaster models (gold stan-dard) and cone-beam computer tomography images. Korean J Orthod. 2016;46(1):13–19.