D
OROTAD
ZIANNOT−P
ABIJAN1, B
ARBARAM
ASŁOWSKA1, D
ANIELK
OTSCHY2, M
ARIAK
OTSCHY3Plasmin–
αα
2−Antiplasmin Complexes
in Acute Ischemic Stroke
Kompleksy plazmina–
αα
2−antyplazmina
w ostrym okresie udaru niedokrwiennego mózgu
1Department of Neurology, Dr. J. Biziel Memorial Voivodship Hospital, Bydgoszcz, Poland 2Department of Angiology, Voivodship Hospital, Wrocław, Poland
3Chair and Division of Pathophysiology, Medical University, Bydgoszcz, Poland
Abstract
Background.In acute and chronic ischemic stroke, different hemostatic disturbances are described. Plasmin–α2−
antiplasmin complexes present in the blood reflect the formation of plasmin in vivo.
Objectives.The aim of the study was to determine the concentration of PAP complexes in the blood of patients with ischemic stroke during the first 24 hours after onset and the influence of patient age, extent of stroke, and some risk factors (hypertension, hypercholesterolemia, ischemic heart disease, atrial fibrillation, diabetes mellitus, and smoking) on the concentration of PAP complexes.
Material and Methods.The examined group consisted of 73 patients aged 42–90 years with ischemic stroke diag− nosed for the first time. The control group consists of 30 healthy persons aged 40–65 years. The concentration of PAP complexes was determined in citrate plasma with ELISA and of plasminogen (PL) and α2−antiplasmin (α2−AP)
with chromogenic substrates (Behring).
Results.The PAP complexes were significantly higher in the patient group than in the controls and increased with patient age and the extent of stroke. The risk factors for ischemic stroke had no influence on the PAP level. Conclusions.In acute ischemic stroke, increased concentration of PAP complexes indicated higher plasmin gen− eration in vivo. PAP increased with patient age and were significantly higher in extensive stroke. The risk factors for ischemic stroke had no influence on PAP level (Adv Clin Exp Med. 2006, 15, 5, 797–801).
Key words:ischemic stroke, plasmin–α2−antiplasmin complexes.
Streszczenie
Wprowadzenie.W ostrym i późnym okresie udaru niedokrwiennego mózgu występują zaburzenia hemostazy. Do− brym wskaźnikiem plazminogenezy in vivojest stężenie kompleksów plazmina–α2−antyplazmina (PAP).
Cel pracy.Ocena stężenia tego wskaźnika we krwi chorych będących w pierwszej dobie udaru niedokrwiennego mózgu w porównaniu z grupą kontrolną oraz stężenia kompleksów PAP w zależności od wieku pacjentów, rozle− głości niedokrwienia mózgu (grupy Oxfordshire Classification) i obecności wybranych czynników ryzyka udaru, takich jak: nadciśnienie tętnicze, hipercholesterolemia, choroba niedokrwienna serca, migotanie przedsionków, cu− krzyca oraz palenie papierosów.
Materiał i metody.Badaniem objęto 73 chorych w wieku 42–90 lat, u których objawy udaru niedokrwiennego mózgu wystąpiły po raz pierwszy w życiu. Grupę kontrolną stanowiło 30 zdrowych osób w wieku 40–65 lat. Stę− żenie kompleksów PAP oznaczono w osoczu krwi cytrynianowej metodą immunoenzymatyczną, a stężenie plazmi− nogenu iα2−antyplazminy na substratach chromogennych.
Wyniki. Stężenie kompleksów PAP było istotnie większe w grupie chorych w porównaniu z grupą kontrolną i zwiększało się wraz z wiekiem pacjentów. Stężenie tego wskaźnika było największe u chorych w grupie TACI (z najbardziej rozległym udarem mózgu)
Wnioski. W ostrej fazie udaru niedokrwiennego mózgu stwierdzono podwyższone stężenie kompleksów PAP świadczące o wzmożonej generacji plazminy in vivo. Stężenie kompleksów PAP zwiększa się wraz z wiekiem i rozległością zawału mózgu. Obecność czynników ryzyka udaru mózgu nie wpłynęła na stężenia kompleksów PAP (Adv Clin Exp Med. 2006, 15, 5, 797–801).
In acute and chronic ischemic stroke, hemo− static abnormalities change the balance towards coagulation by activating blood platelets, coagula− tion, and fibrinolysis. Plasmin is the most impor− tant enzyme in fibrinolysis activation. In the blood it is immediately inactivated by inhibitors, espe− cially α2−antiplasmin, and forms the inactive com−
plex plasmin–α2−antiplasmin (PAP). The PAP
complex is a direct indicator of plasmin generation
in vivo. It is possible to estimate the results of plas− min activity on fibrinogen and fibrin (FDP, D−dimers). In the literature there are more data about disturbances in fibrinolysis in coronary artery disease than in stroke [1–6].
The aim of this study was to determine the lev− els of PAP complexes in the blood of patients with ischemic stroke during the first 24 hours after onset and the influence of the patients’ age, extent of stroke, and some risk factors (hypertension, hyper− cholesterolemia, ischemic heart disease, atrial fibril− lation, diabetes mellitus, and smoking) on the con− centration of PAP complexes. The levels of plas− minogen (PL) and α2−antiplasmin (α2−AP) in the
patients and the control group were also determined.
Material and Methods
The examined group consisted of 73 patients (36 women, 37 men) aged 42–90 years (mean age: 68 ±11.6) who had been admitted to the Depart− ment of Neurology at Biziel Memorial Hospital in Bydgoszcz within 24 hours after the onset of their first−ever stroke. They had no symptoms of con− sciousness disturbances at that time. They had clin− ical signs of focal brain damage in the area of the anterior brain circulation. Reasons other than vas− cular for the neurological deficit were excluded by brain CT. Some of the risk factors for ischemic stroke in these patients included hypertension (73%), hypercholesterolemia (73%), ischemic heart disease (26%), atrial fibrillation (14%), diabetes mellitus (26%), and smoking (22%).
The patients were divided into three groups according to the age (< 55, 55–75, > 75 years old) and into three groups according to the extent of stroke (Oxfordshire Classification). Seventy−two percent of the patients suffered from partial anteri− or circulation infarct (PACI), 12% total anterior circulation infarct (TACI), and 16% lacunar ante− rior circulation infarct (LACI). There were no patients in the fourth Oxfordshire Classification group, i.e. posterior circulation infarct (POCI). The PAP complexes were determined in these groups.
The control group consisted of 30 healthy per− sons (15 men, 15 women) aged 40–65 years (mean
age: 59.5 ± 7.6) who were healthy and without clinical indicators of atherosclerosis or prior histo− ry of neurological disease.
The parameters of fibrinolysis were measured at the Department of Pathophysiology Medical University in Bydgoszcz. The study was accepted by the local ethics committee.
Venous blood (4.5 ml) was withdrawn into a tube containing 0.5 ml of a 3.2% sodium citrate solution between seven and eight a.m. from the patients (this time being within 24 hours of stroke onset) and the healthy controls. The blood−sam− ples were immediately centrifuged (3000 rpm for 20 min). The plasma was portioned and frozen at –20oC. The concentration of PAP complexes in the
citric plasma was determined using an enzyme− linked immunosorbent assay (Enzygnost PAP micro, Behring, Marburg, range of method refer− ences: 99–369 µg/l), and plasminogen (PL) and α2−antiplasmin (α2−AP) by chromogenic substrates
(Behring).
The results of the measurements were statisti− cally analyzed using Microsoft Excel 2000 and Statistica for Windows 5.0 by Statsoft. Apvalue ≤0.05 was considered statistically significant. The values of the PAP complexes did not conform to the normal distribution. Their data are presented as the median (Me) and lower and upper quartiles (Q1, Q3). PL and α2−AP values conformed to the
normal distribution and their values are presented as the average (X) and the standard deviation (SD).
Results
The concentrations of PAP complexes and the levels of PL and α2−AP (components of PAP com−
plexes) in the patients and controls are shown in Table 1.
The concentration of PAP complexes in patients with an ischemic stroke within the first 24 hours after stroke onset was statistically signif− icantly higher than in the control group. The level of PL was higher and the level of α2−AP was lower
in patients than in the control group. The concen− trations of PAP complexes in the acute stroke patients according to age and the extent of stroke are illustrated in Figures 1 and 2.
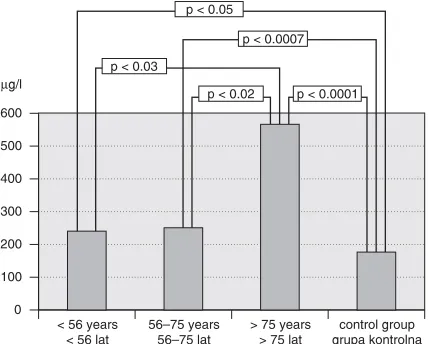
The concentration of PAP complexes increased with patient age. It was significantly higher in patients over 75 years of age compared with younger patients.
Table 2 shows the concentration of PAP com− plexes in patients with and without the risk factors hypertension, hypercholesterolemia, atrial fibrilla− tion, diabetes mellitus, smoking, and ischemic heart disease.
There were no significant differences in the concentrations of PAP complexes in patients with and without the investigated stroke risk factors.
Plasmin–α2−antiplasmin complexes are
a direct indicator of plasmin generation in vivo. These results showing that the concentration of PAP complexes was significantly increased in the first 24 hours of an ischemic stroke compared with the control group are similar to those of Kataoka et al. [7] and Ono et al. [8], whereas Tongi et al. observed that the concentration of PAP complexes was not increased during the first week of a stroke (it was only slightly elevated) compared with con− trols. Yamazaki et al. [5]measured the concentra− tion of PAP complexes during the first seven days after stroke onset and according to the etiopatho− logical type of stroke. They found significantly increased concentrations of this parameter only in embolic strokes.
In the present study the concentration of PAP complexes increased with patient age. The differ− ences were statistically significant between the groups under 56 years old and above 75 years old and also between the group 56–75 years old and the group over 75 years old. Furthermore, there was no difference in its concentration in the group of patients under 56 years old compared with the control group. These results are similar to those of Ono et al. [8], who measured the concentrations of PAP complexes in patients divided into three groups (≤64 years old, 65–74 years old, ≥75 years old). They found significantly higher concentra− tions of PAP complexes in the group 65–74 year old and the group over 75 years old compared with the control group. Bom et al. [1] also found an increase in this parameter with patient age, while Meijer et al. [9]found no such dependency in their patients.
Tabela 1.Badane wskaźniki plazminogenezy u chorych na udar mózgu i w grupie kontrolnej
Parameter Ischemic Control Statistical (Wskaźnik) stroke group significance
(Udar (Grupa (Istotność mózgu) kontrolna) statystyczna) (n = 73) (n = 30) p
Me (Q1, Q3) Me (Q1, Q3) X±SD X±SD
PAP (µg/l) 381 180 0.05
(226, 618) (150, 240)
PL (%) 117 ±25 87 ±24 0.0001
α2−AP (%) 80 ±13 95 ±11 0.0001
PAP – plasmin–α2−antiplasmin.
PL – plasminogen.
α2−AP – α2−antiplasmin.
Me – median. Q1, Q3 – quartiles.
p – level of significance of the differences between the examined groups.
PAP – plazmina–α2−antyplazmina.
PL – plazminogen.
α2−AP – α2−antyplazmina.
Me – mediana. Q1, Q3 – kwartyle.
p – poziom istotności różnic między badanymi grupami.
Fig. 1.Concentration of PAP complexes in three age groups of patients and control group
Ryc. 1.Stężenie kompleksów PAP u chorych w trzech grupach wiekowych i w grupie kontrolnej
0 100 200 300 400 500 600
< 56 years < 56 lat
56–75 years 56–75 lat
> 75 years > 75 lat
control group grupa kontrolna
µg/l
p < 0.02 p < 0.0001 p < 0.03
p < 0.05
p < 0.0007
Fig. 2.Concentration of PAP complexes in patients ac− cording to extent of stroke and in control group
Ryc. 2.Stężenia kompleksów PAP u chorych zależnie od rozległości niedokrwienia mózgu i w grupie kontrolnej
0 100 200 300 400 500 600 700 800
TACI PACI LACI control group grupa kontrolna
µg/l
p < 0.003 p < 0.03 p < 0.05 p < 0.0001
In the present study the concentrations of PAP complexes among the groups according to the extent of stroke were compared. It was significant− ly higher in the TACI group compared with the LACI and PACI groups (patients with a less exten− sive stroke). It was significantly higher in all groups compared with the controls. In the litera− ture, no studies about the Oxfordshire Classification groups and the concentrations of PAP complexes were found. Toghi et al. [3]com− pared the concentration of PAP complexes in acute stroke with the size of the ischemic focus in brain CT. CT was done one or two weeks after a stroke. The concentration of this parameter was higher when the ischemic focus was larger than 10 mm. This was not studied here because the patients of the present study had CTs in the first hours of stroke and the ischemic focus was invisible. Toghi et al. [4]observed a coexistence of a higher con− centration of PAP complexes and C−reactive pro− tein in patients with ischemic stroke. This proba− bly depends on the coexistence of cerebritis. This was not investigated in the present study.
The concentration of PAP complexes in patients with some risk factors for stroke (hyper−
tension, hypercholesterolemia, ischemic heart dis− ease, atrial fibrillation, diabetes mellitus, and smoking) compared with patients without these risk factors was not significantly different. Atrial fibrillation increases the risk of an ischemic stroke five to seven times. Some studies have tried to dis− cover whether PAP complexes could be a good risk marker for an ischemic stroke in patients with atrial fibrillation. Feinberg et al. [10] found that elderly patients, especially women, and patients with left ventricular heart failure and in the begin− ning of atrial fibrillation were especially exposed to stroke. A high concentration of PAP complexes presented additional risk in these patients. However, Roldan et al. [11] found no significant differences between patients with atrial fibrillation and a control group without it.
The concentration of PAP complexes was increased in patients with diabetes mellitus [6, 12]. Some authors indicated that the concentration of PAP complexes was elevated in an acute stroke and it remained in a chronic stroke as well. The activation of fibrinolysis appears later than the activation of coagulation and is a secondary occur− rence [3, 4, 7, 8, 13–15].
Table 2.Concentration of PAP complexes in patients with and without the examined risk factors for ischemic stroke Tabela 2.Stężenie kompleksów PAP u chorych w zależności od obecności lub braku danego czynnika ryzyka udaru niedokrwiennego mózgu
Risk factors (Czynniki ryzyka) n Median (Q1, Q3) p
(Mediana – kwartyle) Hypertension (Nadciśnienie tętnicze) 46 379.3 (226.2, 597.9)
Without hypertension (Bez nadciśnienia tętniczego) 17 453.6 (241.4, 728.9) ns Ischemic heart disease (Choroba niedokrwienna serca) 17 422.6 (181.8, 772.6)
Without ischemic heart disease (Bez choroby niedokrwiennej serca) 46 379.3 (234.2, 586.53) ns Atrial fibrilation (Migotanie przedsionków) 8 487.82 (223.85, 795.75)
Without atrial fibrilation (Bez migotania przedsionków) 55 376.9 (226.2, 597.9) ns Cholesterol level (Poziom cholesterolu) > 200 mg/dl 45 369.7 (234.2, 514.26)
Cholesterol level (Poziom cholesterolu) < 200 mg/dl 13 422.6 (147.1, 728.9) ns
Diabetes mellitus (Cukrzyca) 17 422.6 (266.5, 565.3)
Without diabetes mellitus (Bez cukrzycy) 46 379.3 (226.2, 618.15) ns
Smokers (Palący) 15 282.6 (226.2, 651.9)
Non−smokers (Niepalący) 48 405.85 (215.33, 608.03) ns
References
[1] Bom JG, Bots ML, Haverkate F, Meijer P, Hofman A et al.:Activation products of the haemostatic system in coronary, cerebrovascular and peripheal arterial disease. Thromb Haemost 2001, 85, 234–239.
[2] Takada A, Takada Y, Urano T:The physiological aspects of fibrinolysis. Thromb Res 1994, 74, 1–31. [3] Toghi H, Kawashima M, Tamura K, Suzuki H:Coagulation−fibrinolysis abnormalities in acute and chronic
phases of cerebral thrombosis and embolism. Stroke 1990, 21, 1663–1667.
[6] Zawilska K: Advances in the diagnostics of intravascular activation of fibrinolysis [Postępy w diagnostyce wewnątrznaczyniowej aktywacji fibrynolizy]. Act Haemat Pol 1995, 26, 1, 33–37.
[7] Kataoka S, Hirose G, Hori A, Shirakawa T, Saigan T:Activation of thrombosis and fibrinolysis following brain infarction. J Neurol Sci 2000, 181, 82–88.
[8] Ono N, Koyama T, Suehiro A, Oku K, Fujikake K, Kakishita E:Clinical significance of new coagulation and fibrynolytic markers in ischemic stroke patients. Stroke 1991, 22, 1369–1373.
[9] Meijer O, Kamerling SWA, van de Ham FJ, Kret R et al.:Baseline levels of α2−antiplasmin plasmin complex
in human plasma. Fibrinolysis 1994, 88, Suppl 2, 125.
[10] Feinberg WM, Macy E, Cornell ES, Nithingale SD, Pearce LA et al.:Plasmin–α2−antiplasmin complex in
patients with atrial fibrillation. Thromb Haemost 1999, 82, 100–103.
[11] Roldan V, Marin F, Marco P, Martinez J, Calatayud R et al.:Hypofibrinolysis in atrial fibrillation. 1998, 136, 956–960.
[12] Gosk−Bierska J, Adamiec R, Wysokiński W: Plasma plasmin–α2−antiplasmin in diabetic and non−diabetic
patients with peripheral arterial occlusive disease. Thromb Haemost 2003, suppl July, PO 961.
[13] Dzianott−Pabijan D, Masłowska B, Kotschy M: Concentration of thrombin−antithrombin III complexes and plasmin–α2−antiplasmin complexes in ischemic stroke. Neurol Sci 2001, suppl. 187, P0038.
[14] Dzianott−Pabijan D:Selected parameters of plasminogenesis in the blood of ischemic stroke patients [Wybrane parametry procesu plazminogenezy we krwi chorych na udar niedokrwienny mózgu]. Rozprawa doktorska AM w Bydgoszczy 2002
[15] Gosk−Bierska J, Adamiec R:Plasmin–α2−antiplasmin complexes in cardiovascular diseases [Kompleksy α2−
antyplazmina–plazmina w chorobach sercowo−naczyniowych]. Adv Clin Exp Med 2005, 14, 6, 1283–1287.
Address for correspondence:
Maria Kotschy ul. O. Bujwida 28/20 50−368 Wrocław Poland
Conflict of interest: None declared
Received: 20.05.2005 Revised: 7.09.2006 Accepted: 21.09.2006
Praca wpłynęła do Redakcji: 20.05.2005 r. Po recenzji: 7.09.2006 r.