www.ijper.org
Global Metadata Analysis of Research Publications
in Pharmaceutical Sciences
*Vinod K. R.1, Sandhya S1 and Saritha A1
1Nalanda College of Pharmacy, Nalgonda, Andhra Pradesh, India
ABSTRACT
The aim of the present work was orienting to generate information about global research publications in Pharmaceutical sciences. Method adopted for this dry lab project was assimilation of metadata analysis, processing and interpretation. Results showed that hierarchy of countries sourcing journals (total journals-percentage global share) were in the descending order of USA>UK>Germany>Canada and France>Netherlands> China>Spain>Finland>Denmark, Egypt, Georgia, India, Israel, Japan, Sweden, Switzerland. When quality was considered (total IF of journals from a country), the order was in the descending order of USA>UK>Germany> France Sweden>Netherlands>Canada>Italy>Spain>Switzerland>Israel>Denmark>Georgia>China>India> Finland. Total number of authors and global authors share of top 10 countries are in the desc-ending order of: USA>China>Japan>France>UK>India>Germany>Canada>Italy>Netherlands. Although journal quality was less from some countries, authors from these countries were accommodated in good impact factor journals which are sourced from other countries. More over some countries although outsourcing more journals were found to have lesser quality if impact factor was considered as a parameter for determining the quality of journals.
Keywords: database, Science Citation Index, impact factor, metadata.
DOI: 10.5530/ijper.47.4.3
Address for correspondence Vinod K.R
HOD, Department of Pharmaceutics, Nalanda College of Pharmacy, Nalgonda- 508001, Andhra Pradesh, India.
Tel: 08682-247910, Fax:0 8682-248547,
Mob: 09010055001, Email:
[email protected] within academic, corporate, government
or non-profit environments. The advan-tage of these services is that it allows a researcher to identify which articles have been cited most frequently and who cited them. It consists of a list of highly cited researchers included in academic ranking of world universities published by Shang-hai Jiao Tong University and Annual Jour-nal Citation Reports, listing the jourJour-nals and their impact factor.
There are no comprehensive reports which compare institutional research potentiali-ties of various countries in a global level, although there are some regional based or single country based research. The pres-ent work aims in bringing out the various countries research potential and categoriz-ing into speculated geographical regional research outputs. By studying so, it could be more vivid for the apex bodies to consider
INTRODUCTION
Scientific productivity of an author, institution and country depends on the total output as well as the credibility of the publica-tions. But the credibility of a manuscript and journal is measured by several factors. There are very few reports on the scien-tific publication statistics which are based on a country or region, quality assessment of scientific methods, citation index etc. Li et al. has conducted as survey of Chi-nese authors in North Asia region.1 Unni-krishnan et al. has surveyed on research publications in Pharmacy schools in India based on Scopus data base.2 Dinararan SK
et al. reviewed on assessment of quality of journals.3 Shailendra Kumar et al. demon-strated structure and functions of citation index.4
Pharmaceutical Education Pharmaceutical Education which way to focus institutional research, so that the
countries research potentialities can be augmented. The endeavour of the present work was to aid in deter-mining the quality of research works and resource persons from various countries based on outsourcing publications in the field of pharmaceutical sciences. Thus, the work was oriented towards conducting survey on journal publications in the area of pharmaceutical sciences, determine the share of journals from a try, find out the credibility of journals, determine coun-try of origin where the authors are working, find out the credibility of a countries publication and find out what could be the most contributory factor in enchasing institutional research works.
Science direct college edition
The Science direct college edition provides smaller academic institutions with affordable access to dedi-cated subject packages in the physical, social and health sciences that are complemented by content from online books and pre 1995 journals. The Science Direct college edition enables to support the teaching and learning process with unparalleled breadth and depth of content, improve information quality with access to relevant peer-reviewed content, increase user support with a new and improved interface and our dedicated e-helpdesk, manage budget more effec-tively with transparent, flexible and predictable pric-ing, make evidence based decisions with industry leading and counter compliant usage reports that give you insights into user behaviour, give users a broader perspective with valuable journal content going back to 1995, online book access and pre-1995 content, maximize the investment with training and market-ing programs to ensure the users get the most out of Science Direct.5,6
At present, it has become a prerequisite for a researcher or a professional to get research work published in Sci-ence Citation Index (SCI) journals with impact factor (IF), if his/ her interest is seeking placement in reputed academia or research organizations. Government uni-versities and other world uniuni-versities give credits to research publications in SCI journals from a research scholar while considering him for selection for the award of research fellowship.7–14
MATERIALS AND METHODS: STUDY DESIGN AND DATA RESOURCES
Metadata collection and analysis were divided into ‘jour-nal oriented’ and ‘author oriented’. The database used to know the journals pertaining to Pharmaceutical Sciences and its allies Pharmacology, Toxicology were science direct database-college edition. Only journals were
considered and books/proceeding/patents etc. were not considered.15–21 A separate search was conducted on the individual journal websites homepage, SCImago journal and country rank to know its impact factor (IF) and the origin (country) of publication (outsourcing).9 Authors are aware that the origin of the publication may not be pinpointed to 100% accuracy, but the authors feel it was a reasonable effort within the limits. Readers do reserve their choice to accept or reject our efforts.
To know the author details, each journals latest pub-lication were verified. Author details include country of affiliation and the journal in which the article were published. Data collected was segregated into separate spread sheets of journal based on alphabetic order, impact factor and origin of country. Ratio of total impact factor of authors to global author share (%) was calculated. An attempt was made to determine the con-tribution of selected Indian journals. Global share of authors and journals from each country was determined by equation no.1 and 2 respectively. Since the data col-lected is from the last issue of each journal available in ‘Sci verse database-college edition’ the entire author population, time line, time interval and author migration need not be considered.
Global share (%) of the author contribution of a
coun-try (C1) = [At/ΣAt] × 100 (1)
Where At = total no. of authors from C1 and ΣAt = Cumulative total of all authors globally.
Global share (%) of the Journal contribution of a coun-try (C1) = [ Jt/ΣJt] × 100 (2) Where Jt = total no. of Journals from C1 and ΣJt = Cumulative total of all Journals globally.
Geographical based segregation of countries is as below:
1. Asia pacific region: China, Hong Kong, India, Japan, Korea, Mauritius, Pakistan, Philippines, Republic of Korea, Singapore, Srilanka.
2. Australia and New Zealand
3. Central South America: Argentina, Alge-ria, Venunzvala, Chile, Croatia, Brazil, Croatia, Colombo, Spain, Puertorico.
4. Eastern Europe (Including Russia and CIS):
Lithuania, Croatia, Czechoslovakia, Russia. 5. Middle east and Africa: Bulgaria, Egypt,
Tuni-sia, Iran, Jordan, Korea, Lebanon, Morocco, Nigeria, S. Africa, Saudi Arabia, Syria, Turkey, 6. Western Europe including Israel: Austria,
Readers are requested to note that the findings of this metadata are based on only one metadata source and need not reflect either a cumulative research productiv-ity of any country nor authors. Thus the findings may be utilised only as one among other parameters, if cred-ibility of institutions belonging to a specific country or province is compared.
RESULTS
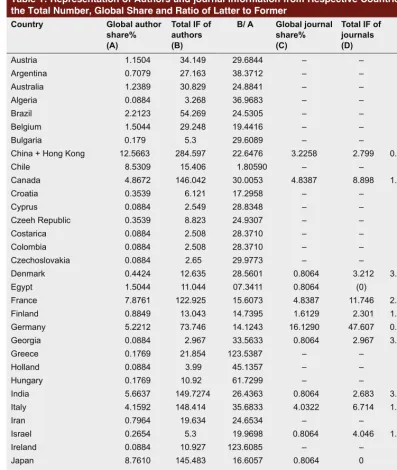
Representation of authors and journal information from respective countries and logistics of journals and authors are mentioned in table no 1 and 2 respec-tively.
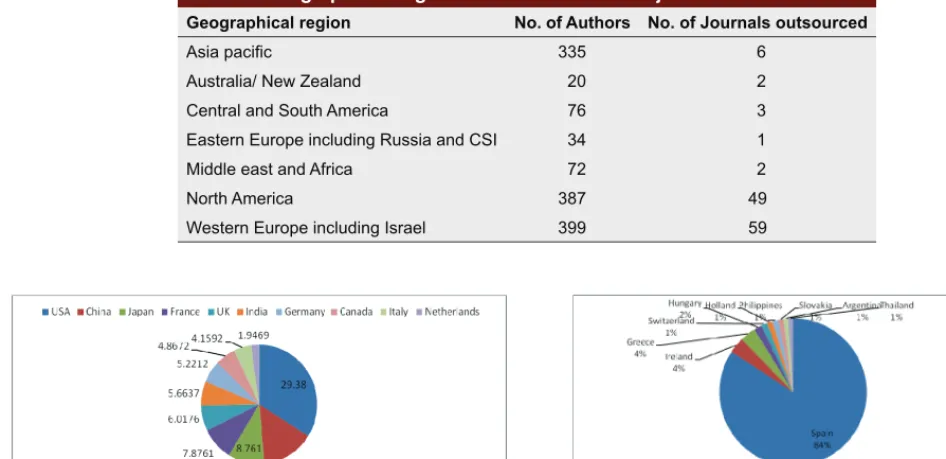
When metadata of total authors from each country was considered USA stands first with 332 corre-sponding authors. Total number of authors and global authors share of top 10 countries are in the descending order of: USA (332–29.380)>China (142– 12.5663)>Japan (99–8.7610)>France (89–7.8761)>UK (68–6.0176)>India (64-5.6637)>Germany (59–5.2212)> Canada (55–4.8672)>Italy (47–4.1592)>Netherlands (22–1.9469). Global authors share of top 10 countries and the B/A value are displayed as a pie chart in figure 1 and 2 respectively.
Metadata of journals revealed that 18 countries are out-sourcing journals in the field of pharmaceutical sciences
Table 1: Representation of Authors and journal information from Respective Countries for the Total Number, Global Share and Ratio of Latter to Former
Country Global author share% (A)
Total IF of authors (B)
B/ A Global journal share% (C)
Total IF of journals (D)
D/C
Austria 1.1504 34.149 29.6844 – – –
Argentina 0.7079 27.163 38.3712 – – –
Australia 1.2389 30.829 24.8841 – – –
Algeria 0.0884 3.268 36.9683 – – –
Brazil 2.2123 54.269 24.5305 – – –
Belgium 1.5044 29.248 19.4416 – – –
Bulgaria 0.179 5.3 29.6089 – –
China + Hong Kong 12.5663 284.597 22.6476 3.2258 2.799 0.8677
Chile 8.5309 15.406 1.80590 – – –
Canada 4.8672 146.042 30.0053 4.8387 8.898 1.8389
Croatia 0.3539 6.121 17.2958 – – –
Cyprus 0.0884 2.549 28.8348 – – –
Czeeh Republic 0.3539 8.823 24.9307 – – –
Costarica 0.0884 2.508 28.3710 – – –
Colombia 0.0884 2.508 28.3710 – – –
Czechoslovakia 0.0884 2.65 29.9773 – – –
Denmark 0.4424 12.635 28.5601 0.8064 3.212 3.98313
Egypt 1.5044 11.044 07.3411 0.8064 (0) 0
France 7.8761 122.925 15.6073 4.8387 11.746 2.4275
Finland 0.8849 13.043 14.7395 1.6129 2.301 1.4266
Germany 5.2212 73.746 14.1243 16.1290 47.607 0.062
Georgia 0.0884 2.967 33.5633 0.8064 2.967 3.679
Greece 0.1769 21.854 123.5387 – – –
Holland 0.0884 3.99 45.1357 – – –
Hungary 0.1769 10.92 61.7299 – – –
India 5.6637 149.7274 26.4363 0.8064 2.683 3.3271
Italy 4.1592 148.414 35.6833 4.0322 6.714 1.6650
Iran 0.7964 19.634 24.6534 – – –
Israel 0.2654 5.3 19.9698 0.8064 4.046 1.2400
Ireland 0.0884 10.927 123.6085 – – –
Japan 8.7610 145.483 16.6057 0.8064 0 0
Jordan 0.0884 0 0 – – –
Korea 1.0619 33.32 31.3777 – – –
Kenya 0.0884 2.549 28.8348 – – –
Table 1: Continued
Country Global author share% (A)
Total IF of authors (B)
B/ A Global journal share% (C)
Total IF of journals (D)
D/C
Lebanon 0.4424 4.539 10.2599 – – –
Lithuania 0.0884 3.035 34.3325 – – –
Mexico 0.6194 10.492 16.9389 – – –
Malaysia 0.0884 2.301 26.0294 – – –
Mauritius 0.0884 0 0 – – –
Morocco 0.0884 0 0 – – –
Nether lands 1.9469 49.487 25.4184 4.0322 9.489 2.3533
Nigeria 0.2654 5.627 21.2020 – – –
New Zealand 8.5309 28.607 0.0041 – – –
Norway 8.5309 16.734 1.9615 – – –
Pakistan 0.2654 8.801 33.1613 – – –
Poland 1.5044 39.773 26.4378 – – –
Portugal 0.4424 10.816 24.4484 – – –
Philippines 0.1769 7.834 44.2849 – – –
Puertorico 0.1769 1.324 7.4844 – – –
Republic of korea 1.5929 38.199 23.9807 – – –
Russia 0.7079 19.467 27.4996 – – –
Republic of Macedonia 0.0884 2.850 32.2398 – – –
Spain 0.0185 55.436 2996.5405 2.4193 4.436 1.8335
Slovak republic 0.2654 10.809 40.7272 – – –
Sweden 0.9734 26.545 27.2770 0.8064 9.559 11.8539
South Africa 0.4424 10.722 24.2359 – –
-Switzer land 0.7964 37.241 46.7616 0.8064 4.269 5.2938
Singapore 0.0884 2.969 33.5859 – – –
Serbia 0.0884 2.549 28.8348 – – –
Slovenia 0.2654 0 0 – – –
Srilanka 0.0884 0 0 – – –
Saudi Arabia 8.5309 1.597 0.1872 – – –
Syria 0.0884 0 0 – – –
Slovakia 0.2654 4.275 16.1078 – – –
Turkey 1.7699 30.842 17.4258 – – –
Taiwan 0.7079 16.503 23.3126 – – –
Thailand 0.0884 3.268 36.9683 – – –
India 5.6637 149.7274 26.4363 0.8064 2.683 3.3271
Italy 4.1592 148.414 35.6833 4.0322 6.714 1.6650
Iran 0.7964 19.634 24.6534 – – –
Israel 0.2654 5.3 19.9698 0.8064 4.046 1.2400
Ireland 0.0884 10.927 123.6085 – – –
Japan 8.7610 145.483 16.6057 0.8064 0 0
Jordan 0.0884 0 0 – – –
Korea 1.0619 33.32 31.3777 – – –
Kenya 0.0884 2.549 28.8348 – – –
Lebanon 0.4424 4.539 10.2599 – – –
Lithuania 0.0884 3.035 34.3325 – – –
Mexico 0.6194 10.492 16.9389 – – –
Malaysia 0.0884 2.301 26.0294 – – –
Mauritius 0.0884 0 0 – – –
Morocco 0.0884 0 0 – – –
Nether lands 1.9469 49.487 25.4184 4.0322 9.489 2.3533
out of which USA stands first outsourcing 43 journals. Hierarchy of countries sourcing journals (total journals-percentage global share) were in the descending order of USA (43–34.6774 )>UK (22–17.7419)>Germany (20–16.1290)>Canada and France (6–4.838)>Nether-lands (5–4.0322)>China (4–3.2258)>Spain (3–2.4193)> Finland (2–1.6129)>Denmark, Egypt, Georgia, India, Israel, Japan, Sweden, Switzerland (1–0.8064). When quality was considered ( total IF of jour-nals from a country) the order was in the descend-ing order of USA (151.385)>UK (50.438)>Germany (47.607) >France (11.746)>Sweden (9.559)>Neth-erlands (9.436)>Canada (8.898)>Italy (6.714)>Spain (4.436) >Switzerland (4.269)>Israel (4.046)>Den-mark (3.212)>Georgia (2.967)>China (2.799)>India (2.683)>Finland (2.301). Data is illustrated in figure 3. Ironically, when the ratio of total IF of all journals from a country (D) to its global share (C)was considered (D/C), the order was found to be in the order Sweden (11.8539)>Switzerland (5.2938)>USA (4.3655)>Den-mark (3.98313)>Georgia (3.679)>India (3.3271)>UK (2.8428)>France (2.4277)>Netherlands (2.3533)>Can-ada (1.8389)>Spain (1.8335)>Italy (1.6650)>Israel (1.240)>China (0.8677)>Germany (0.062). Based on various geographical regions author and journal contri-butions are mentioned in figure 4 and 5 respectively.
DISCUSSION
Usage of research work of researcher always pays importance and value to the author and also to the work. Work in the form of article, patents and notes in the
subject get its impact when it got cited in the literature of importance. Guidance to the future generations is by creation of the platform to share the experiences by publishing the articles in important and effec-tive journals. If the quality of any journal is consid-ered, the most important parameters to watch for are Impact Factor and Citation Index which may serve as efficient parameters for scientific evaluation. IF, given by Thomson Reuters necessarily need not reflect the quality of a journal since it gives an average number of citations of a journal which in turn depends on the viewers discipline, area of interest, application etc. But as long as a better device/s are recognized to value a journal, we perhaps may be struck up with IF.
The data collected were only from journals and books/ proceeding/patents etc. were not considered. In the data base, one hundred thirty four journals were provided in the field of Pharmacology, Toxicology and Pharmaceu-tical sciences and these were considered to determine the assessment of data. The data collected were impact factor of journal, country of origin, country of author affiliation. Further the global share and average impact factor were separately taken into account for the respec-tive country.
It was found that some of the journals were discon-tinued or changed the journal title. Some others were incorporated under a parent journal. Out of all jour-nals which are available in the science direct college edi-tion, ‘Trends in Pharmacological Sciences’ was found to have the maximum impact factor, (10.927). Other top rated journals were: Current Opinion in Chemical
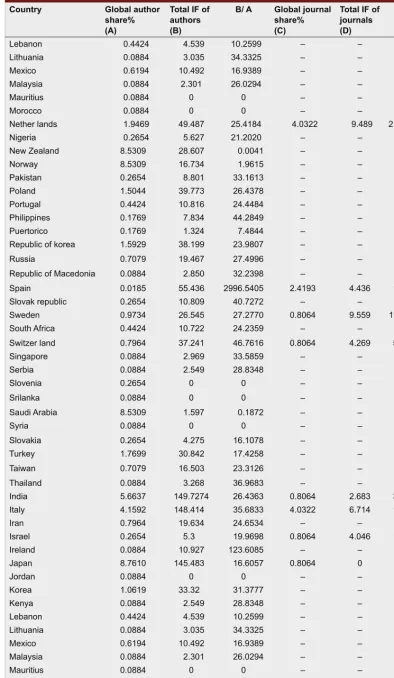
Table 2: Geographical Region Based information of journals and Authors Geographical region No. of Authors No. of Journals outsourced
Asia pacific 335 6
Australia/ New Zealand 20 2
Central and South America 76 3
Eastern Europe including Russia and CSI 34 1
Middle east and Africa 72 2
North America 387 49
Western Europe including Israel 399 59
Figure 1: Global authors share of top 10 countries.
10
10
Biology (9.850)>Drug Resistance Updates (9.559)> Current Opinion in Pharmacology (6.856)>Drug Dis-covery Today: Biosilico (6.828). But we have noticed that there are other journals having higher impact fac-tor which were excluded from this database (Sci verse database-college edition). For example a separate inves-tigation revealed that ‘Nature review drug discovery’ (29.05), ‘Annual reviews in pharmacology’ (21.64), ‘Pharmacological review’ (13.069) having more impact factor but not available in the data source.22–24 Further most of the journals which are popular in the Indian subcontinent are also not available.
There were some confusions while segregating terri-tories and solved on the basis of the world map and central administration. For example, the Common-wealth of Puerto Rico (Spanish: Estado Libre Asociado de Puerto Rico), is an unincorporated territory of the United States, located in the north-eastern Caribbean, east of the Dominican republic and west of both the Islands and the British Virgin Islands. Thus this was honoured as a separate province which is independent.25
Hong Kong is a special administrative region of the People’s Republic of China. It is situated on China’s south coast and, enclosed by the Pearl River Delta and South China Sea. Thus this was incorporated into main-land China ie, People’s Republic of China.26
In India, Current science enjoys the maximum impact factor (0.897). It has to be noted that many journals which is mentioned is not purely oriented in pharmaceutical
sciences but related to health sciences. Some specific pharmacy journals like Indian J Pharm Sci, Indian Jour-nal of Pharm Edu Res have not been included in the website, and if did so will be out of the study design. Thus, it has to be noted that a separate search is rec-ommended on other metadata were other journals are included and may be wisely interpreted that as the jour-nal becomes multidisciplinary, the authors as well as reader will increase in number which is a major con-tribution to improve the citations of a journal, which necessarily need not reflect the quality. This is perhaps because there could be more manuscripts and resource person for selection and consideration respectively. Thomson Reuters noted that research publications from India rose by 80% during the years 2000–2007.16 If this growth is maintained, India is expected to be on par with G8 nations within 7–8 years and overtake them between 2015–20. But if the quality of the journals out-sourced from this subcontinent is not maintained, we believe that the overall credibility of the pharmaceutical journals will be affected.
If total number of authors is more, naturally the total impact factor for this particular country also will be more. But this doesn’t give the exact picture that all authors publish in high impact journals. To under-stand this better ratio of total impact factor of authors from a country (B) to its global author share (A) was determined (B/A). Surprisingly Spain stands first with B/A as 29996.5405 with only 21 authors and global author share and IF of this country as 0.0185 and 55.436 respectively. This is against USA whose B/A is 20.9347. Hierarchy of top 10 countries with B/A value was in the order of Spain (2996.4505)>Ireland (123.6085) Greece (123.5387)>Hungary (61.7299) Switzerland (46.7616)>Holland (45.1357)>Philippines (44.2849)>Slovakia (40.7272)>Argentina (38.3712) Thailand (36.9683). This suggests that authors from Spain are opting high quality journals.
11
Figure 3: Hierarchy of countries sourcing journals expressed in percentage global share (DEGInIsSwSi = Denmark, Egypt, Geor-gia, India, Israel, Japan, Sweden, Switzerland).
11
Figure 4: Author contribution (values represent no.) of various geographical regions.
11
It was fascinating to understand that authors from Western European countries substantially contributed (considering the publications) towards the research in the field of Pharmaceutical sciences. The hierarchy follows Western European>North American>Asia Pacific>Central and South America>Middle East and Africa>Eastern Europe and Russia>Australia and New Zealand.
Western European countries contributed maxi-mum Journal publications. Continental contribu-tion of journals were in the order Western European countries>North American>Asia Pacific>Central and South America>Middle East and Africa>Eastern Europe and Russia.
It has to be noted that both the author contribution and journal contribution are equivalent and we believe that total number of countries who are economically forward need not be a deciding factor to the research output. This is prominent if we take the country wise GDP. First six countries are in the following order of GDP: USA>China>Japan>India>Germany>UK. Although China, Japan, India belong to one regional group (Asia Pacific), research contribution is only third. Perhaps it is wise to interpret that the quality of Uni-versities and Institutions play a major role in the num-ber of institutional research activities. If so, it is highly recommended that the existing Universities and institu-tions must be upgraded in terms of advanced equip-ments, laboratory facilities and of course recruitment of quality resource persons. Proper utilisation of the funded investment also may be appropriately checked not only in terms of documents put also assessing the quality of the research works envisaged.
CONCLUSION
Results showed that Hierarchy of countries sourcing journals (total journals-percentage global share) were in the descending order of USA>UK>Germany>Canada and France>Netherlands>China>Spain>Finland> Denmark, Egypt, Georgia, India, Israel, Japan, Swe-den, Switzerland . When quality was considered (total IF of journals from a country) the order was in the descending order of USA>UK>Germany>France> Sweden>Netherlands>Canada>Italy>Spain >Swit zerland>Israel>Denmark>Georgia>China>India> Finland. Total number of authors and global authors share of top 10 countries are in the descending order of: USA>China>Japan>France>UK>India>Germany >Canada>Italy>Netherlands. Although journal quality is less from some countries, authors from these coun-tries are getting published in good impact factor journals which are sourced from other countries. For Indian
jour-nals it will be highly appreciable that they come under reputed databases so that the citations and viewers will increase so do the credibility of the journal as well as the authors concerned. USA is outsourcing maximum number of journals as well as authors, in the field of Pharmacology, Toxicology and Pharmaceutical sciences. Although journal quality is less from some countries, authors from these countries are getting published in good impact factor journals which are sourced from other countries. At the same time it has to be said that impact factor of a journal necessarily need not reflect the quality of the articles or even the journal itself. In Toto, it has to be concluded that to generate more institutional research works, proper investment and utilization in the research facilities at institutional level is inevitable. Per-haps the best way to improve any institution is to identify the deficiencies including resource persons and support the institution by government/other agencies funding partially or fully and monitor specifically the funding is channelized in the proper direction and quality has been improved.
ACKNOWLEDGEMENT
Authors sincerely wish their heartfelt thanks to Ms. Manisha Singh, University of Delhi and Mr. Rajeshekar Reddy, Scholar, Butler University for their valuable information without which it would be rather not pos-sible to retrieve many vital data which was the spearhead for this manuscript.
REFERENCES
1. Li G, Hu L, Liao Z, Cu HC, Li ZS. Scientific publications in Pharmacology and
Pharmacy journals from Chinese authors in various parts of North Asia: A 10 year survey of literature. J Int Med Res 2010; 38 (3):750–759.
2. Yogendra Nayak, Vijay Mor, Unnikrishnan MK. Research in Pharmacy Schools of India: A Study Based on Scopus Database. Indian J Pharm Edu Res 2011; 45:1–7.
3. Avasarala H, Dhinakaran SK, Vinod KR, Sandhya S, David Banji.
Assessment of quality of journals and articles for research communications. Indian Drugs 2012; 49(6):5–11.
4. Shailendra Kumar, Manesha Singh. Structure and Functions of Citation Index
[on line]. 2011 [cited 2011 Dec 11]. Available from: URL: http://ir.inflibnet.
ac.in/dxml/bitstream/handle/1944/1653/61.pdf sequence=1.
5. On line 2011 [cited 2011 Dec 21]. Retrieved from URL: http://www.hub.
sciverse.com/action/home/proceed; jsessionid=9DD8E86E3BA7EF736C38 0ADD23C1B6BF.cLGCJJTVBZosiz3fVEuIsA
6. On line 2011 [cited 2011 Dec 3]. Retrieved from URL: http://www.
sciencedirect.com/science/browse/j
7. Gross PLK, Gross EM. College libraries and chemical education. Science
1927; 66:385–389.
8. Brodman E. Methods of choosing Physiology journals. Bull Med Libr Assn.
1944; 32:479–83.
9. SCI, Journal Citation Reports: a bibliometric analysis of science journals in
the ISI database. Philadelphia: Institute for Scientific Information, Inc.;1993. 10. Garfield E: The history and meaning of the journal impact factor, JAMA 2006;
295:90–93.
11. Master Journal List. Thomson Scientific. [Online]. 2010 [cited 2010 Dec 15].
12. Web of Knowledge. [On line]. 2010 [cited 2010 May 05]. Available from: URL: http://wokinfo.com/realfacts/qualityandquantity/.
13. Tam Cam HA, Say Beng Tan, KheeCheeSoo. The Journal Impact Factor: Too Much of an Impact? Ann Acad Med Singapore 2006; 35:911–916.
14. Garfield E. How ISI Selects Journals for Coverage: Quantitative and Qualitative Considerations. Current Contents 1990.
15. ISI (Institute for Scientific Information). Science Citation Index Guide and List of Source Publications. Philadelphia, USA: Institute for Scientific Information 1998.
16. Journal Citation Reports (Overview). Thomson Reuters. [Online]. 2010 [cited
2010 June 25]. Available from: URL:http://thomsonreuters.com/products_
services/science/ science_products/a-z/journal_citation_reports.
17. Joint Committee on Quantitative Assessment of Research Citation Statistics.
International Mathematical Union. [Online]. 2010 [Cited 2011 Jan 10].
Available from: URL: http://www mathunion.org/fileadmin/IMU/Report/
CitationStatistics. pdf.
18. The Thomson Scientific Impact Factor. [online]. 2011 [cited 2011 Nov
08]. Available from: URL: http://scientific.thomson.com/ free/es-says/
journalcitationreports/impactfactor/.
19. Garfield E. Citation Indexing, New York: John Wiley and Sons;
1979.
20. Garfield E. The agony and the ecstasy-the history and meaning of the journal impact factor [online]. 2010 [cited 2010 Aug 18]. Available
from: URLhttp://garfiel: d.library. upenn.edu/papers/jifchicago
2005.pdf.
21. Vishal R, Tandon, Annil Mahajan, Sudhaa Sharma, Gupta K. Impact Factor: Indian Contest. JK Science 2007; 9(3):107–108.
22. Online 2012 [cited 2012 Nov 08] retrieved from URL:http://www.nature.com/
nrd/index.html.
23. Online 2012 [cited 2012 Sep 22] retrieved from URL:http://www.
annualreviews.org/journal/pharmtox.
24. Online 2012 [cited 2012 Nov 13] retrieved from URL:http://www.bioxbio.com/
if/html/PHARMACOL-REV.html.
25. Online 2012 [cited 2012 Nov 13] retrieved from URL:http://en.wikipedia.org/
wiki/Puerto_Rico.
26. Online 2012 [cited 2012 Sep 22] retrieved from URL:http://www.