©2004. Biological Procedures Online. Published in Biological Procedures Online under license from the author(s). Copying, printing, redistribution and storage permitted.
Biol. Proced. Online 2004;6(1): 120-128.
doi:10.1251/bpo80
Dynamic force microscopy for imaging of viruses under
physiological conditions
Ferry Kienberger
1, Rong Zhu
2, Rosita Moser
3, Christian Rankl
1, Dieter Blaas
3and Peter
Hinterdorfer
1*1Institute for Biophysics, J. Kepler University, Altenbergerstr. 69, A-4040 Linz, Austria.
2Institute for Biophysics, J. Kepler University, Altenbergerstr. 69, A-4040 Linz, Austria and the Research
Department Biomedical Nanotechnology, Upper Austrian Research GmbH, Scharitzerstr. 6-8, A-4020 Linz, Austria.
3Max F. Perutz Laboratories, University Departments at the Vienna Biocenter, Department of Medical
Biochemistry, University of Vienna, Dr. Bohr Gasse 9/3, A-1030 Vienna, Austria.
*To whom correspondence should be addressed: Dr. Peter Hinterdorfer, Institute for Biophysics, J. Kepler University of Linz, Altenbergerstr, 69, A-4040 Linz, Austria. Phone: 0043 732 2468 9265; Fax: 0043 732 2468 9280; Email: [email protected]
Submitted: May 11, 2004; Revised: June 9, 2004; Accepted: June 9, 2004; Published: June 29, 2004.
Indexing terms: Microscopy, Atomic Force; Rhinovirus.
ABSTRACT
Dynamic force microscopy (DFM) allows imaging of the structure and the assessment of the function of biological specimens in their physiological environment. In DFM, the cantilever is oscillated at a given frequency and touches the sample only at the end of its downward movement. Accordingly, the problem of lateral forces displacing or even destroying bio-molecules is virtually inexistent as the contact time and friction forces are reduced. Here, we describe the use of DFM in studies of human rhinovirus serotype 2 (HRV2) weakly adhering to mica surfaces. The capsid of HRV2 was reproducibly imaged without any displacement of the virus. Release of the genomic RNA from the virions was initiated by exposure to low pH buffer and snapshots of the extrusion process were obtained. In the following, the technical details of previous DFM investigations of HRV2 are summarized.
INTRODUCTION
The atomic force microscope (AFM), first described by Binnig et al., (1) has become a powerful tool in biology. It provides three-dimensional images of the surface topology of biological specimens under physiological conditions (2). Unlike in other techniques, samples can be viewed in their native state without complicated preparation such as staining or coating. The high
Image acquisition is realized using different modes of operation. Most of the topographic images are obtained in contact-mode AFM, in which the cantilever is in touch with the sample incessantly during scanning; changes in the cantilever deflection are monitored and kept constant using an electronic feedback loop (7, 8). The image consists of the calibrated height information about the sample relief. However, contact-mode imaging turned out to be less suitable for weakly attached samples, because bio-molecules are often pushed away by the AFM stylus during imaging (9). To overcome this disadvantage, dynamic force microscopy (DFM) methods like tapping-mode (10) and, more recently, MACmode AFM (11, 12) have been used for imaging soft and weakly attached biological samples (13).
In DFM, the cantilever is oscillated at a given frequency as it raster-scans over the surface and touches the sample only at the end of its downward movement, resulting in amplitude reductions at positions of elevated objects. The reduction in oscillation amplitude is used as the feedback-control signal to measure the surface topography. In tapping-mode AFM, the excitation of the cantilever oscillation is due to an acoustic vibration of the overall liquid cell. Due to the acoustic excitation of the cantilever oscillation, the amplitude response as a function of the frequency is not clearly defined (14). In MACmode AFM, an alternating magnetic field generated in a coil beneath the sample which excites the magnetically coated cantilever sinusoidally (11). The amplitude-frequency curve follows closely the characteristics of a damped harmonic oscillator (15). Amplitude and frequency of the cantilever oscillation can therefore easily be adjusted by the current through the coil and by the driving frequency.
The advantage of DFM over contact-mode AFM is that lateral forces during imaging are greatly reduced, thereby minimizing sample damage by the scanning cantilever (16). Imaging of biological specimens has therefore greatly benefited from the development of DFM. Soft samples are significantly less deformed and probes weakly adhering to surfaces are not easily displaced by the imaging forces applied (17). Additionally to the low force applied, the oscillation amplitude is, in contrast to the deflection signal used for contact-mode AFM, insensitive to thermal drift. This results in more stable imaging with simultaneously less destruction of the biological samples.
Here we focus on the use of DFM in acquiring topographical images of human rhinoviruses under physiological conditions. Also included are detailed methods and experimental protocols that were applied for imaging human rhinoviruses; similar protocols may also be applied to other viruses or bio-molecules.
Human rhinoviruses (HRVs), which cause about 50% of all common cold infections, are icosahedral particles, ~30 nm in diameter, with a single stranded, positive sense RNA genome enclosed within a protein capsid. The virion is composed of 60 copies each of four viral coat proteins arranged on an icosahedral lattice (18). The 101 HRV serotypes are classified into a major and a minor group. Major group viruses bind to intercellular
adhesion molecule 1 (ICAM-1) (19), whereas the minor group viruses bind to the low-density lipoprotein receptor family (LDLR) (20). After binding to the cell surface and internalization via receptor-mediated endocytosis, the RNA is released from the virion in endosomes and is delivered to the cytosol by a poorly understood mechanism. For the minor group of HRVs (HRV2 used in this report belongs to the minor group), this process is catalyzed by the low endosomal pH (21). Cryo-electron microscopy images of empty capsids showed that, upon uncoating, the star-shaped dome at the five-fold axis undergoes an iris-like movement thereby opening a pore large enough to allow transit of the RNA (22). However, for human rhinoviruses, the RNA in the process of exit has never been observed at high resolution, although RNA "puffballs" or "cores" partially released and still attached to the virion after heating of a related virus have been visualized by conventional transmission electron microscopy (23).
In a previous study we used DFM to investigate the binding and the arrangement of the minor-group virus HRV2 on artificial cell membranes, mimicking an early step of virus entry into living cells (24). In our recent study, DFM was used to image RNA directly in the process of extrusion from HRV2 (25). The RNA release was initiated by exposure to a low pH-buffer and RNA either completely released or still connected to the virus was observed under physiological conditions. This report details the AFM techniques used in the latter study (25); methods, techniques and protocols are presented in depth, to allow figuring out the nuts and bolts of using DFM for various biological applications.
MATERIALS AND METHODS
Materials
Mica was obtained from Groepl, Tulln, Austria. A perfect basal cleavage provides atomic flat surfaces over several hundreds of square micrometers. In muscovite mica, tetrahedral sheets of (Si,Al)2O5 are ionically linked by a central layer of Al2(OH)2. The net negative charge of the basal oxygen between these double layers is balanced by a layer of hexagonally coordinated cations (K+ in muscovite mica) (26). This layer is disrupted by standard cleavage procedures, e.g. by means of scotch tape. Buffer salts were purchased from Merck, Darmstadt, Germany. RNase A (7000 units/ml) was obtained from Qiagen, Vienna, Austria.
HRV2, originally obtained from the American Type Culture Collection (ATCC), was prepared in HeLa-H1 cells grown in suspension culture and purified by sucrose density gradient centrifugation essentially as described previously (27).
HRV2 immobilization
for 20 min resulting in a densely packed virus monolayer. A lower coverage of the surface was obtained by reducing the HRV2 concentration to 20 µg/ml leaving the other adsorption conditions unchanged. Unattached viruses were removed by washing three times with the same buffer.
MACmode AFM
A schematic diagram of an atomic force microscope is given in Figure 1. The key element of an AFM is the cantilever, which consists of silicon nitride with ~ 200 µm in length and ~ 1 µm in thickness. At the end of the cantilever, a sharp tip with a radius of about 5 to 40 nm is mounted which senses the force between the sample and the cantilever. To minimize the force between the tip and sample during imaging, the cantilever has a spring constant of less than 1 N/m. The cantilever deflection is recorded by a laser beam reflected from the back of the cantilever onto a position-sensitive, four-segment photodiode.
All topographical images were acquired with a magnetically driven dynamic force microscope (MACmode PicoSPM, Molecular Imaging, Tempe, AZ) and magnetically coated MacLevers (Molecular Imaging, Tempe, AZ). During imaging, an electronic feedback loop (Fig. 1, Controller) adjusts through a piezoelectric-positioner (Fig. 1, piezo-tube) the vertical position of the cantilever in order to keep the amplitude of the oscillating tip constant.
Fig. 1: Schematic diagram of a magnetic AC mode (MACmode) AFM used for imaging HRV2 in liquids. MACmode is a gentle non-destructive AFM imaging technique, which employs a magnetic field to drive a magnetically coated cantilever, yielding precise control over the oscillation amplitude and the applied force.
We used a lateral scan frequency of 1.3 lines/s, resulting in a total recording time of 7 min per image (according to 512 lines per image); the nominal spring constant of the cantilevers used was 0.1 N/m. For gentle imaging, the peak-to-peak oscillation amplitude was set to 5 nm at 7-8 kHz oscillation frequency. The feedback loop was adjusted to 20% amplitude reduction in order to obtain stable images. All images were acquired in buffer solution; a commercial fluid cell was used for imaging in fluids.
RESULTS AND DISCUSSION
Adjustment of optimal parameters prior to imaging
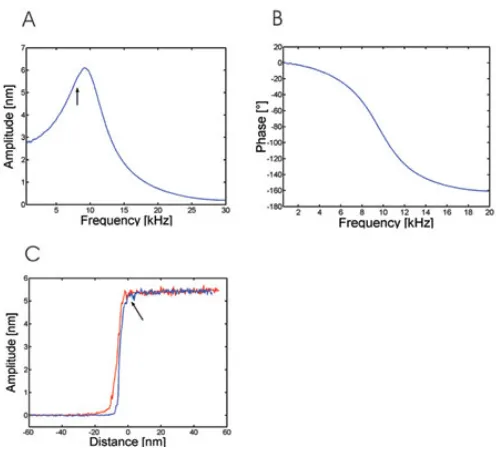
MACmode AFM has the advantage over acoustically driven cantilevers that the magnetically coated cantilevers are directly excited by an external magnetic field. This results in a sinusoidal oscillation with a defined resonance frequency. A firm theoretical relationship between oscillation frequency and optimal sensitivity in AFM imaging was established using a modified harmonic oscillator model (15). The sensitive adjustment of the oscillation frequency using the resonance curve (Fig. 2A) and the related phase response (Fig. 2B) is shown in the following.
Fig. 2: Optimal adjustment of imaging parameters in MACmode AFM. (A) Amplitude-frequency plot of a magnetically excited cantilever acquired ~100 µm away from the sample surface. A distinct resonance peak is obtained at 10 kHz (using a cantilever with a spring constant of 0.1 N/m). A frequency of 8 kHz is used as excitation frequency for imaging (indicated by an arrow). (B) Phase-frequency plot simultaneously acquired to the amplitude-Phase-frequency plot. The phase lag between magnetic excitation and cantilever oscillation follows exactly a harmonic oscillator model. (C) Amplitude-distance cycle acquired on a densely packed HRV2 monolayer. Trace (red line) and retrace (blue line) are shown using the same cantilever as in (A). The free oscillation amplitude was set to 5 nm at an oscillation frequency of 8 kHz. The arrow indicates contact of the cantilever with the sample surface.
the damped harmonic oscillator theory (15, 28). The excitation frequency was then adjusted to a value yielding optimal sensitivity given by the resonance peak (9 kHz in Fig. 2A, i.e. the maximum of the resonance curve). However, the resonance curve shifts to lower frequencies when the tip interacts with the sample surface (28, 29). This effect is caused by hydrodynamic damping of the cantilever oscillation compensated by selecting the excitation frequency slightly lower than the resonance frequency at large cantilever-sample distances. According to a rule of thumb we chose the excitation frequency 20% lower than the resonance frequency at large distances (resulting in 7-8 kHz excitation frequency, indicated by an arrow in Fig. 2A) (15, 29). Once the excitation frequency is chosen as described, the cantilever approaches towards the sample until it touches the surface.
Amplitude-distance cycles were then used to adjust the free cantilever oscillation amplitude (i.e. the free amplitude) and to determine the optimal amplitude reduction value (i.e. the set point value) for driving the feedback loop during imaging. Figure 2C shows the amplitude-distance cycle of an oscillating cantilever on a densely packed HRV2 layer in buffer solution. The amplitude of the oscillation is shown for both the approach (trace, red) and the retraction (retrace, blue) of the cantilever as a function of the cantilever-surface distance. Far away from the surface, the oscillation amplitude (i.e. the free amplitude) is not influenced by the sample and remains constant during approach and retraction. As the tip is pushed onto the surface, the amplitude decreases until it is fully damped to zero at full contact (trace, red line). Upon retraction of the cantilever from the surface (retrace, blue line), the amplitude starts to increase until it reaches the free amplitude again (indicated by an arrow). The free oscillation amplitude is set to a low value (~ 5 nm); this is important for a minimal energy input during imaging, thus preventing disruption of the sample and allowing stable imaging.
In addition to small oscillation amplitudes, the amplitude reduction used as feedback signal in imaging is of special importance. To adjust for optimal amplitude reduction, the set point was chosen appropriately prior to imaging via the amplitude-distance cycle (Fig. 2C). We adjusted the set point so that the amplitude reduction is 20% (i.e. 1 nm at 5 nm free amplitude), resulting in 80% imaging amplitude (i.e. 4 nm at 5 nm free amplitude). A reduction of 1 nm in amplitude correlates to an imaging force of F ~ 50 pN (for a cantilever spring constant of k = 100 pN/nm and a Q-factor of 1.8, i.e. F ~ k*a/Q) (14). Since the estimated force of 50 pN is only exerted at the lower part of the oscillation curve described by the cantilever an average force of less than 50 pN is applied during scanning. Due to the low forces applied no lateral indentation of the sample takes place during imaging in dynamic force microscopy; this is in clear contrast to the scanning in contact-mode AFM, where lateral forces are mainly responsible for the displacement of weakly adhered samples.
In summary, the free oscillation amplitude, the amplitude reduction for the feedback while imaging (i.e. the set point), and the spring constant of the cantilever are the critical parameters to be adjusted. The abovementioned selection of imaging parameters guaranteed a stable imaging of the weakly adsorbed
viruses without mechanical distortion, yielding images with high topographical resolution.
Imaging of HRV2 attached to mica surfaces
To obtain high-quality topological images with AFM, a tight immobilization of the biological specimen to a flat surface is pivotal. In a previous study, HRV2 bound to an artificial cell membrane containing derivatives of the very-low density lipoprotein receptor was studied using MACmode AFM (24). The presence of the receptor resulted in specific, tight immobilization of HRV2. Here, we immobilized HRV2 non-covalently in buffer solution onto mica, a highly hydrophilic aluminosilicate (25). By using Ni2+ ions as bridge between the negatively charged mica and the virus, stable binding was obtained. Several other bivalent cations like Mg2+ and Co2+ were also tested, but in contrast to Ni2+, these did not result in stable imaging of viruses. Therefore, all measurements reported in this study were carried out in a 50 mM Tris-buffer containing 5 mM Ni2+; repeated imaging over many hours showed no damage or displacement of the sample.
Physical adsorption from solution onto mica has the advantage that the adsorption process takes only several minutes and that pretreatment of neither virus nor mica surface is necessary. In addition to its simplicity, physical adsorption is very robust to variation in parameters; for instance, layers with different degrees of package were obtained by simply varying the virus concentrations in the adsorption buffer, e.g. 1 mg/ml HRV2 gave a densely packed layer, while 20 µg/ml HRV2 resulted in sparse coverage. The virus coverage on mica scaled therefore almost linearly with the virus concentration in the adsorption buffer.
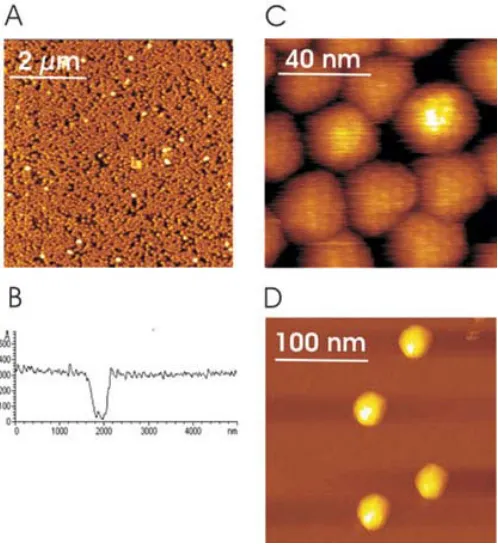
Figure 3 shows regularly arranged viruses in a densely packed monolayer (Fig. 3A, B, and C) and single virions adsorbed on mica at much less coverage (Fig. 3D). An almost complete coverage of HRV2 on mica was obtained at high virus concentrations in the adsorption buffer (Fig. 3A). The height of the layer was determined to 31 + 3 nm from the cross section profile using an uncovered spot on mica as reference (Fig. 3B); this agrees very well with values derived from X-ray and electron cryo-microscopy measurements of HRV2, respectively (30, 31). The high magnification image in Fig. 3C shows a tight packing of regularly arranged viruses. The close apposition of the virions appears to result in some structural deformation, indicating that the immobilization onto mica together with lateral packing forces of the monolayer can lead to local distortions of the virus capsids. A regularly spaced pattern was observed on almost all viral particles, which might reflect the known protrusions on the surface of the viral capsid.
deformation and neither the applied imaging force nor the surface immobilization procedure. However, for virions at low coverage, virus capsids appear not strictly globular in shape, but the projection of the particles rather exhibits some straight borders akin to their icosahedral surface features (30). Regardless of the surface coverage, virus particles were stably imaged without any cantilever-induced movement over hours.
Fig. 3: MACmode topography images of HRV2. (A) Densely packed HRV2 monolayer. Black regions correspond to holes, whereas white spots are viruses bound on top of the first HRV2 layer. The peak-to-peak amplitude of the cantilever oscillation was 5 nm at 8 kHz excitation frequency; cantilever spring constant was 0.1 N/m. The image was acquired at a scan size of 6 µm. (B) Cross section profile of a homogenous virus monolayer containing a large defect hole. The height of the virus layer was determined to 31 ± 3 nm. (C) Small scan size image of single HRV2 particles. The close apposition of the virions results in a deformation of the capsids. A regular pattern of ~ 3 nm can be observed on most of the capsids. Image scan size was 100 nm. (D) Separated virions show polygonal areas without deformation of the capsid. Image scan size was 250 nm. Figure 1 reprinted from (25). Copyright 2004 with permission from the American Society for Microbiology.
Although we are reporting exact values of the virus height, the measurement of particle size and the dimensions of individual particles must be treated with some care. This is because the horizontal dimensions of objects are always overestimated due to the well-known tip convolution effect in AFM images (32). In the simplest approximation we can imagine a sphere of radius R (i.e. the AFM tip) to roll over a single spherical particle with diameter d attached on a flat surface. Simple geometric considerations lead to the estimation of the diameter of the tip-convoluted object, i.e. the full width at half maximum (FWHM) of the appearing object is FWHM = 2*((d*(R + d/4))^0.5) (with R > d/2). Accordingly, the observed lateral dimension of a single spherical object with a diameter of 30 nm (as for HRV2) will result in an image of 57 nm (based on a radius of the AFM tip of 20 nm). This
corresponds to the diameters of virions observed in this study, which varied from 35 nm to 60 nm, depending on the cantilever used. Due to this effect, the lateral diameters of single objects always appear too large; however, it is important to note that the vertical dimension is not influenced by the finite tip apex. Therefore, for roughly spherical particles such as icosahedral viruses, the vertical height of the particle gives a remarkably accurate value for their true diameter.
For periodic structures (e.g. viruses in Fig. 3C), the situation is different from single particles (e.g. viruses in Fig. 3D). As the AFM tip passes over the surface of a layer of particles, the tip never approaches the lower part of the objects. Thus, the height observed for a densely packed layer does not give a true measure of the diameter of the particles. The only way to estimate the diameter is to measure the center-to-center distance of individual particles in the layer; in the most of the cases values close to the true diameters are yielded.
Monitoring the release of the viral genomic RNA
The release of RNA from the HRV2 capsid is triggered in vivo by a low pH environment (pH < 5.6) in endosomal carrier vesicles and late endosomes (21). To mimic the process of RNA release, HRV2 bound to mica at low coverage (Fig. 4A) was exposed to buffer at pH 4.1. After 2 h, the pH was readjusted to pH 7.6 by flushing the liquid cell with the original buffer. The viruses thus remained attached to mica during the procedure. Then, images were taken again to observe eventual changes in the viral morphology. Single short RNA molecules were frequently observed (Fig. 4B, arrows), showing a height of about 1 nm. They were either disparate from the virus or still connected to it. Apparently, the latter molecules had not entirely left the viral shell and were thus viewed directly during the process of extrusion. No such RNA molecules were observed when the sample was imaged immediately after the cell buffer had been replaced with the low pH buffer.
Fig. 4: Release of the genomic RNA from HRV2. (A) Single virions (white spots) adsorbed onto mica and imaged in pH 7.6 buffer. Scan size was 900 nm. (B) The pH of the buffer was changed to 4.1 and maintained for 2 hours. Images were acquired again at pH 7.6. Virus particles are observed together with RNA molecules (see arrows) either separated from the virus capsid or still connected. Scan size was 900 nm. Figure 2 reprinted from (25). Copyright 2004 with permission from the American Society for Microbiology.
of RNA release were observed. Virus capsids appeared with heights of 25 to 35 nm, and the height of the RNA molecules varied between 1 and 1.5 nm, which is in quite good agreement with the reported height of RNA measured by tapping-mode AFM (33). Due to the tip convolution effect, the lateral diameter of RNA is greatly overestimated in the AFM images (32). According to the formula given in the previous chapter, the lateral dimension of an object with a diameter of 1.5 nm (as for RNA) will result in an image of 11 nm (tip radius 20 nm). This value corresponds well to the average diameter of RNA observed in this study, which is ~ 10 nm (Fig. 5).
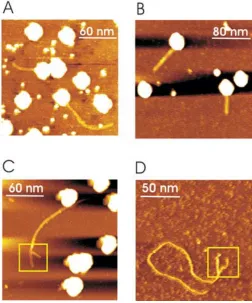
Fig. 5: Snap shot images of the RNA release. (A) Bent RNA molecules in connection with the virus capsid. Virus particles are observed as bright spots with heights of about 31 nm. The smaller bright dots with 10 nm in diameter are presumably debris of the virus capsid. Scan size was 200 nm. (B) Regularly shaped virus particles with straight RNA molecules still connected to the virus capsids. Scan size was 250 nm. (C) Fully released RNA molecules. RNA completely released from virus capsids occasionally had a fork-like structure at one end of the RNA (box). The length of the fork was ~ 30 nm. Scan size was 200 nm. (D) Individual RNA molecule separated from the virus capsid exhibiting a similar fork-like structure (box) than in (C). Scan size was 150 nm. Figure panels modified and reprinted from (25). Copyright 2004 with permission from the American Society for Microbiology.
RNA molecules observed in the process of extrusion were either in a bent conformation (Fig. 5A) or in a straight conformation (Fig. 5B) which is corroborated by investigations of isolated RNA (33). The straight appearance of the RNA molecules is related to observing only relatively short RNA molecules (ranged from 40 to 330 nm), were the length is close to the reported persistence length of RNA (34). Additionally, the appearance of RNA strongly depends on how it adsorbs to the surface. Since
we used buffer conditions causing a very tight binding to mica, the movement and rotation of RNA is restricted again favoring a straight conformation.
That the fibers protruding from the virus capsids were indeed RNA molecules was proved by injecting RNase A into the liquid cell of the AFM (25). Comparing the images prior and after injection of the enzyme showed that the fibers disappeared upon enzymatic treatment. This unambiguously identified the elongated structures as RNA molecules.
In those cases where the RNA was completely separated from the virus capsid, and therefore released entirely, a fork-like structure was occasionally seen at one end of the molecule (Fig. 5C, D). This branch extended by about 30 nm and was only seen on RNA molecules not connected to the virus capsid. We suggested that these fork-like structures might correspond to characteristic structural elements located at the 5' terminus of the RNA genome (25). However, based on a genome size of ~7.100 nucleotides, a contour length of roughly 2 µm is expected (using a length of 0.3 nm per base pair, (35)) for entirely released and extended RNA. In contrast, the contour length of released RNA molecules seen in Figure 5C and D is only ~ 200 nm. The difference between observed and expected lengths may be attributed to the fact that the experiments were performed in buffer solution without RNase inhibitor; hence degradation of the RNA certainly occured. Longer molecules with lengths of ~ 1 µm were observed only when the RNA was tightly packed on mica, which most likely prevented degradation due to the high local concentration of RNA (25).
In summary, topographical images of HRV2 were obtained routinely using dynamic force microscopy. Although the achieved resolution was only half of the resolution of electron cryo-microscopy (36), AFM measurements were carried out under physiological conditions, i.e. at room temperature and in buffer solution. Induced by a low pH environment, single RNA molecules were released from the virions and snap shot images of this process were acquired. RNA molecules released entirely showed fork-like structures resolved at one end of the RNA molecules. This study shows the potential of DFM to obtain new insights into the molecular mechanism and dynamics of viral uncoating and RNA release.
ACKNOWLEDGMENTS
This work was supported by Austrian Science Foundation project P14549 and the GEN-AU initiative of the Austrian Ministry of Education, Science and Culture. The authors have no conflicts of interest to declare related to this publication.
REFERENCES
1. Binnig G, Quate CF, Gerber C. Atomic force microscope. Physical Review Letters 1986; 56:930-933.
3. Engel A, Muller DJ. Observing single biomolecules at work with the atomic force microscope. Nat Struct Biol 2000; 7:715-718.
4. Radmacher M. Measuring the elastic properties of living cells by the atomic force microscope. Methods Cell Biol 2002; 68:67-90.
5. Viani MB, Pietrasanta LI, Thompson JB, Chand A, Gebeshuber IC, Kindt JH, Richter M, Hansma HG, Hansma PK. Probing protein-protein interactions in real time. Nat Struct Biol 2000; 7:644-647.
6. Hinterdorfer P. Molecular Recognition Studies Using the Atomic Force Microscope. Methods Cell Biol 2002; 68:115-139.
7. Hoh JH, Sosinsky GE, Revel JP, Hansma PK. Structure of the extracellular surface of the gap junction by atomic force microscopy. Biophys J 1993; 65:149-163.
8. Muller DJ, Schabert FA, Buldt G, Engel A. Imaging purple membranes in aqueous solutions at sub-nanometer resolution by atomic force microscopy. Biophys J 1995; 68:1681-1686.
9. Karrasch S, Dolder M, Schabert F, Ramsden J, Engel A. Covalent binding of biological samples to solid supports for scanning probe microscopy in buffer solution. Biophys J 1993; 65:2437-2446.
10. Putman CAJ, Vanderwerf KO, de Grooth BG, Vanhulst NF, Greve J. Tapping mode atomic force microscopy in liquid. Appl Phys Lett 1994; 64:2454-2456.
11. Han W, Lindsay SM, Jing T. A magnetically driven oscillating probe microscope for operation in liquid. Appl. Phys. Lett. 1996; 69:1-3.
12. Han W, Lindsay SM, Dlakic M, Harrington RE. Kinked DNA. Nature 1997; 386:563.
13. Kienberger F, Stroh C, Kada G, Moser R, Baumgartner W, Pastushenko V, Rankl C, Schmidt U, Muller H, Orlova E, LeGrimellec C, Drenckhahn D, Blaas D, Hinterdorfer P. Dynamic force microscopy imaging of native membranes. Ultramicroscopy 2003; 97:229-237.
14. Humphris ADL, Tamayo J, Miles MJ. Active Quality Factor Control in Liquids for Force Spectroscopy. Langmuir 2000; 16:7891-7894.
15. Schindler H, Badt D, Hinterdorfer P, Kienberger F, Raab A, Wielert-Badt S, Pastushenko V. Optimal sensitivity for molecular recognition MAC-mode AFM. Ultramicroscopy 2000; 82:227-235.
16. Lantz M, Liu YZ, Cui XD, Tokumoto H, Lindsay SM. Dynamic force microscopy in fluids. Interface Anal 1999; 27:354-360.
17. Kienberger F, Muller H, Pastushenko V, Hinterdorfer P. Following Single Antibody Binding to Purple Membranes in Real Time. EMBO Rep 2004; 5:579-583.
18. Rossmann MG, Arnold E, Erickson JW, Frankenberger EA, Griffith JP, Hecht HJ, Johnson JE, Kamer G, Luo M, Mosser AG et al. Structure of a human common cold virus and functional relationship to other picornaviruses. Nature 1985; 317:145-153.
19. Staunton DE, Merluzzi VJ, Rothlein R, Barton R, Marlin SD, Springer TA. A cell adhesion molecule, ICAM-1, is the major surface receptor for rhinoviruses. Cell 1989; 56:849-853.
20. Hofer F, Gruenberger M, Kowalski H, Machat H, Huettinger M, Kuechler E, Blass D. Members of the low density lipoprotein receptor family mediate cell entry of a
minor-group common cold virus. Proc Natl Acad Sci USA 1994; 91:1839-1842.
21. Prchla E, Kuechler E, Blaas D, Fuchs R. Uncoating of human rhinovirus serotype 2 from late endosomes. J Virol 1994; 68:3713-3723.
22. Hewat EA, Neumann E, Blaas D. The concerted conformational changes during human rhinovirus 2 uncoating. Mol Cell 2002; 10:317-326.
23. McGregor S, Mayor HD. Internal components released from rhinovirus and poliovirus by heat. J Gen Virol 1971; 10:203-207.
24. Kienberger F, Moser R, Schindler H, Blaas D, Hinterdorfer P. Quasi-crystalline arrangement of human rhinovirus 2 on model membranes. Single Mol 2001; 2:99-103.
25. Kienberger F, Zhu R, Moser R, Blaas D, Hinterdorfer P. Monitoring RNA release from human rhinovirus by dynamic force microscopy. J Virol 2004; 78:3203-3209.
26. Muller DJ, Amrein M, Engel A. Adsorption of biological molecules to a solid support for scanning probe microscopy. J Struct Biol 1997; 119:172-188.
27. Hewat EA, Neumann E, Conway JF, Moser R, Ronacher B, Marlovits TC, Blaas D. The cellular receptor to human rhinovirus 2 binds around the 5-fold axis and not in the canyon: a structural view. Embo J 2000; 19:6317-6325. 28. Pastushenko V, Hinterdorfer P, Kienberger F, Borken C,
Schindler H. Effects of Viscoelastic Cantilever-Sample Interaction on Laser Beam Deflection in MACmode MRFM. Single Mol 2000; 2:165-170.
29. Rankl C, Pastushenko V, Kienberger F, Stroh C, Hinterdorfer P. Hydrodynamic damping of a magnetically oscillated cantilever close to a surface. Ultramicroscopy 2004; in press.
30. Verdaguer N, Blaas D, Fita I. Structure of human rhinovirus serotype 2 (HRV2). J Mol Biol 2000; 300:1179-1194.
31. Hewat EA, Blaas D. Structure of a neutralizing antibody bound bivalently to human rhinovirus 2. Embo J 1996; 15:1515-1523.
32. Stemmer A, Engel A. Imaging biological macromolecules by STM: quantitative interpretation of topographs. Ultramicroscopy 1990; 34:129-140.
33. Hansma HG, Revenko I, Kim K, Laney DE. Atomic force microscopy of long and short double-stranded, single-stranded and triple-single-stranded nucleic acids. Nucleic Acids Res 1996; 24:713-720.
34. Drygin YF, Bordunova OA, Gallyamov MO, Yaminsky IV. Atomic force microscopy examination of tobacco mosaic virus and virion RNA. FEBS Lett 1998; 425:217-221.
35. Fay MJ, Walter NG, Burke JM. Imaging of single hairpin ribozymes in solution by atomic force microscopy. Rna 2001; 7:887-895.
36. Neumann E, Moser R, Snyers L, Blaas D, Hewat EA. A cellular receptor of human rhinovirus type 2, the very-low-density lipoprotein receptor, binds to two neighboring proteins of the viral capsid. J Virol 2003; 77:8504-8511. 37. Blake K, O'Connell S. Virus Culture. In: Harper, DR, editor.
Virology Labfax. West Smithfield, London: Blackwell Scientific Publications; 1993. p. 81-122.
PROTOCOLS
A. Isolation of HRV2 particles
1. For virus production, about 5x10⁷ HeLa-H1 cells (Flow laboratories, Irvine, Scotland) were seeded per 1 L minimum essential medium modified for suspension (Sigma, Vienna, Austria), containing 7% heat inactivated horse serum, 100 U/ml penicillin and 100 µg/ml streptomycin (all from Gibco, Rockville, MD) and grown at 25 rpm in a 2 L spinner flask (Bellco, Vineland, NJ) at 37oC for 4 days.
2. Cells, now about 5x10⁸ were pelleted at 2000 rpm in a Beckman J6B centrifuge and resuspended in the same medium but containing only 2% horse serum and, in addition, 2 mM MgCl2. For infection, ~ 5x10⁹ TCID50 (tissue infectious dose, i.e. virus concentration that results in infection of 50 % of the cells; (37)) was added and incubation was continued at 34oC for 16 h.
3. The infected cells were collected in a pellet at 4000 rpm, resuspended in 20 ml of 10 mM EDTA, 10 mM Tris-HCl (pH 7.5), broken with a tight fitting Dounce homogenizer, and debris was removed by low speed centrifugation. Virus in the supernatant was pelleted using a Ti45 fixed angle rotor (Beckman, High Wycombe, UK) for 2 h at 30 krpm.
4. Virus pellets obtained from 4 L suspension culture were resuspended over night in 1 ml buffer A (2 mM MgCl2, 20 mM Tris-HCl (pH 7.5)), and contaminating material was digested by addition of RNaseI and DNase (Boehringer Mannheim, Vienna, Germany), each to a final concentration of 0.1 mg/ml. Incubation at room temperature for 10 min, addition of 0.1 mg/ml trypsin and incubation at 37oC for 5 min were followed.
5. Then, sarcosin was added to 0.1% and the mixture was left at 4oC overnight. Insoluble material was removed by centrifugation in an Eppendorf centrifuge for 15 min and the supernatant was deposited on 7.5 – 45% sucrose density gradient in buffer A, preformed in SW28 Beckman centrifuge tube. Centrifugation was for 3.5 h at 25 krpm at 4oC. The virus band seen in the middle of the gradient by shining light into the tube from the top was collected with a needle connected to a syringe.
6. After dilution with buffer A virus was pelleted in a SW28 Beckman centrifuge tube at 25 krpm for 16 h. The pellet was resuspended in 200 µl of 50 mM HEPES-Na salt (pH 7.5), insoluble material was pelleted in an Eppendorf centrifuge, and the supernatant was stored at -80oC.
7. Purity and concentration were assessed by 15% SDS-polyacrylamide gel electrophoresis that reveals the capsid proteins VP1, VP2, and VP3 (VP4 is usually not visible) and by capillary electrophoresis (38).
B. HRV2 immobilization onto mica
1. A stock solution of ~ 3 mg/ml HRV2 is stored at -20°C. After thawing, 5 µl aliquots at 1 mg/ml HRV2 are prepared by dilution with 50 mM Tris-HCl, pH 7.6, and again kept at -20°C. For the experiments always a new sample is used; repeated freezing and thawing of the virus is thereby avoided.
2. A buffer of 50 mM Tris-HCl, 5 mM NiCl2, pH 7.6 (TBN) is prepared in double distilled (dd) water and filtered through a 0.2 µm filter (Schleicher & Schuell, Dassel, Germany). The solution is stored at 4oC and should only be used for up to two weeks.
3. Thaw a vial with 5 µl 1 mg/ml HRV2. Mix with 25 µl TBN.
4. Cleave a mica sheet (2 cm x 2 cm) using Scotch tape. Repeat the procedure two times and ascertain that the mica layer removed is homogenous. Mount the cleaved mica sheet into the liquid cell of the AFM. Put the 30 µl virus solution from Step 3 onto the mica surface and incubate for 20 min. Wash five times with TBN and fill the AFM fluid cell with the same buffer for imaging.
5. The above protocol results in a full coverage of virus on the mica. To obtain a lower coverage, the virus concentration in the final adsorption buffer is reduced to 20 µg/ml, but leaving the other conditions unchanged.
C. MACmode AFM imaging
1. A magnetically coated cantilever (Molecular Imaging, Tempe, AZ) is washed carefully with SDS (10 % Na-dodecylsulfate), dd water, ethanol and again with dd water to remove any contamination from the cantilever. The cantilever holder is cleaned by the same procedure. After mounting onto the scanner, it is put into the liquid cell and optimal imaging parameters are adjusted. 2. The laser spot is adjusted on the cantilever and the position of the photo detector is varied to get maximum sum signal (done by
µm-screws).
3. The resonance curve of the cantilever is acquired roughly 100 µm away from the surface; for the cantilevers used in this study (spring constant ~ 100 pN/nm), the resonance frequency is at about 9 kHz. For imaging, set the excitation frequency by 20 % lower (to 7-8 kHz). Adjust the driving signal (coil-current) to get free cantilever oscillation amplitudes of about 5 nm.
keep the 5 nm amplitude. Automatic approaching stops when the pre-adjusted amplitude reduction of 20 % is reached (this value turned out to work for various cantilevers and samples).
5. Amplitude-distance curves are then measured. The set point (i.e. the amplitude reduction value) used as feedback signal in imaging is pre-adjusted so that the amplitude reduction is 1 nm (corresponding to roughly 50 pN imaging force).
6. Switch to imaging mode; adjust the integral and proportional gains as to obtain a stable time resolved signal. Start imaging at larger scan sizes and reduce the scanning size consecutively (not the other way round). During imaging, adjust the set point continuously to minimize the imaging force.
D. Induction of the RNA release from HRV2
1. Clean the fluid cell, the cantilever and the cantilever holder carefully with SDS, water, ethanol, and water. 2. Cleave a piece of mica (2 cm × 2 cm) and mount the sheet in the fluid cell of the AFM.
3. Attach HRV2 at low coverage. A 5 µl aliquot of HRV2 is diluted with 245 µl TBN; this results in 250 µl solution containing 20 µg/ml HRV2. This solution is then put into the liquid cell and virus is allowed to adsorb for 20 min. Wash five times with TBN and fill the fluid cell with the same buffer for imaging. In this setup AFM images show singly distributed virions adsorbed on mica; it is important to note that at this stage no RNA molecules are seen.