Patron: Her Majesty The Queen Rothamsted Research Harpenden, Herts, AL5 2JQ
Telephone: +44 (0)1582 763133 Web: http://www.rothamsted.ac.uk/
Rothamsted Repository Download
A - Papers appearing in refereed journals
Murray, P. J., Moss, A., Lockyer, D. R. and Jarvis, S. C. 1999. A
comparison of systems for measuring methane emissions from sheep.
The Journal of Agricultural Science. 133 (4), pp. 439-444.
The publisher's version can be accessed at:
•
https://dx.doi.org/10.1017/S0021859699007182
The output can be accessed at:
https://repository.rothamsted.ac.uk/item/85357/a-comparison-of-systems-for-measuring-methane-emissions-from-sheep.
© 1 December 1999, Cambridge University Press (CUP).
#1999Cambridge University Press
A comparison of systems for measuring methane
emissions from sheep
P. J. M U R R A Y"*, A. M O S S#, D. R. L O C K Y E R" S. C. J A R V I S"
"Institute of Grassland and Environmental Research,North Wyke Research Station,Okehampton, Devon,EX20 2SB,UK
#ADAS Feed Evaluation and Nutritional Sciences,Drayton,Alcester Road,Stratford-on-Avon, Warwicks,CV37 9RQ,UK
(Revised MS received 26 May 1999)
S U M M A R Y
Two experiments were conducted, at ADAS Drayton in the autumn and winter 1996\1997, to compare methane (CH%) emissions from sheep housed either in a polytunnel system or in open-circuit respiration chambers. In each system, the sheep received maintenance levels of either cut grass or high temperature dried grass pellets (HTDG). All experiments in the tunnel were conducted on concrete to avoid any interactions of the CH%with the soil\plant environment. The results suggested that CH% production from the open-circuit chambers was greater than from the tunnel system (26n9p0n46v. 31n7p0n35 l\kg dry matter intake (p..) for open circuit respiration chambers and tunnel, respectively). Recovery tests gave similar results for both systems (95n5–97n9 % for tunnels and 89n2–96n7 % for chambers), and confirmed that both methods give good quantitative recovery of added CH%, and can therefore be assumed to provide reliable estimates of emissions from animals. There is no technical explanation, therefore, for the different estimates of emissions provided by the two systems. Further studies are required to understand the reasons for the differences and in particular, the possible links between animal behaviour induced by the two systems and CH%emission rates.
I N T R O D U C T I O N
Methane (CH
%) is one of the main greenhouse gases contributing to global warming. The most abundant of these gases is carbon dioxide (CO
#) which accounts for c. 60 % of the greenhouse effect at present. However, CH
%is 25 times more active in this respect per molecule than carbon dioxide (Rodhe 1990). The concentration of CH
% in the atmosphere has been increasing over recent years at a rate of 0n5–1n1 % per year (Bouwmann 1990 ; Steele et al. 1992) and it is estimated that CH
% now contributes c. 18 % of the global warming potential. Annually, c. 500 Tg\y of CH
% are generated globally (Bandyopadhyay et al. 1996) and the main sources are from agriculture, with enteric generation by ruminants, rice paddies and biomass burning accounting for 65 % of total emissions (Duxbury 1994). In the UK, it is estimated that 37 % of CH
% emissions can be almost entirely attributed to animal production systems (Watt Com-mittee on Energy 1993). In order to make progress
* To whom all correspondence should be addressed. Email : phil.murray!bbsrc.ac.uk
towards commitments to reduce emission of green-house gases, it is essential that the contributions of all sources and sinks should be accurately assessed.
Many current inventories for enteric CH % pro-duction are based on measurements of emission rates from animals in open circuit respirometers in strictly controlled environments, with specific diets linked to energy balances. Such studies give accurate results for emissions under such controlled conditions, but may not represent interactive effects under natural condi-tions. For example, many production systems are based on extended periods of grazing where the interactions between soil\plant\animal components of grazing systems may influence net emissions of CH
%for a number of reasons. An alternative system, which involves housing animals in a polytunnel on grass swards, has been developed which enables the measurement of CH
%fluxes under near-natural graz-ing conditions (Lockyer & Jarvis 1995). In previous studies with this system (Lockyer 1997), results indicated lower emission rates from sheep than those found using conventional respirometers. To provide reliable CH
440 .. E T A L.
provide some explanation for their causes. The present study therefore sought to determine CH
% emissions from sheep, measured in parallel experiments in respirometers and in the polytunnel system. This was done in order to establish whether the differences previously found were real and, if so, to develop some understanding of their causes.
M A T E R I A L S A N D M E T H O D S
The two systems for measuring CH
%emissions from sheep, which were compared in a series of studies, were as follows.
Tunnel system
The system used to assess CH
%emissions from grazing animals has been described in full by Lockyer & Jarvis (1995) and has been used in a number of studies with sheep (Lockyer 1997). Briefly, it consists of (i) a large polythene tunnel, (ii) two small wind-tunnels used to blow air into, and draw air from, the larger tunnel, (iii) apparatus to measure and record the concentrations of CH
%in the air entering and leaving the tunnel and (iv) apparatus to monitor and record airspeeds and temperatures. The large tunnel (poly-tunnel) is a commercial, polythene-clad greenhouse modified to make it portable ; it is 4n3 m wide, 9n9 m long with a height of 2n1 m at the ridge, giving an approximate volume of 66 m$. The framework of the tunnel is covered with white polythene sheeting which is drawn down at each end to connect to each of the small wind-tunnels (described by Lockyer 1984). Each wind-tunnel consists of a steel duct, 1n5 m long and 0n4 m internal diameter, housing a co-axial fan and a vane anemometer. Airflow through each tunnel can be controlled at rates of up to 1n0 m$\s. The output of each anemometer is recorded by a data logger (Delta-T Devices Ltd. Cambridge, UK) to provide an integrated measurement of airspeed from which the volume flow of air through the tunnel can be calculated.
Methane concentrations in air entering and leaving the polytunnel are measured using an automatic sampling system connected to a gas chromatograph (GC) fitted with a flame ionization detector (FID). Air is drawn continuously from two sampling points, one near the inlet to the polytunnel and one within the small wind-tunnel that forms the outlet. A sampling unit, under the control of a data logger (Campbell Scientific Ltd, Shepshed, UK), allows samples (2n0 ml) to be taken in turn from the inlet and outlet air and injected automatically onto the GC column ; the output from the FID is scanned continuously by the data logger which is also programmed to detect, integrate and record each CH
%peak. Concentrations are then calculated from a standard curve prepared after measuring the response of the FID to known concentrations of CH
% in helium. Typically, peak
concentrations rise toc. 10 ml\l which can be detected with an accuracy ofc. 0n4 % over the measurement range.
Open-circuit respiration chambers
The four open-circuit respiration chambers used were of stainless steel and Perspex construction (c. 2n4 m$ volume) and similar in operation to that described by McClean & Tobin (1987). Dry gas meters were fitted in the pipework between the chambers and the air suction pumps (60 l\min) to measure the total volume of gas passing through each chamber. Continuous subsampling of the outflow gas from each chamber at 3 minute intervals for each were analysed, with the incoming air, for CH
%by passing it through an infra-red CH
%analyser (Analytical Development Company Ltd, Hoddesdon, UK) and the absorption determined at wavelength 3n29µm. Methane volume was adjusted to standard temperature and pressure and the infra-red analyser was calibrated daily.
Experimental procedures
In all experiments, measurements were made with Clun wether sheep (approx. 60–70 kg liveweight). Two groups of four sheep were maintained as the experimental animals. These animals were kept in the same groups throughout the studies. A further two sheep were maintained over the entire study period on the appropriate diet so that they could be used as replacement animals if needed, however, this was not necessary. In addition to receiving the relevant diet, each sheep received 7n0 g\day of a sheep mineral\ vitamin supplement. The animals were allowed to acclimate to the appropriate diet for a period of 14 d before each study. The sheep were weighed at the start of each acclimatization period and at the start and end of each measurement period.
The comparison between systems was carried out using two feed types. One was grass that was harvested (direct cut forage harvester) from a sward at ADAS Drayton on 12 September 1996. The sward consisted predominantly of perennial ryegrass and had received fertilizer to supply 50 kg\ha of N on 18 May 1996. The grass was thoroughly mixed, bagged and stored frozen atk18mC with sufficient material to provide daily rations for an approximate maintenance al-lowance for the experimental animals. The ration was thawed prior to feeding to the animals. The second feed that was offered was a ration of High Tem-perature Dried Grass (HTDG) pellets. Feeding allocations were provided which again met main-tenance requirements.
1·8
1·6
1·4
1·2
1·0
0·8
0·6
0·4
0·2
0
1 2 3 4 5 6 7 8 9 10 11 12 13 14 15 16 17 18 19 20 21 22 23 24
Time of day (h)
Methane emission per animal (l/h)
Time of feed
Chambers Tunnel
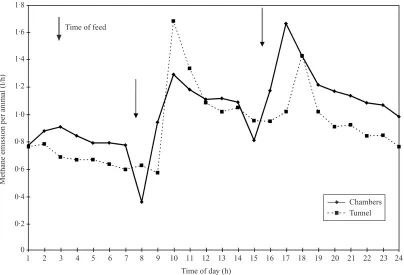
Fig. 1. Mean hourly methane emission (1\animal\h) from sheep fed a maintenance diet of HTDG pellets, either in chambers (unbroken line) or in the polytunnel (dashed line), showing time of feeding ().
therefore not required and the inlet was closed, sufficient air being able to enter the polytunnel from under the perimeter to meet the required airflow of 0n25 m$\s. The sampling point for measuring back-ground CH
% concentration was positioned c. 2 m upwind of the tunnel. Metal hurdles were used to form four pens within the polytunnel, each provided with a water container and feeding bin. One animal was allocated to each pen, where it was able to maintain visual contact with its fellows. Measurement of CH
% concentration began about 15 min before animals were moved into the tunnel.
Each animal was offered its daily ration of feed in two equal portions given at about 09.00 h and 17.00 h. Any food not eaten by the time of the next feed was removed and weighed to allow an estimate to be made of the DM intake of each animal. The animals were removed from the tunnel at the end of each run and transferred to the open-circuit respiration chambers, where the measurements followed the same pro-cedures as those described above. The animals removed from the tunnels were replaced with the second group of four, and again the measurements followed the procedures described previously.
Emissions of CH
%in the chambers and the tunnel were compared using the mean-square prediction
error (GENSAT procedure MSPE) (Rook et al.
1990). In the present study, the values from the chambers, being the established technique, are re-garded as the ‘ actual ’ values, and those from the tunnels, being the system under test, as the ‘ predicted ’ values.
Recovery tests of CH %
In the polytunnel system, with an air flow at the outlet set at 0n25 m$\s, pure CH
%was released from a gas cylinder at 200 ml\min into the polytunnel through a precision flowmeter and needle valve. The increase in CH
%concentration above background concentration, measured at the outlet, reached 95n6 % of the theoretical value within 15 min. In terms of quan-titative recovery, 6n85 l of CH
%was measured leaving the polytunnel, i.e. 97n9 % of the 7n0 l added in 35 min.
To test the recovery of CH
%from the chambers a gravimetric method was used. Pure CH
%was released at 30 ml\min into each chamber from a small gas cylinder for 3 h followed by 60 ml\min for 2 h with an air flow at the outlet set at 60 l\min. The cylinder was weighed at the start and finish of the release periods to determine the weight of CH
%released. Temperature, relative humidity, barometric pressure and CH
% concentration were measured at 15 min intervals for 23n5 h. The mean overall quantitative CH
442 .. E T A L.
individual chambers were 89n2, 92n7, 96n7 and 91n9 for chambers 1–4, respectively. A similar gravimetric test was also done in the polytunnel at the end of the experiments and gave a mean recovery of 95n5 % of the CH
%added.
R E S U L T S
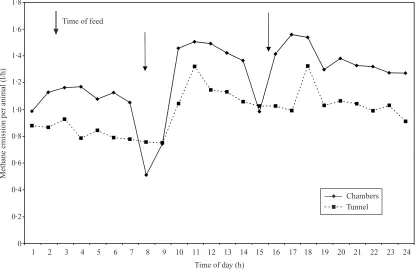
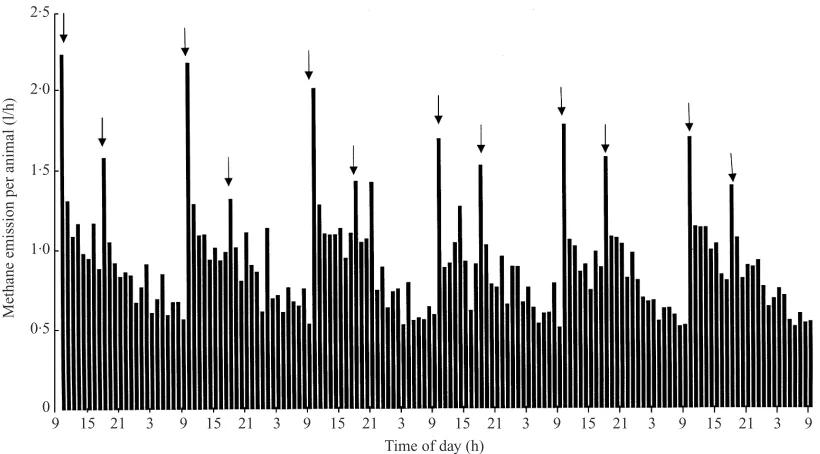
Throughout all the studies where the animals were fed to a strict regime, both in the chambers and in the tunnels, there were marked trends in CH
%emission, with a rapid rise directly after feeding. The impact of the first feed was greater than the second (Figs 1 and 2). This was especially marked with the HTDG diet and was repeated over several days (Fig. 3). This contrasts markedly with the pattern of emission seen in previous studies of animals grazing in the poly-tunnels (Lockyer & Jarvis 1995) where there was a diurnal trend with a peak in emission between 15.00 h and 16.00 h and the minimum at around 09.00 h. Daily emission rates, however expressed, were similar within systems and within feed types for zero-grazing and HTDG. CH
%production (l\kg dry matter intake) regardless of system of measurement, was higher for the frozen and thawed herbage than for the HTDG pellets (32n6 v. 31n0 l\kg dry matter intake, respect-ively, for chambers).
1·8
1·6
1·4
1·2
1·0
0·8
0·6
0·4
0·2
0
1 2 3 4 5 6 7 8 9 10 11 12 13 14 15 16 17 18 19 20 21 22 23 24
Time of day (h)
Methane emission per animal (l/h)
Time of feed
Chambers Tunnel
Fig. 2. Mean hourly methane emission (l\animal\h) from sheep fed a maintenance diet of previously frozen grass, which was allowed to thaw prior to feeding, either in chambers (unbroken line) or in the polytunnel (dashed line), showing time of feeding ().
The mean CH
%emissions and their standard errors from the two systems are shown in Table 1, together with the MSPE, the proportion of MSPE attributable to mean bias, line bias and random error, the mean bias, and the line mean prediction error (MPE) expressed as a proportion of the observed CH
% release. The high bias in the predicted error indicates that the systems were performing in the same manner but the tunnel system gave consistently lower results.
D I S C U S S I O N
Total CH
%losses from sheep in the UK are estimated to bec. 130 kt (Sneathet al. 1997). This estimate was based on measurements from individual animals which ranged from 29 g\d (Moss 1993) and 22 g\d (Crutzen et al. 1986) to 14 g\d (Lockyer & Jarvis 1995). The first two figures have been derived from animals in respiration chambers, the latter from a limited number of measurements from animals held in a polytunnel system. The present study confirms the previous indications that animals in the tunnel system produce consistently lower CH
2·5
2·0
1·5
1·0
0·5
0
9 15 21 3 9 15 21 3 9 15 21 3 9 15 21 3 9 15 21 3 9 15 21 3 9
Time of day (h)
Methane emission per animal (l/h)
Fig. 3. Mean hourly methane emission (l\animal\h), over 6 days, from sheep fed a maintenance diet of HTDG pellets in the polytunnel, showing impact of feeding time ().
Table 1.Prediction precision of CH
%emissions as measured in respiration chambers and in a tunnelsystem (polytunnel)
Chamber Tunnel Proportion of MSPE
Mean .. Mean .. MSPE Bias Line Random Bias MPE l\kg DMI 25n80 0n587 22n47 0n317 15n32 0n725 0n001 0n273 k3n33 15n17 l per animal\d 31n73 0n354 26n93 0n459 26n27 0n879 0n057 0n064 k4n81 16n15
the diets in the two studies, and the differences found between the two systems it is apparent that something other than chemical composition of the diet influenced emissions. The reasons for the differences are not clear. Recoveries of added CH
% from both systems were similar and very good and there were apparently no systematic differences in errors in measurement related to the two sampling systems. It can only be that the food processing and utilization in the rumen was affected by the conditions imposed by housing of the animals.
Possibilities that should be considered are the effect of ambient temperature and\or animal behaviour on the metabolism of the animal or on ruminal fer-mentation. The two measurement systems differ in environmental control ; the respiration chambers are controlled to maintain a temperature of 16mC and relative humidity of 60 %, whereas the tunnel has no control mechanism, so temperature and humidity will be directly determined by the ambient conditions. The zero-grazing and HTDG studies were not run
con-currently for the two systems and the studies in the tunnel commenced in December and were completed in early February. Mean ambient temperatures were significantly below the 16mC maintained in the chambers. For unshorn sheep with a fleece length of approximately 100 mm there would be no energy expenditure to maintain body heat above normal heat production unless the ambient temperature fell below k3mC (Blaxter 1962). Whilst these lower tempera-tures were unlikely to have caused cold stress for the sheep, the water on offer would have been at the same low ambient temperature and the ingestion of cold water will lower the rumen temperature. It has previously been observed (Church 1973) that ingestion of water, even at a moderate temperature (25mC) will result in a drop in rumen temperature of 5–10mC and that as much as 2 h may be required for this to become stable after drinking. The drop in rumen temperature, which is likely to be greater for the animals in the tunnel, would limit microbial activity and in turn reduce feed fermentation and hence CH
444 .. E T A L.
production. Feed digestibility and utilization were not determined for the animals during the time in the tunnel.
Methane production has been shown to be inversely related to rumen passage rate and increased ruminal passage rate is associated with cold adaptation. Kennedy & Milligan (1978) reported increased rumi-nal passage rate constants of fluid and particulate matter of 54 and 68 %, respectively, with cold adapted sheep and a subsequent 30 % decrease in CH
% production. In addition, Kennedy & Milligan (1978) found a decrease in the acetate :propionate ratio in cold-acclimatized sheep, which suggests a shift from CH
% to propionate production (Fahey & Berger 1988). The above observations were made with sheep fed at maintenance. Other workers have observed the opposite effect when the cold acclimatized animals were allowed to increase their dry matter intake to compensate for the cold conditions (von Keyserlingk & Mathison 1993). Rogerson (1960) found that the effects of temperatures between 20 and 40mC on CH
% production were variable. The evidence to date on the effect of environmental temperature on CH
% pro-duction is, however, limited and requires further
R E F E R E N C E S
B, T. K., G, P. & S, M. P. (1996). Generation of methane from paddy fields and cattle in India, and its reduction at source.Atmospheric Environ
-ment30, 2569–2574.
B, K. L. (1962).The Energy Metabolism of Ruminants. London : Hutchinson.
B, A. F. (1990). Land use and related sources of greenhouse gases. Land Use Policy7, 154–164. C, D. C. (1973).Digestive Physiology and Nutrition of
Ruminants. Vol. 1 – Digestive Physiology.Corvallis OR : O & B Books.
C, P. J., A, I. & S, W. (1986). Methane production by domestic animals, wild ruminants, other herbivorous fauna and humans.Tellus38B, 271–284. D, J. M. (1994). The significance of agricultural
sources of greenhouse gases. Fertilizer Research 38, 151–163.
F, G. C. & B, L. L. (1988). Carbohydrate nutri-tion of ruminants. In :The Ruminant Animal : Digestive Physiology and Nutrition(Ed. D. C. Church), pp. 269–297. Englewood Cliffs, NJ : Prentice-Hall.
K, P. M. & M, L. P. (1978). Effects of cold exposure on digestion, microbial synthesis and nitrogen transformations in sheep.British Journal of Nutrition39, 105–117.
L, D. R. (1984). A system for the measurement in the field of losses of ammonia through volatilisation.
Journal of the Science of Food and Agriculture 35, 837–848.
L, D. R. (1997). Methane emissions from grazing sheep and calves.Agriculture,Ecosystems and Environment
66, 11–18.
L, D. R. & J, S. C. (1995). The measurement of
research. The daily patterns displayed under different feeding regimes are also of some interest and consequence. The large flux when animals were fed at set times is perhaps indicative of a physical dis-placement of CH
% already generated. The con-sequences of this for overall emissions are not known.
The differences in CH
%production from the two systems have implications for estimates of global CH
%emissions, in that, if the tunnels more accurately reflect field conditions than do chambers, measure-ments from the latter are likely to result in an overestimate of global methanogenesis from rumi-nants most of which spend only small periods of their time indoors. Chamber-based estimates may be more appropriate for animals which are housed for signi-ficant periods.
This work was funded by the Ministry of Agri-culture, Fisheries and Food, London. The Institute of Grassland and Environmental Research is supported by the Biotechnology and Biological Sciences Re-search Council. We are grateful to Dr A. J. Rook for statistical advice.
methane losses from grazing animals. Environmental Pollution90, 383–390.
MC, J. A. & T, G. (1987).Animal and Human Calorimetry. Cambridge : Cambridge University Press. M, A. R. (1993). Methane : Global Warming and
Pro-duction by Animals.Canterbury : Chalcombe Publications. R, H. (1990). A comparison of the contributions of various gases to the greenhouse effect. Science 248, 1217–1219.
R, A. (1960). The effect of environmental tem-perature on the energy metabolism of cattle.Journal of Agricultural Science,Cambridge 55, 359–366.
R, A. J., D, M. S. & G, M. (1990). Prediction of the voluntary intake of grass silages by beef cattle. 3. Precision of alternative prediction models.Animal Pro
-duction50, 455–466.
S, R. W., P, V. R., D, T. G. M., B, L. R., S, J. L. & W, S. K. (1997). Long-term measurements of greenhouse gas emissions from U. K. livestock buildings. InProceedings of the Fifth International Livestock Environment Symposium, Vol.
I (Eds R. W. Bottcher & S. J. Hoff), pp. 146–153. Minneapolis-St Paul : A.S.A.E.
S, P., D, E. J., L, P. M., T, P. P., M, R. C. & M, K. A. (1992). Slowing down of the global accumulation of atmospheric methane during the 1980’s.Nature358, 313–316.
K, G. E. M. & M, G. W. (1993). The effect of ruminal escape protein and ambient temperature on the efficiency of utilization of metab-olisable energy by lambs.Journal of Animal Science71, 2206–2217.