Open Access
Research article
A functional profile of gene expression in ARPE-19 cells
Rajesh K Sharma, William E Orr, Allyson D Schmitt and Dianna A Johnson*
Address: Department of Ophthalmology and Hamilton Eye Institute, University of Tennessee Health Science Center, 930 Madison Ave, Memphis, TN 38163, USA
Email: Rajesh K Sharma - [email protected]; William E Orr - [email protected]; Allyson D Schmitt - [email protected]; Dianna A Johnson* - [email protected]
* Corresponding author
Abstract
Background: Retinal pigment epithelium cells play an important role in the pathogenesis of age related macular degeneration. Their morphological, molecular and functional phenotype changes in response to various stresses. Functional profiling of genes can provide useful information about the physiological state of cells and how this state changes in response to disease or treatment. In this study, we have constructed a functional profile of the genes expressed by the ARPE-19 cell line of retinal pigment epithelium.
Methods: Using Affymetrix MAS 5.0 microarray analysis, genes expressed by ARPE-19 cells were identified. Using GeneChip® annotations, these genes were classified according to their known
functions to generate a functional gene expression profile.
Results: We have determined that of approximately 19,044 unique gene sequences represented on the HG-U133A GeneChip® , 6,438 were expressed in ARPE-19 cells irrespective of the
substrate on which they were grown (plastic, fibronectin, collagen, or Matrigel). Rather than focus our subsequent analysis on the identity or level of expression of each individual gene in this large data set, we examined the number of genes expressed within 130 functional categories. These categories were selected from a library of HG-U133A GeneChip® annotations linked to the
Affymetrix MAS 5.0 data sets. Using this functional classification scheme, we were able to categorize about 70% of the expressed genes and condense the original data set of over 6,000 data points into a format with 130 data points. The resulting ARPE-19 Functional Gene Expression Profile is displayed as a percentage of ARPE-19-expressed genes.
Conclusion: The Profile can readily be compared with equivalent microarray data from other appropriate samples in order to highlight cell-specific attributes or treatment-induced changes in gene expression. The usefulness of these analyses is based on the assumption that the numbers of genes expressed within a functional category provide an indicator of the overall level of activity within that particular functional pathway.
Background
The retinal pigment epithelium (RPE) is a monolayer of hexagonal cells separating the neural retina from the
underlying choroidal vascular bed. RPE cells are essential for development, survival, and physiological activity of photoreceptor cells [1,2]. RPE cells provide the molecular
Published: 01 November 2005
BMC Ophthalmology 2005, 5:25 doi:10.1186/1471-2415-5-25
Received: 21 January 2005 Accepted: 01 November 2005
This article is available from: http://www.biomedcentral.com/1471-2415/5/25 © 2005 Sharma et al; licensee BioMed Central Ltd.
machinery for recycling the inactive form of the photoi-somerized visual pigment back to the active isomer for subsequent formation of rhodopsin [3]. RPE phagocytizes spent photoreceptor outer segments; provides nutrients to, and removes metabolic waste from, the photorecep-tors; contributes to retinal adhesion and maintenance of the blood-retinal barrier; and absorbs light and dissipates heat energy derived from incident light [4,5]. Recent evi-dence shows that RPE cells also participate in the immu-nologic functions in the retina. RPE cells can express major histocompatibility complex (MHC) class I and II antigens and the intercellular adhesion molecule-1 (ICAM-1). These cells process and present the antigen to helper T cells [6-9]. RPE responds to proinflammatory cytokines and secretes IL-6, IL-8, and monocyte chemotac-tic protein [10-14]. Through these mechanisms RPE cells play a key role in inflammatory, infectious, and degenera-tive diseases of the retina. Impairment of RPE functions have been implicated in a number of hereditary retinal degenerations [15-18], and more importantly in the pathogenesis of age-related macular degeneration (AMD), one of the most prevalent causes of visual impairment in elderly [19]. Given the importance of RPE cells in the nor-mal physiology and disease of retina, RPE has become the subject of intense investigation especially those elucidat-ing the role of RPE cells in the molecular mechanisms of AMD. Transplantation of normal as well as genetically modified RPE cells is being envisaged as a possible treat-ment of retinal degenerations [20,21]. Given the pivotal role of RPE in retinal development, physiology and dis-eases it is important to investigate the gene expression profile of these cells, which will than lay the foundation for further molecular characterization of RPE cells in both normal and diseased states.
DNA microarray technology provides a view of the expres-sion profiles of a cell sample that encompasses virtually the entire genome. Microarray technology has a number of distinct applications including DNA sequencing, muta-tion analysis, gene discovery, and gene expression analysis [22-26]. Microarray technology allows a rapid quantita-tive measurement of gene expression within a tissue sam-ple, as defined by messenger RNA (mRNA) abundance. The opportunity to quantitate gene expression on a genome-wide scale has added a new dimension to our understanding of many biologic and disease processes. However, analysis of large data sets derived from microar-ray analysis can be problematic. It is an overwhelming task to consider the expression levels of each of the twenty or so thousand known genes individually. An alternative strategy is to group individual genes into functional cate-gories in order to generate what has been termed a "func-tional gene profile". Different types of analyses can then be applied to gene profiles. For example, functional cate-gories of genes displaying the highest levels of expression
can be identified and thus provide a means for focusing on groups of functionally related genes that may be highly expressed by a specific cell type or physiological state. "Cluster analysis" is another more complex type of gene profile analysis in which significant changes in gene expression due to some experimental variable are mapped with respect to functional categories.
be likely to be expressed under most experimental condi-tions. The advantages and disadvantages related to this overall analysis strategy are reviewed in the Discussion section.
Methods
RPE culture
ARPE-19 cells were used in the experiments. These are dip-loid non-transformed human RPE cells that display many properties typical of differentiated RPE in vivo [28]. ARPE-19 cells were obtained from a commercial source (ATCC, Manassas, VA). The cells were plated on 75-cm2 flasks at a density of 10,000 cells/cm2 and maintained in culture until the plates became >95% confluent. Cultures were fed three times a week with Dulbecco's modified Eagle's medium-nutrient mixture F-12 (DMEM-F-12; GIBCO, Invitrogen Corporation, Grand Island, NY) supplemented with 10% fetal bovine serum, 100 U/mL penicillin, and 100 µg/mL streptomycin. Cultures were passaged by dis-sociation in 0.05% (wt/vol) trypsin. For the microarray experiments, cells belonging to passage 4 were used 24 hrs. after removing serum from the medium in order to further synchronize the metabolic and physiological state of cells.
Substrate-dependent genes
Our overall goal in these experiments was to generate a functional catalogue of "core" ARPE-19 genes. To achieve that goal, we sought to avoid genes that might be highly sensitive to exact culturing conditions, such as the choice of substrate. While substrate-sensitive genes are likely to be very important to the cell, as a group they may con-found our results. Since there is no uniformly accepted substrate for APRE-19 culture, we reasoned that a cata-logue of genes that were expressed regardless of substrate would provide the best standard. Cells were grown on four commonly used substrates: fibronectin, Matrigel, col-lagen, and uncoated plastic. Each sample was run on a separate chip and analyzed as described below. Any genes not expressed on all four substrates were identified as "substrate-specific genes" and were removed from further analysis. Data from the remaining substrate-independent genes were considered as n = 4 (In other words, since we only included genes uniformly expression in all four sam-ples, there is no variation in the gene expression profile among the n = 4). Variability in expression levels of sub-strate-independent genes among these four chips was rel-atively low (see Results) suggesting that overall variability due to technical factors was low.
Microarray methods
The RNA isolation procedures for the Affymetrix analysis were conducted using TRIzol Reagent (GIBCO, Carlsbad, CA) according to the manufacturer's instructions. Ini-tially, the quality of total RNA was assessed by
electro-phoresis through a 1% agarose gel, then the Agilent Bioanalyzer System (Agilent Technologies, Palo Alto, CA) immediately prior to cRNA synthesis. The procedures for the Affymetrix gene chips, beginning with first strand cDNA synthesis, were conducted by Genome Explorations (Memphis, Tennessee). The Human Genome U133A GeneChip® contains 22,283 probe sets together with expressed sequence tag (EST) sequences. The RNA (iso-lated using TRIzol) was run over of a G50 spin column. First and second strand cDNA were synthesized from 15
µg of total RNA using the SuperScript Double-Stranded cDNA Synthesis Kit (GIBCO, Carlsbad, CA) and oligo-dT24-T7 (5'-GGC CAG TGA ATT GTA ATA CGA CTC ACT ATA GGG AGG CGG-3') primer according to the manu-facturer's instructions. cRNA was synthesized and labeled with biotinylated UTP and CTP by in vitro transcription using the T7 promoter coupled double stranded cDNA as template and the T7 RNA Transcript Labeling Kit (ENZO Diagnostics Inc. Farmingdale NY). The fragmented cRNA was hybridized to the olygonucleotide array, washed, stained with phycoerythrein conjugated streptavidin (Molecular Probes, Eugene OR), and scanned. Intensities were determined using a laser confocal scanner (Hewlett-Packard; Palo Alto, CA).
The scanned images were analyzed using Microarray Suite Version 5.0 (MAS 5.0, Affymetrix, Inc., Santa Clara, CA). The MAS 5.0 statistical algorithms calculate signal inten-sity, probe set detection, probe set (gene expression) change, and signal log ratio. The signal intensity for each gene was calculated as the average intensity difference, represented by [S(PM – MM)/(number of probe pairs)], where PM and MM denote perfect-match and mismatch probes.
The analysis applied a decision matrix based on the hybridization behavior of all 11 probe pairs per probe set. These matrices are used to determine if the gene is expressed above a threshold level (i.e., called Present by Absolute Call decision matrix). Investigators can change the specificity and sensitivity criteria for the present call by changing the alpha-1 value in the MAS 5.0 software. We used a value of 0.05 as a standard and 0.07 or 0.18 for less restrictive present calls.
Functional categories of genes represented on the HG-U133A GeneChip174 and expressed by ARPE-19 cells
Figure 1
Functional categories of genes represented on the HG-U133A GeneChip174 and expressed by ARPE-19 cells. A total 130 functional categories are displayed on the abscissa. These are arranged alphabetically in groups under 15 large func-tional subheadings indicated on the right and separated by dashed lines. The numbers of genes represented and expressed were converted into percentages indicated on the ordinate. The formulae used for calculating percentages were different for each color-coded bar. Yellow bar = total number of genes expressed by ARPE-19 within the functional category/total number of genes expressed in all categories. The heights of the yellow bars may reflect the relative importance of a given function in ARPE-19 cells. Red bar = total number of genes expressed within the functional category/total number of genes represented on the HG-U133A GeneChip174 in all categories. Blue bar = total number of genes represented within the functional category/
Functional categories of genes represented on the HG-U133A GeneChip174 and expressed by ARPE-19 cells
Figure 2
Functional categories of genes represented on the HG-U133A GeneChip174 and expressed by ARPE-19 cells. A total 130 functional categories are displayed on the abscissa. These are arranged alphabetically in groups under 15 large func-tional subheadings indicated on the right and separated by dashed lines. The numbers of genes represented and expressed were converted into percentages indicated on the ordinate. The formulae used for calculating percentages were different for each color-coded bar. Yellow bar = total number of genes expressed by ARPE-19 within the functional category/total number of genes expressed in all categories. The heights of the yellow bars may reflect the relative importance of a given function in ARPE-19 cells. Red bar = total number of genes expressed within the functional category/total number of genes represented on the HG-U133A GeneChip174 in all categories. Blue bar = total number of genes represented within the functional category/
replicate probe sets for the same gene were omitted from further analysis. This choice of method was somewhat arbitrary, but it had the advantage of being based strictly on a statistical criterion and it should not introduce any bias in the data since all probe sets, all genes, and all chips were treated the same. The coefficient of variation data was not used for any subsequent steps in the analysis. The resulting database, free of redundant probes for any given gene, was used for determining the number of genes expressed within functional categories.
Functional categories were established for classification of the majority of genes represented on the HG-U133A GeneChip® , including those expressed by ARPE-19 cells. (See Results for additional details.) HG-U133A Gene-Chip® annotations were downloaded from Affymetrix. Using FileMaker Pro 5.5 (FileMaker, Inc., Santa Clara, CA), the following annotations were used to create a HG-U133A GeneChip® Library: Probe Set ID, Title, Unigene ID, Sequence Derived from, Sequence Description, Archi-val Reference Group, Gene Symbol, GO Biological Proc-ess, GO Molecular Function, Proteome Biochemical Function, Proteome Cellular Role, Interpro ID and Classi-fication, Ortholog-Homolog, and Pathways. Relational databases were created by linking the HG-U133A Gene-Chip® Library to the four data sets provided by the Affyme-trix MAS 5.0 analysis. Search terms (i.e. keywords) were used to extract the probe sets for each functional category. The resulting classification scheme consisted of 130 func-tional categories that could be grouped under 15 major subheadings. Many of the genes could be classified in more than one category. Genes were included in all the categories in which they were classifiable. Additional liter-ature searches were used to clarify ambiguities. In order to determine whether the relative number of genes expressed by ARPE-19 cells within a particular functional category was significantly different from that predicted based on numbers represented on the chip, we performed a z-test
Results
Numbers of genes expressed
The Affymetrix HG-U133A GeneChip® contains 22,283 probe sets representing 19,044 distinct genes, of which 6,438 genes were called as present in all four samples of ARPE-19 cells with an alpha-1 value of 0.05. When present calls were made with a less restrictive sensitivity and specificity criterion (alpha-1 value was changed to 0.18), 8,671 genes were called present.
Establishment of functional categories
In order to establish a functional profile of genes, each of the 19,044 distinct genes represented on the HG-U133A GeneChip® was assigned a functional classification using Affymetrix software search programs. By a process of trial and error, these individual functional classifications were
organized into a limited number of function-related cate-gories. Our goal was to establish a classification scheme that would include as many genes as possible within a "reasonable" number of functional categories. By this process, we were able to select 130 functional categories that accounted for 66.48% of the genes printed on the HG-U133A GeneChip® and 70.94% of the genes expressed by ARPE-19 cells. These categories are listed on the abscissa of Figure 1 and 2, arranged under 15 major functional subheadings. Most of the genes could be classi-fied in more than one category. Genes were counted in each functional category they were associated with, which resulted in multiple listings of most genes. Roughly 33% of the genes printed on the HG-U133A GeneChip® and 29% of the genes expressed by ARPE-19 cells could not be classified in functional categories because the probes rep-resented genes with unknown products or unknown func-tions. In addition, certain functional categories represented by very small numbers of genes were also placed under the category of unclassified for practical rea-sons.
A functional profile of gene expression
Rather than display the data as absolute numbers of genes in each functional category, we chose to represent each number as a percentage. Results are shown in Figure 1 and 2, using percentages calculated from the formulae listed below.
The blue bars = the number of genes in a given category that are represented on the HG-U133A GeneChip®/the total number of genes represented on the HG-U133A Gene-Chip® .
The red bars = the number of genes in a given category that are expressed by ARPE-19/the total number of genes rep-resented on the HG-U133A GeneChip® .
Results show that the functional profile of the genes expressed by ARPE-19 was significantly different from the functional profile of genes represented on the HG-U133A GeneChip® . Overall, ARPE-19 expressed 33.8% of the rep-resented genes. However, the percentage of genes expressed in each functional category varied considerably from that norm. Based on a z-test analysis, a total of 60 of the 130 functional categories contained significantly more or significantly less than the predicted number of expressed genes (See Fig. 1 and 2).
functional groups in both lists: Receptors, Signal Trans-duction, Metabolism, and Transport. In spite of this over-all similarity, these two lists differ in several important aspects. 1) Genes related to Metabolism and to Signal Transduction-associated Metabolism were among the most numerously expressed by ARPE-19, whereas these genes were not among the most numerously represented on the chip. The reverse was true for genes related to Tran-scription Factors. 2) Of particular interest were several cases in which ARPE-19 expressed approximately 50% or more of the genes represented on the HG-U133A Gene-Chip® . (See Fig. 1 and 2.) This occurred in functional cat-egories that were large (i.e., Binding Protein, Hydrolase, and Metabolism), as well as those that were small (i.e., Ribosomal Proteins and Protein Synthesis). Based on these data, we conclude that the ARPE-19 Functional Gene Expression Profile does reflect characteristics of the ARPE-19 cell type and that it is not simply a reflection of the functional groups of probe sets represented on the HG-U133A GeneChip® .
We completed an additional calculation in which the Functional Gene Expression Profile was expressed as a dif-ferent type of percentage also shown in Fig. 1 and 2, using the formula below:
Yellow bars = the number of genes within a given functional category that are expressed by ARPE-19/Total number of genes expressed.
This calculation is comparable to that used in constructing a standard "pie chart," which has been routinely used by other investigators to display the function of genes expressed in a given cell type. Inclusion of 130 functional categories used in our analysis adds considerably more detail than could be contained on a normal pie chart
for-mat and thus cannot be presented as such. However, the bar graph presentation does allow an expanded overview of virtually all known genes within a reasonably simple format. Results show that several functional categories of genes account for a large portion of the total number of genes expressed.
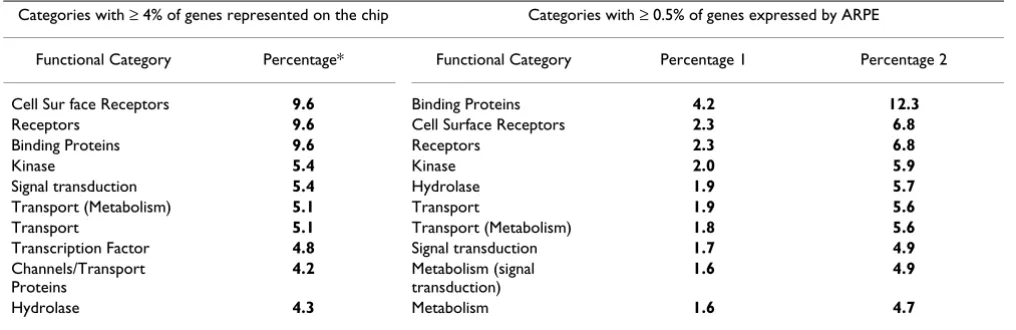
In the three largest functional categories (Binding Protein, Cell Surface Receptors, and Receptors), the number of genes expressed accounted for approximately 32% of the total number of genes expressed. It must be kept in mind that our classification scheme includes most genes in more than one category and that there is likely to be con-siderable overlap among these three categories. Thus, the actual number of distinct genes in this functional group-ing could be as low as 10%. Even so, this represents a major functional class of genes expressed by ARPE-19.
In each of eight large categories, the number of genes expressed accounted for approximately 5% of the total number expressed. These latter categories represent genes associated with cell signaling, transport, gene/protein expression, and energy metabolism.
Effect of specificity/sensitivity parameters and substrate on gene classification
In order to determine the degree to which specificity and sensitivity parameters influence the analysis and func-tional categorization of the expressed genes, we altered the alpha-1 value in the Microarray Suit 5.0 so that the present calls were less specific but more sensitive, i.e., less restrictive. When the alpha-1 value was changed from 0.05 to 0.075 only 570 additional genes were called present, suggesting that our data were not overly influ-enced by the sensitivity parameters originally selected. To increase the number of present calls by approximately
Table 1: Functional Categories that Contain the Largest Percentages of Genes
Categories with ≥ 4% of genes represented on the chip Categories with ≥ 0.5% of genes expressed by ARPE
Functional Category Percentage* Functional Category Percentage 1 Percentage 2
Cell Sur face Receptors 9.6 Binding Proteins 4.2 12.3
Receptors 9.6 Cell Surface Receptors 2.3 6.8
Binding Proteins 9.6 Receptors 2.3 6.8
Kinase 5.4 Kinase 2.0 5.9
Signal transduction 5.4 Hydrolase 1.9 5.7
Transport (Metabolism) 5.1 Transport 1.9 5.6
Transport 5.1 Transport (Metabolism) 1.8 5.6
Transcription Factor 4.8 Signal transduction 1.7 4.9
Channels/Transport Proteins
4.2 Metabolism (signal transduction)
1.6 4.9
Hydrolase 4.3 Metabolism 1.6 4.7
30% required setting the alpha-1 value as high as 0.18. With this alpha-1 value, 8671 genes were called present in all four samples.
To determine the degree to which our results were influ-enced by variations in genes expressed by samples from the four different culture substrates used, we compared the number of genes expressed in all four samples with the number of genes expressed in at least one of the samples. Results show that 6438 genes were called present in all samples and that 9749 genes were called present in at least one sample. This suggests that substrate may have signifi-cant effects on gene expression.
Discussion
Mapping of chromosomal positions and genomic organi-zation of human genes has elucidated the chemical back-ground of the genome [29], linking specific genes to various human diseases. However, to understand the pathophysiological mechanisms, it is prudent to resort to functional genomics approaches [30,31]. Identifying the genes expressed in a particular tissue and profiling their function, as we have done in this study for a widely used human retinal pigment epithelium cell line, lays the foun-dations for such understanding.
An additional objective was to focus primarily on the genes likely to be consistently expressed even under vary-ing culture conditions, specifically when different sub-strates were used. By including only substrate-independent genes, the Profile may be more widely appli-cable to labs using different culture conditions and sub-strates. There is no standard substrate that is uniformly accepted by ARPE-19 researchers; several are in common usage (plastic, collagen, Matrigel, and fibronectin). Our aim was to include genes that are expressed by the ARPE-19 cells irrespective of the substrate. We cultured four samples for microarray analysis, each on one of these four substrates and then eliminated from our analysis any genes that were not uniformly expressed by all four sam-ples. Theoretically then, our analysis should be independ-ent of specific substrate effects. It should be kept in mind, however, that substrate-specific effects may play an important role in RPE cells. In vivo, RPE cells grow in a penta-lamellar structure called Bruch's membrane that is thought to play an important role in the health and dis-ease of RPE cells [1]. Changes in the Bruch's membrane have been implicated in the pathogenesis of age-related macular degeneration where RPE also plays an important role. It has been shown that attachment of RPE cells to the basement membrane is essential for its survival. All these facts imply that the nature of basement membrane affects the gene expression in RPE cells. These genes may not be included in our database of 6,438 genes called present in all four samples. For comparison, we calculated that 9,749
genes were expressed by at least one of the four samples. This suggests that up to 3,311 genes could be substrate specific. Additional experiments would be required in order to confirm this suggestion and to the identity genes that are specifically expressed in response to a given sub-strate.
It is estimated that a typical mammalian cell expresses about 10,000 to 20,000 mRNA species and in diseased conditions between 0.2–10% of this may be differentially expressed. Considering that approximately half of the human genome is represented on the HG-U133A Gene-Chip® , the detection of 6,438 genes falls within the expected range. It is also estimated that approximately 10–20% of the entire genome is expressed in any cell type. Our study gave a slightly higher value, with 33.8% of the genes expressed in the ARPE-19 cells. This might reflect the fact that we examined only genes that encode for pro-teins whose identity and function are known. This group includes many of the common housekeeping genes that are expected to be expressed in most cells, and thus might have a higher probability for detection in our analysis. The group of unidentified genes not included in our analysis may more likely include rare genes that would not be expected to be as widely expressed.
was to facilitate analysis of a large microarray data set. The major contribution that our work provides in this regard is the development of a classification scheme of limited size, which includes virtually all ARPE-19 expressed genes whose functions are known. The classification scheme was constructed using Affymetrix search terms (i.e., key words) that appear in the HG-U133A GeneChip® annota-tions, which provide a readily accessible, standard vocab-ulary for the uniform classification of gene expression data sets by other investigators. These GeneChip® annota-tions are updated quarterly by Affymetrix. They can be eas-ily downloaded and used to create or update GeneChip® libraries and searchable relational databases.
The Profile is essentially an expanded pie chart, that con-tains more information than can feasibly be presented in a standard pie chart format. Nevertheless, it can be dis-played in a reasonably sized bar graph with 130 data points. By representing expression results as a percentage of the total number of expressed genes, direct compari-sons of expression information (albeit in compressed form) can be made for virtually all functionally identified genes across cell types, treatments, physiological states, etc. Recently, somewhat similar approaches have been used to make data mining SoftWear tools (EASE) that allow comparisons of gene lists and search for gene cate-gories over represented in a sample.
If the Function Gene Expression Profile is to be a useful as a genetic blueprint for cell types or functional states, it must be sensitive enough to reflect substantive differences in gene expression that are unique for those specific cell types or physiological sates. Experiments are underway to prepare Profiles of appropriate data sets from other cell types and to carry out comparative analyses. From these comparisons, we will determine the degree to which Pro-files differ, and more importantly, if these differences can provide the basis for identification of genes and func-tional pathways that are of particular relevance to the cell or physiological state in question. Our current results do show a significant difference in the profile of genes expressed by ARPE-19 compared to the profile of the genes represented on the HG-U133A GeneChip® . Thus, we have one comparison that shows unique aspects of ARPE-19 gene expression compared to all genes expressed by all cells. Even in the absence of further comparative data, the Profile provides a useful gene expression snap-shot of a confluent monolayer of ARPE-19 cells. The high-est percentages of genes expressed were in categories that could be related to specialized RPE functions (receptors and binding proteins) and those that may be related to housekeeping genes (energy metabolism, transport, and gene/protein expression). The quiescent state of the cul-ture is consistent with low percentages of genes expressed
in functional categories that include cell division, cell growth, and cell structure/mobility.
Conclusion
We present a system of profiling the expressed genes based on their functions. The Profile can be compared with equivalent microarray data from other appropriate sam-ples in order to highlight cell-specific attributes or treat-ment-induced changes in gene expression. The usefulness of these analyses is based on the assumption that the numbers of genes expressed within a functional category provide an indicator of the overall level of activity within that particular functional pathway.
Competing interests
The author(s) declare that they have no competing inter-ests
Acknowledgements
This work was supported by grant from NEI (EY13080 to D.J.), Research to Prevent Blindness, International Retina Research Foundation, and the UT Memphis Neuroscience Center. The authors wish to thank Dr. Peter A. Netland for support, and Danny Morse for his assistance in preparing Fig-ures.
References
1. Sharma RK, Ehinger B: Development and Structure of the Retina. In
Adler's Physiology of the Eye: Clinical Application Edited by: Kaufman PL, Alm A. St. Louis: Mosby; 2003:319-347.
2. Sharma RK, Johnson DA: Molecular signals for development of neuronal circuitry in the retina. Neurochem Res 2000,
25:1257-1263.
3. Wald G: Molecular basis of visual excitation. Science 1968,
162:230-239.
4. Bok D: The retinal pigment epithelium: a versatile partner in vision. J Cell Sci Suppl 1993, 17:189-195.
5. Bok D: Retinal photoreceptor-pigment epithelium interac-tions. Friedenwald lecture. Invest Ophthalmol Vis Sci 1985,
26:1659-1694.
6. Dhawan J, Lichtler AC, Rowe DW, Farmer SR: Cell adhesion reg-ulates pro-alpha 1(I) collagen mRNA stability and transcrip-tion in mouse fibroblasts. J Biol Chem 1991, 266:8470-8475. 7. Schwogler S, Odenthal M, Meyer zum Buschenfelde KH, Ramadori G:
Alternative splicing products of the tenascin gene distinguish rat liver fat storing cells from arterial smooth muscle cells and skin fibroblasts. Biochem Biophys Res Commun 1992,
185:768-775.
8. Tucker RP, Hammarback JA, Jenrath DA, Mackie EJ, Xu Y: Tenascin expression in the mouse: in situ localization and induction in vitro by bFGF. J Cell Sci 1993, 104(Pt 1):69-76.
9. LaFleur DW, Fagin JA, Forrester JS, Rubin SA, Sharifi BG: Cloning and characterization of alternatively spliced isoforms of rat tenascin. Platelet-derived growth factor-BB markedly stim-ulates expression of spliced variants of tenascin mRNA in arterial smooth muscle cells. J Biol Chem 1994,
269:20757-20763.
10. Elner VM, Scales W, Elner SG, Danforth J, Kunkel SL, Strieter RM:
Interleukin-6 (IL-6) gene expression and secretion by cytokine-stimulated human retinal pigment epithelial cells.
Exp Eye Res 1992, 54:361-368.
11. Elner VM, Strieter RM, Elner SG, Baggiolini M, Lindley I, Kunkel SL:
Neutrophil chemotactic factor (IL-8) gene expression by cytokine- treated retinal pigment epithelial cells. Am J Pathol
1990, 136:745-750.
Publish with BioMed Central and every scientist can read your work free of charge "BioMed Central will be the most significant development for disseminating the results of biomedical researc h in our lifetime."
Sir Paul Nurse, Cancer Research UK
Your research papers will be:
available free of charge to the entire biomedical community
peer reviewed and published immediately upon acceptance
cited in PubMed and archived on PubMed Central
yours — you keep the copyright
Submit your manuscript here:
http://www.biomedcentral.com/info/publishing_adv.asp
BioMedcentral
cytokine-treated human retinal pigment epithelial cells. Lab Invest 1991, 64:819-825.
13. Jaffe GJ, Roberts WL, Wong HL, Yurochko AD, Cianciolo GJ: Mono-cyte-induced cytokine expression in cultured human retinal pigment epithelial cells. Exp Eye Res 1995, 60:533-543. 14. Nagineni CN, Detrick B, Hooks JJ: Synergistic effects of gamma
interferon on inflammatory mediators that induce inter-leukin-6 gene expression and secretion by human retinal pig-ment epithelial cells. Clin Diagn Lab Immunol 1994, 1:569-577. 15. Bok D, Hall MO: The role of the pigment epithelium in the
eti-ology of inherited retinal dystrophy in the rat. J Cell Biol 1971,
49:664-682.
16. Mullen RJ, La Vail MM: Inherited retinal dystrophy: primary defect in pigment epithelium determined with experimental rat chimeras. Science 1976, 192:799-801.
17. Marlhens F, Bareil C, Griffoin JM, Zrenner E, Amalric P, Eliaou C, et al.: Mutations in RPE65 cause Leber's congenital amaurosis.
Nat Genet 1997, 17:139-141.
18. Gu SM, Thompson DA, Srikumari CR, Lorenz B, Finckh U, Nicoletti A, Murthy KR, Rathmann M, Kumaramanickavel G, Denton MJ, Gal A:
Mutations in RPE65 cause autosomal recessive childhood-onset severe retinal dystrophy. Nat Genet 1997, 17:194-197. 19. Sarks SH: Ageing and degeneration in the macular region: a
clinico-pathological study. Br J Ophthalmol 1976, 60:324-341. 20. Sharma RK, Ehinger B: Management of hereditary retinal
degenerations: present status and future directions. Surv Oph-thalmol 1999, 43:427-444.
21. Sharma RK, Bergström A, Ehinger B: Retinal cell transplants. Prog Retinal Eye Res 1995, 15:197-230.
22. Lander ES: Array of hope. Nat Genet 1999, 21:3-4.
23. Brown PO, Botstein D: Exploring the new world of the genome with DNA microarrays. Nat Genet 1999, 21:33-37.
24. Hacia JG: Resequencing and mutational analysis using oligonu-cleotide microarrays. Nat Genet 1999, 21:42-47.
25. Lipshutz RJ, Fodor SP, Gingeras TR, Lockhart DJ: High density syn-thetic oligonucleotide arrays. Nat Genet 1999, 21:20-24. 26. Shoemaker DD, Schadt EE, Armour CD, He YD, Garrett-Engele P,
McDonagh PD, Loerch PM, Leonardson A, Lum PY, Cavet G, Wu LF, Altschuler SJ, Edwards S, King J, Tsang JS, Schimmack G, Schelter JM, Koch J, Ziman M, Marton MJ, Li B, Cundiff P, Ward T, Castle J, Krolewski M, Meyer MR, Mao M, Burchard J, Kidd MJ, Dai H, Phillips JW, Linsley PS, Stoughton R, Scherer S, Boguski MS: Experimental annotation of the human genome using microarray technol-ogy. Nature 2001, 409:922-927.
27. Chowers I, Kim Y, Farkas RH, Gunatilaka TL, Hackam AS, Campochi-aro PA, Finnemann SC, Zack DJ: Changes in retinal pigment epi-thelial gene expression induced by rod outer segment uptake. Invest Ophthalmol Vis Sci 2004, 45:2098-2106.
28. Dunn KC, Aotaki-Keen AE, Putkey FR, Hjelmeland LM: ARPE-19, a human retinal pigment epithelial cell line with differentiated properties. Exp Eye Res 1996, 62:155-169.
29. Venter JC, Adams MD, Myers EW, Li PW, Mural RJ, Sutton GG, Smith HO, Yandell M, Evans CA, Holt RA, Gocayne JD, Amanatides P, Ballew RM, Huson DH, Wortman JR, Zhang Q, Kodira CD, Zheng XH, Chen L, Skupski M, Subramanian G, Thomas PD, Zhang J, Gabor Miklos GL, Nelson C, Broder S, Clark AG, Nadeau J, McKusick VA, Zinder N, Levine AJ, Roberts RJ, Simon M, Slayman C, Hunkapiller M, Bolanos R, Delcher A, Dew I, Fasulo D, Flanigan M, Florea L, Halpern A, Hannenhalli S, Kravitz S, Levy S, Mobarry C, Reinert K, Remington K, Abu-Threideh J, Beasley E, Biddick K, Bonazzi V, Brandon R, Cargill M, Chandramouliswaran I, Charlab R, Chaturvedi K, Deng Z, Di FV, Dunn P, Eilbeck K, Evangelista C, Gabrielian AE, Gan W, Ge W, Gong F, Gu Z, Guan P, Heiman TJ, Higgins ME, Ji RR, Ke Z, Ketchum KA, Lai Z, Lei Y, Li Z, Li J, Liang Y, Lin X, Lu F, Merkulov GV, Milshina N, Moore HM, Naik AK, Narayan VA, Neelam B, Nusskern D, Rusch DB, Salzberg S, Shao W, Shue B, Sun J, Wang Z, Wang A, Wang X, Wang J, Wei M, Wides R, Xiao C, Yan C, Yao A, Ye J, Zhan M, Zhang W, Zhang H, Zhao Q, Zheng L, Zhong F, Zhong , Zhu S, Zhao S, Gil-bert D, Baumhueter S, Spier G, Carter C, Cravchik A, Woodage T, Ali F, An H, Awe A, Baldwin D, Baden H, Barnstead M, Barrow I, Bee-son K, Busam D, Carver A, Center A, Cheng ML, Curry L, Danaher S, Davenport L, Desilets R, Dietz S, Dodson K, Doup L, Ferriera S, Garg N, Gluecksmann A, Hart B, Haynes J, Haynes C, Heiner C, Hla-dun S, Hostin D, Houck J, Howland T, Ibegwam C, Johnson J, Kalush F, Kline L, Koduru S, Love A, Mann F, May D, McCawley S, McIntosh T, McMullen I, Moy M, Moy L, Murphy B, Nelson K, Pfannkoch C,
Pratts E, Puri V, Qureshi H, Reardon M, Rodriguez R, Rogers YH, Romblad D, Ruhfel B, Scott R, Sitter C, Smallwood M, Stewart E, Strong R, Suh E, Thomas R, Tint NN, Tse S, Vech C, Wang G, Wetter J, Williams S, Williams M, Windsor S, Winn-Deen E, Wolfe K, Zaveri J, Zaveri K, Abril JF, Guigo R, Campbell MJ, Sjolander KV, Karlak B, Kejariwal A, Mi H, Lazareva B, Hatton T, Narechania A, Diemer K, Muruganujan A, Guo N, Sato S, Bafna V, Istrail S, Lippert R, Schwartz R, Walenz B, Yooseph S, Allen D, Basu A, Baxendale J, Blick L, Cam-inha M, Carnes-Stine J, Caulk P, Chiang YH, Coyne M, Dahlke C, Mays A, Dombroski M, Donnelly M, Ely D, Esparham S, Fosler C, Gire H, Glanowski S, Glasser K, Glodek A, Gorokhov M, Graham K, Grop-man B, Harris M, Heil J, Henderson S, Hoover J, Jennings D, Jordan C, Jordan J, Kasha J, Kagan L, Kraft C, Levitsky A, Lewis M, Liu X, Lopez J, Ma D, Majoros W, McDaniel J, Murphy S, Newman M, Nguyen T, Nguyen N, Nodell M: The sequence of the human genome. Sci-ence 2001, 291:1304-1351.
30. Fields S: The future is function. Nat Genet 1997, 15:325-327. 31. Lander ES: The new genomics: global views of biology. Science
1996, 274:536-539.
Pre-publication history
The pre-publication history for this paper can be accessed here: