Multitest Screening 1n Hematology*
CHARLES
L. JOHNSTON JR., M.D.
Professor of Clinical Pathology, Medical College of Virginia,
Health Sciences Division of Virginia Commonwealth University, Richmond
The concept of multitest screening for hemato-logical disorders is not necessarily a new one. Imple-mentation of such ideas has recently become possible, for the automated electronic instruments perform-ing sequential multiple analyses within very short periods of time are a very significant advancement
in the technology of the hematology laboratory. It must be emphasized, however, that the value of such instrumentation lies not only in the rapidity, but also
in the accuracy and precision as well as the number and nature of the tests performed. While the data on samples have been reported on individual patients three and a half years in our hematology laboratory, it is only within the past few months that examples of its utilization for screening studies have begun to appear in the literature (1, 3, 5).
Several automated instruments are available
that perform the routine counting and sizing of cells in the blood. The Coulter model "S" is the one most widely used ( 2) . This is the instrument we use and it is the one used in the studies to be cited here. It is an instrument that reports on seven parameters, measuring the WBC, RBC, and mean corpuscular volume (MCV), and utilizing the latter two com-puting the hematocrit and then the mean corpuscular
hemoglobin (MCH) and mean corpuscular hemo-globin concentration (MCHC). The time required from the time of sample aspiration until the results of the seven determinations are printed is 40 seconds.
I must emphasize that not only speed is achieved,
but precision and accuracy are far greater than many previously used methods. Indeed, variation on repli-cate samples is less than 1 % and accuracy appears to be of the same order.
Considering the availability of such accurate
data and the comparative ease with which they may be obtained, it can be seen that these instruments
* Presented by Dr. Johnston at the 44th Annual
Mc-Guire Lecture Series, March 23, 1973, at the Medical
Col-lege of Virginia, Richmond.
362
can be valuable tools in screening for hematological
abnormalities. Indeed here at the Medical College of Virginia, two interdepartmental cooperative
studies have been conducted within the past year.
One of these was presented in abstract form at the December 1972 meeting of the American Society of Hematology, and has recently been submitted for
definitive publication (5). The work in large part was the project of Mr. Alvin Schmaier, currently a
third-year medical student, with assistance from Drs. Maurer, Johnston and Scott. The other study has been conducted as part of a larger study in approxi-mately 530 Black children in the Head Start
Pro-gram. These studies exemplify particularly well the principle of multitest screening in hematology, and
it is to these and to a comparison of these with
previous studies (1, 3) that I wish to address my-self.
I will not detail the technical operation of the model "S" but note here that we have had the in-strument in operation for more than three and a half years. This has given us extensive experience in all of the positive as well as the negative qualities of
the instrument. Because some of the parameters are
computed, our initial efforts were to compare these with other methods then in operation and standardize
the data. This was accomplished by comparative data obtained on 1,500 samples of EDTA anticoagulated
blood. No significant difference was found in the hemoglobin determination, but the linearity was bet
-ter in the model "S" determinations than with flow-through determinations giving greater accuracy to the former, particularly in the high
>
16 gm and low<
7 gm ranges. For reasons which have never been satisfactorily explained either by us or by the manufacturer, the WBCs average approximately 8 % lower by the model "S" than when determined by our alternative or electronic back-up. This dis-crepancy is noted also in data from other institu-tions. The lower percentage has been consistentand therefore is not a factor. Finally, the compari-son of the spun hematocrit with the computed hematocrit (MCV x RBC) showed the latter to be, on the average, 1 % higher-a difference that is minimal and one that certainly can be disre-garded. I should note here that this is somewhat different from the study of England and Fraser ( 1) who set the electronics so that the hema-tocrit is 1.5% below the spun hemahema-tocrit. This quite possibly might allow for differences of our MCV norm 92 ± 6 (range 86-98) from theirs
(80-90). Indeed Pearson, et al. ( 3), describe a range of 72-101 with a mean of 88.67 and a stan-dard deviation of 5.3.
At the outset then, it becomes important to note what the norms are for the population being studied and these should be norms for the institution. The data just given are presumed to be an adult popula-tion; however, it is not clear from either of the pub-lished reports cited above whether age differences were taken into consideration in their studies. The reason for concern with the age variability of the MCV data will become apparent since this parameter is one of the major criteria used to screen for the thalassemia syndromes.
The other measured parameter of extreme im-portance in the screening efforts is the RBC. We have come to regard this as extremely accurately measured by the model "S." In contrast to the earlier manual methods with an accuracy no greater than 20 % , we now feel the accuracy and repro-ducibility of this measurement is on the order of 1 % , or in the range of 50,000 RBC/µl.
With these points in mind, I would like to dis-cuss the application of multitest screening in hema-tology and share some of the results we have ac-cumulated in specific studies. The first such study undertaken here was a cooperative effort involving the divisions of Clinical Pathology, Pediatrics and Medicine. Mr. Alvin Schmaier, working as a summer extern in the Department of Pediatrics, was respon-sible for the collection of samples anti collation of the data. This portion of my report is in large part his effort. It is a most commendable piece of work which recently has been submitted for publica-tion ( 5). The data given here are reproduced with his permission.
This study took advantage of the fact that defec-tive alpha chain synthesis may occur in the neonate and result in the presence of the tetrameric hemo-globin, hemoglobin Barts (gamma 4). This form of
hemoglobin rapidly disappears with onset of beta chain synthesis and by six months of age no longer can be identified. Cord blood studies have been per-formed but these naturally are limited in scope. Alpha thalassemia heterozygotes have abnormal red cell indices, and if these could be identified early, it might be possible to select infants in the neonatal period, or certainly within the first few weeks of life, whose blood then could be subjected to hemo-globin electrophoresis.
Taking advantage of the fact that blood could be obtained by capillary puncture with the use of unopettes from Becton Dickinson especially for model "S" counters ( order no. 5840, Becton Dick-inson, Rutherford, N. J.), Mr. Schmaier began col-lecting capillary samples in triplicate from the new-born nursery, of course after receiving parental consent. Table 1 shows the tabulation of the results. In particular, I want to call attention to the MCV and MCH. If one were to choose values for identi-fication as suggested by other studies, one would select only those with values below 80 fl! Obviously, then the norm for this population group is quite dif-ferent from adults, a fact that is well known ( 6). We were unaware, however, of the limits using the model "S" and these needed definition for the study. A total of 200 newborn Black infants was studied. Electrophoresis of the hemoglobin in these newborns showed 181 to be normal; that is, only hemoglobins A and F. Of the remainder, 13 showed an additional abnormal hemoglobin either S or C, while six showed the presence of hemoglobin Barts. Of the six, one also showed C and one S hemoglobin. As defined in Table 1, the lower limit of normal was
97 fl. In the samples studied, nine infants had MCV
less than 94 fl and MCH less than 29.5 fl. Since these figures are less than normal the data would be "suspect" and thus hemoglobin electrophoresis was performed. In the group of 200 studied, all had hemoglobin electrophoresis performed. Table 2 shows the hemoglobin electrophoresis and pertinent model "S" data on those with abnormal MCV and
MCH. It is to be noted that hypochromia can no longer be assessed by the MCHC ( 4); that is clearly shown in this table. The most s·triking findings are that of nine patients, six had hemoglobin Barts and
TABLE 1
RED CELL INDICES IN NORMAL BLACK FULL-TERM NEWBORN INFANTS
Red Blood Cell Count ( X 106 / µI)
Hemoglobin (g/dl) Hematocrit (%)
Mean Corpuscular Volume (fl)
Mean Corpuscular Hemoglobin (pg)
Mean Corpuscular Hemoglobin Concentration (g/dl)
s = Standard Deviation Constant k = L65
Lower tolerance limit = mean-ks
Sample size == 91
Mean 5.2 18.0 55.3 106.4 34. 5
32.5
Standard Deviation ks lower Tolerance Limit
0.6 1.0 4.2
2.0 3.3 14.7
6.1 10.0 45.3
5.7 9.4 97.0
2.2 3.6 30.9
1.0 1. 7 30.8
For example, for the mean corpuscular volume of 106.4µ3 , the lower limit of normal is 97µ3 (lower tolerance limit).
Hgb Sor C but no Barts and an MCV and MCH within the normal limits. Thus in this study, all infants with alpha thalassemia were readily identified so that no "false negative" values were recorded. There apparently were three false positives, with data just below the norms set. Currently, there is no explanation for these.
It can be seen then that Mr. Schmaier made a significant contribution in the study and that it is possible to screen infants using the multitest principle. As a matter of fact, the incidence of 3 % hemoglobin Barts is consistent with the re-ported incidence in American Blacks.
Let me now turn to another study involving muHitest screening with the evaluation of RBC abnormality indices. Whereas the previous study was concerned with alpha thalassemia trait, this study was designed to study thalassemia traits per-haps encompassing both alpha and beta thalas-semias. Again, this was a cooperative study in-volving the same divisions as those in the study just cited.
The group screened was quite different, how-ever. This was composed of 540 Black children most of whom were enrolled in the Head Start Program in Richmond. Our study was only part
TABLE 2
HEMATOLOGIC FINDINGS IN NINE INFANTS WITH MEAN CORPUSCULAR VOLUMES <94 FL
AND MEAN CORPUSCULAR HEMOGLOBINS <29.5 PG
Infant Hgb Pattern MCV (fl) MCH (pg) MCHC (gm/di) Hgb Barts (%) Other Abnormal Hgb (%)
1 F, A, S, Barts 93 2 F, A, C, Barts 93 3 F, A, Barts 87
4 F, A, Batts 94 5 F, A, Barts 93 6 A, F, Barts* 90
7 F,A 91
8 F,A 93
9 F,A 91
MCV = mean corpuscular volume
MCH = mean corpuscular hemoglobin
28.5 28.2
27.7 29.1 29.5
28.0 29.0 29.2 29.3
MCHC = mean corpuscular hemoglobin concentration
RBC = red blood cell count
Hgb = hemoglobin Hct = hematocrit
* Electrophoretic pattern at one month of age
31.0 4.6 4.8
30.7 4.4 10.6
32.0 5.1 31.4 6.6
32.1 4.8
31. 6 3.0 31.2
31.4
of a larger medical evaluation conducted under
the aegis of the Department of Pediatrics at the
Medical College of Virginia. As part of the study,
capillary blood samples were drawn by a registered
medical technologist at the various schools. Samples
were takep. for Coulter model "S" determinations
and hemoglobin electrophoresis. As in the earlier
study, unopettes for the model "S" (order no. 5840,
Becton Dickinson, Rutherford, N. J.) were used.
These were drawn in duplicate, the model "S" parameters determined on both samples. Capillary sampks also were used for the hemoglobin elec-trophoresis. Indices available for comparison were dated prior to the advent of electronic counters performing multiple simultaneous tests. Our ex-perience with initial standardization of our model "S" showed that our norm for the automated
pro-cedures of 92 ± 6 was higher than that generally
used· of 88 .± 8. It seemed likely, therefore, tqat
these older data could represent values lower tqan
might be obtained by the currently used automated
methods. Additionally, other than the standards
cited by Shumway (6), I am aware of no others.
As a result, it seemed preferable to determine our own mean model "S" parameters for this age group.
As noted, the recently published works did
not specify the ages of the patients studied. It was
assumed, therefore, that these were adults. In both
studies, the lower limit of normal was 80. With
Shumway's data ( 6) suggesting a lower mean MCV
for pediatric age groups when compared with adults, we felt that perhaps it would be wise to include
lower values. Thus for those studies, an MCV of 76
or greater was used for establishment of the mean
and those 75 or lower were excluded. It is gratifying
to note that 26% of the children studied had MCVs
76-79 and would have been excluded if the criteria of other screening studies had been used.
For the moment, I would like to refer to the
results not as normal but rather as "mean model
'S' parameters." The health of the children was
not evaluated and the sampling was random. Data from two children were excluded because of hemo-globin values less than 10 but with MCV over 80.
As a result, determination on 451 Black
children, ages four to eight, with MCV greater than
76 were available for analysis. The results of these
determinations are shown in Table 3. As noted,
these are mean model "S" parameters for the group
studied. These show the means with one standard
deviation as well as the range. Also shown is the
TABLE 3
MEAN MODEL "S" PARAMETERS
(451 Black Children MCV > 75)
Lower
Determination Mean± SD Range Toi. Limit*
RBC 4.51 ± 0.31 3.81-5.19 4.0
Hgb 12.3 ± 0.86 10.4-14.8 10.9
Hct 36.7 ± 2.4 31.1-45.1 32.7
MCV 81.8 ± 3.3 76.0-91.0 76.4
MCH 27. 3 ± I. 3 24. 3-31. 3 25.2
MCHC 33.7±0.8 31. 9-35. 7 32.4
* Lower Tolerance Limit = x - ks
x = mean
k = 1.65 (95% tolerance level) s = standard deviation
lower tolerance limit using a 95 % tolerance
in-terval (k
=
1.65). With these figures we couldbe 95% certain that 90% of the values would be
above the lower tolerance limit shown in the right hand column.
It now becomes of great interest to compare
these results with those alluded to earlier as having
been determined by nonautomated methods and
reported by Shumway ( 6). This comparison is
shown in Table 4. The similarities are remarkable,
especially when one considers that our population
sample was not a selected one and was from
chil-dren with Hgb greater than 10.4 gms and MCV
76 or greater. I think we can conclude that it might
be reasonable to accept these as normal values for
the age group.
Our original intent for the determination of the indices was to see if it would be possible to
screen for thalassemia trait using microcytic
hypo-chromic indices as the major criteria. The spectre
of iron deficiency, however, loomed large in front
of us since both thalassemia trait and iron
de-RBC Hgb Hct MCV MCH MCHC
TABLE 4
Current Data
4.51 ± 0.31 12.3 ± 0.86 36.7 ± 2.4 81.8 ± 3.3 27. 3 ± I. 3 33.7±0.8
Shumway (6)
ficiency are characterized by microcytic hypochromic indices. At the time that these data were be-ing collated for presentation, the results of the hemoglobin electrophoresis were not available. Thus, there were 84 children with MCV 75 or less who needed to be differentiated if possible. Pearson, et al. (3), in their studies, proposed a scheme for thalassemia trait screening. This is shown in a slightly modified fashion in figure 1. Note that the first step in screening is to classify the subjects into two groups according to the MCV which is precisely what we did. The next step involves quantification of A.2 hemoglobin which, as noted,
is not at the moment available.
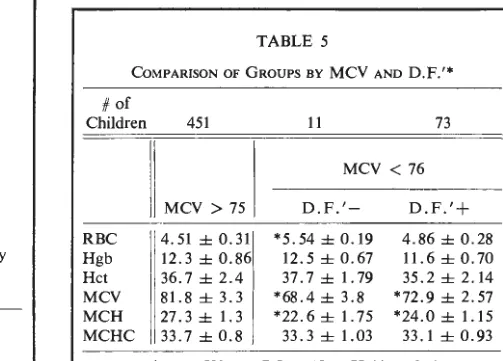
This led to a search for an alternative method for attempting to differentiate the MCV 75 and below group. Recently, such a method has been published by England and Fraser ( 1). They re-ported that by the use of the statistical discriminant function (D.F.) they were able to differentiate be-tween ·the disorders with a 99% success rate in 72 cases. As a result of their study, a slightly modi-fied formulation is available and is shown as well as the data for the study in Table 5. Thus, it seemed
MCV (Model "S")
~~
MCV <79 fl MCV >79 fl
Dx: Normal
Hgb A,> 3.5% 3.5%
t
t
Dx: f) Thalassemia Serum iron
/
\
Normal Reduced
+ family study
i
Dx: Iron deficiency Dx: a ThalassemiaModified from Pearson, et al (3).
Fig. I- Suggested schema for thalassemia trait screening.
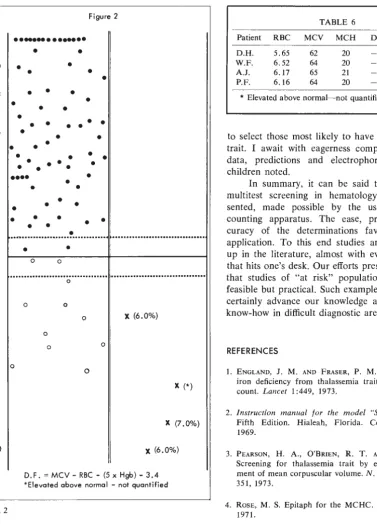
that it might be possible to predict, in advance of the receipt of the electrophoretic data, the groups into which our 84 subjects might fall and effectively separate the thalassemia trait from an iron de-ficiency. Accordingly, the appropriate data on those children with MCV 75 or less were substituted into the formula. The results are shown along with the normal in Table 5. It can be seen that 11 of the group had negative, while 73 had positive, D.F.s. To show the distribution, a chart like that of Eng-land and Fraser ( 1 ) was prepared and is shown in figure 2. The closed circles represent those sub-jects with a positive D.F.' and presumable iron de-ficiency. Those with the open circles represent the negative D.F.' and presumable thalassemia trait. Since the critical data currently are missing, I think it is only possible to state that we are predicting that these are the groups into which the subjects fall. The data in Table 5 show certain of the mean values to be sufficiently different to suggest that these really are two distinct groups despite a few (four) that were too close to O to call ( fig. 2). As soon as the additional data are available, we will know how well we are able to predict.
If I may be allowed to speculate, I expect a
high success rate. As evidence for this rather rash statement, again direct your attention to figure 2. Note that in the D.F.' negative area [D.F.'
=
MCV -RBC - (5 x Hgb) - 3.4] there are four x's. While this manuscript was in preparation, I noted four patients' model "S" data that were quite like those seen in the 11 children with nega-tive D.F.s. I felt these were suspect on the basisTABLE 5
COMPARISON OF GROUPS BY MCV AND D.F.'*
# of
Children
RBC Hgb Hct MCV MCH MCHC
451
MCV > 75
4.51±0.31 12.3±0.86 36.7 ± 2.4
81.8±3.3 27.3 ± 1.3 33.7±0.8
11 73
MCV < 76
D.F.'- D.F.'+
*5.54±0.19 4.86 ± 0.28 12.5 ± 0.67 11.6 ± 0. 70
37. 7 ± 1. 79 35.2±2.14
*68.4 ± 3.8 *72.9 ± 2.57 *22.6±1.75 *24.0 ± 1.15 33.3 ± 1.03 33.1 ± 0.93
Figure 2
>11 · · - · · ·
+10
+8
+6
+4
+2
-2
-4
-6
-8
-10
Fig. 2
•
•
•
•
•
•
•
•
•
•
•
•
•
•
•
••••
•
•
•
•
•
•
•
•
•
•
•
•
•
•
•
•
• •
•
•
•
•
• •
•
•
•
•
•
•
•
•
•
• •
•
•
•
•
...
~... .
•
•
0 0
...
0
0
0 0
0 X (6.0%)
0
0 0
0
x
(*)X (7.0%)
X (6.0%)
D.F. = MCV - RBC - (5 x Hgb) - 3.4
*Elevated above normal - not quantified
of the experience I was accumulating. Hemoglobin
electrophoresis was performed in these, therefore, and the A2 hemoglobin quantified. Summary data
on these patients are given in Table 6. Such ability
to predict certainly suggests that the automated
multitest apparatus has given us remarkable ability
TABLE 6
Patient RBC MCV MCH D.F. % A,Hgb
D.H. 5.65 62 20 -3.05 6
W.F. 6.52 64 20 -9.92 6
A.J. 6.17 65 21 -8.5 7
P.F. 6.16 64 20 -6.5 (*)
* Elevated above normal- not quantified
to select those most likely to have beta thalassemia trait. I await with eagerness complete collation of
data, predictions and electrophoresis in the 84
children noted.
In summary, it can be said that a sample of multitest screening in hematology has been
pre-sented, made possible by the use of automated
counting apparatus. The ease, precision and
ac-curacy of the determinations favor much wider
application. To this end studies are now cropping up in the literature, almost with every new journal that hits one's desk. Our efforts presented here show
that studies of "at risk" populations are not only
feasible but practical. Such examples as those given, certainly advance our knowledge and facilitate our
know-how in difficult diagnostic areas.
REFERENCES
I. ENGLAND, J. M. AND FRASER, P. M. Differentiation of
iron deficiency from thalassemia trait by routine blood
count. Lancet I :449, 1973.
2. Instruction manual for the model "S" coulter counter. Fifth Edition. Hialeah, Florida. Coulter Electronics, 1969.
3. PEARSON, H. A., O'BRIEN, R. T. AND McINTOSH, S.
Screening for thalassemia trait by electronic measure-ment of mean corpuscular volume. N. Engl. I. Med. 288: 351, 1973.
4. RosE, M. S. Epitaph for the MCHC. Br. Med. I. 4: 169, 1971.
5. SCHMAIER, A. H., MAURER, H. M., JOHNSTON, C. AND
Scorr, R. B. Alpha thalassemia screening in neonates
by MCV and MCH determination. /. Ped. (In press).
6. SHUMWAY, C. N. Children are different. Bulletin No. 16.