World Journal of Advanced Research and Reviews
Cross Ref DOI: 10.30574/wjarr Journal homepage: https://www.wjarr.com
Corresponding author
E-mail address: [email protected]
Copyright © 2019 Author(s) retain the copyright of this article. This article is published under the terms of the Creative Commons Attribution Liscense 4.0.
(RESEARCH ARTICLE)
Application of control charts for non-normally distributed data using statistical
software program: A technical case study
Eissa Mostafa *
Faculty of Pharmacy, Cairo University, Egypt.
Publication history: Received on 21 January 2019; revised on 16 February 2019; accepted on 21 February 2019
Article DOI: https://doi.org/10.30574/wjarr.2019.1.1.0013
Abstract
Control charts are a valuable assessment tool in the healthcare industry. The ease of use of these trending charts is crucial to obtain timely important results with minimum time and efforts. The current case showed analysis of non-normal data to obtain control charts with useful output without using exhaustive different means of transformation and/or omitting aberrant numbers. Raw results for the quality of purified water from water treatment plant that converts municipal water to purified water were collected from two points-of-use - (ζ and Ψ). Data gathered were conductivity and total organic carbon (TOC) measurements. The statistical processing and control charts were done using commercial statistical software package. Statistical analysis of data showed that conductivity and TOC results of both points did not follow Gaussian distribution except TOC of point Ψ where it passed normality test, but they were closest to other distributions. There were several observations of outlier values from the results. Moreover, data normalization did not improve after removal of the extreme values. Data were switched to be interpreted using Laney-modified attribute control charts and compared with the original results drawn using individual-moving range (I-MR). Interestingly, both types of control charts agreed regarding control limits and some alarm points. I-MR and Laney-attribute charts could be used for non-normal data with unusual other types of distributions that may not be suitable for conventional types of control charts with the variable charts possess greater sensitivity of alarm detection over the attribute charts.
Keywords: Conductivity; Total organic carbon; I-MR; Laney-attribute; Normalization; Purified water
1. Introduction
Process-behavior (control, trending or Shewhart are synonymous) charts have wide application in different fields including healthcare industry [1, 2]. Shewhart charts are important to monitor a pattern in the inspected characteristics [3]. However, trending charts have prerequisites before application in a certain investigation such as normality of data for individual-moving range (I-MR) control charts [4]. Interestingly, it is suggested that individuals (Is) charts could be used for non-normal and attribute data [5].
40 minimum treatment of data before charting. In addition, a comparison between two systems of control charts will reveal the agreements and the differences to determine the preferences between each type and the flexibility to switch between both.
2. Material and methods
2.1.The subject of the study
Water treatment station that feeds healthcare facility with purified water using municipal water as a feeding source. The plant is composed generally of coarse filtration tower, Chlorination adjustment unit, interchangeable softeners, sanitization plant, reverse osmosis (RO) and electro-deionization compartments. In addition, purified water tank and distribution loop are monitored regularly for the quality of the produced water for consumption in a healthcare facility.
2.2. Sampling period
Samples of purified water were taken regularly on daily basis during the third quarter (July, August and September) of the year 2018.
2.3.Sample data
The water plant was sampled from two points-of-use - denoted by (ζ and Ψ) - to be tested for total organic carbon (TOC) and conductivity. Results were collected in an Excel sheet by the quality engineer of the firm.
2.4.Unit of measurements and limits
Alert and action limits of TOC are not more than (NMT) 300.0 and 500.0 part per billion (ppb). Conductivity measurements were made at 25 °C and the primary criterion is that the reading must be NMT 1.30 µS/cm [10].
2.5.Data interpretation
Raw results will be initially subjected to a descriptive statistical analysis accompanied by distribution fitting and normality testing. Shewhart charts will be constructed through two approaches. Firstly, direct data visualization using I-MR chart regardless, data were normal or not. Secondly, the figures of the results will be turned into discrete values by multiplying by the sensitivity decimals of the test i.e. X10 for TOC and X100 for conductivity and interpreted using Laney-modified attribute control charts.
2.6.Role of commercial statistical software
Column and descriptive statistics were performed using GraphPad Prism for Windows version 6.01 [11]. Best distribution fitting analysis was done using XLSTAT version 2014.5.03 [12]. While box-and-whisker diagrams and control charts were plotted using Minitab® 17.1.0 [13].
3. Results
3.1.Statistical analysis
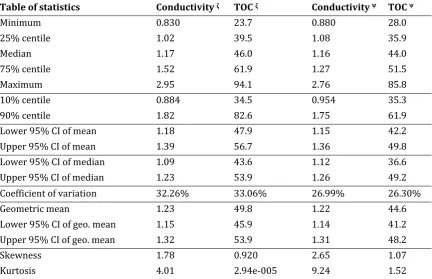
Column statistics showed that the mean ± standard deviation (SD) of conductivity and TOC for both ζ and Ψ ports was 1.29 ± 0.42, 1.25 ± 0.34 µS/cm and 52.3 ± 17.3, 46.0 ± 12.1 ppb, respectively. Table 1 shows percentile analysis, the upper and the lower confidence intervals (CI) for means, medians and geometric means at 95 %, coefficient of variations (CV) and the degree of skewness and kurtosis. In general, the results of each measured parameters for sampling points of purified water are not different significantly at P <0.05 with weak Spearman correlation when assessed non-parametrically: 0.49 (TOC) and 0.33 (conductivity).
3.2. Normality testing
41
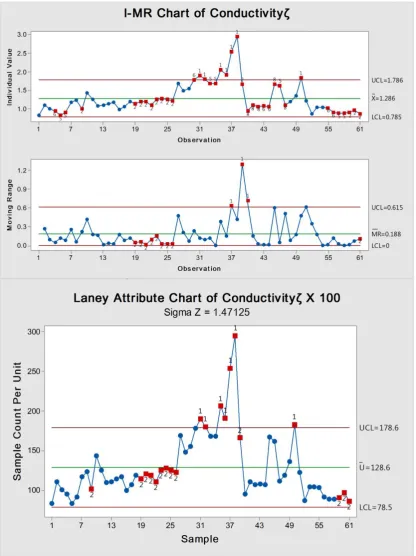
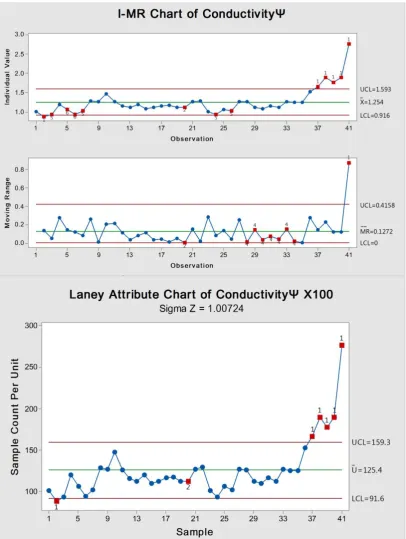
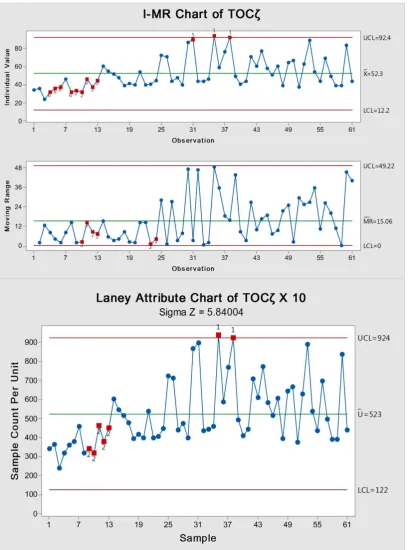
3.3.Control charts
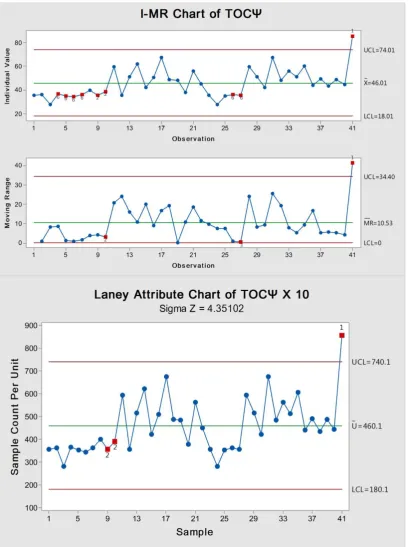
Trending charts of TOC and conductivity for both ζ and Ψ point-of-use could be demonstrated in Figures 2, 3, 4 and 5 using both I-MR and Laney-modified attribute charts with red dots indicating alarms for out-of-control results. Means are indicated by green lines and control limits (CLs) are indicated with red lines above (UCL) and below (LCL) the mean lines. Z value in Laney-corrected attribute chart is a measurement for overdispersion of data which is significant in TOC rather than conductivity in both use points of the water treatment station.
Table 1 Statistical analysis of the inspected TOC and conductivity qualities of purified water in the healthcare facility
Table of statistics Conductivity ζ TOC ζ Conductivity TOC
Minimum 0.830 23.7 0.880 28.0
25% centile 1.02 39.5 1.08 35.9
Median 1.17 46.0 1.16 44.0
75% centile 1.52 61.9 1.27 51.5
Maximum 2.95 94.1 2.76 85.8
10% centile 0.884 34.5 0.954 35.3
90% centile 1.82 82.6 1.75 61.9
Lower 95% CI of mean 1.18 47.9 1.15 42.2
Upper 95% CI of mean 1.39 56.7 1.36 49.8
Lower 95% CI of median 1.09 43.6 1.12 36.6
Upper 95% CI of median 1.23 53.9 1.26 49.2
Coefficient of variation 32.26% 33.06% 26.99% 26.30%
Geometric mean 1.23 49.8 1.22 44.6
Lower 95% CI of geo. mean 1.15 45.9 1.14 41.2
Upper 95% CI of geo. mean 1.32 53.9 1.31 48.2
Skewness 1.78 0.920 2.65 1.07
Kurtosis 4.01 2.94e-005 9.24 1.52
Table 2 Normality tests investigated by three different methods at α=0.05
Normality Test Conductivity ζ TOC ζ Conductivity TOC
I- D'Agostino and Pearson omnibus normality test
K2 31.8 7.92 42.5 10.4
P value < 0.0001 0.0190 < 0.0001 0.0055
Passed normality test (α=0.05)? No No No No
P value summary **** * **** **
II- Shapiro-Wilk normality test
W 0.830 0.906 0.733 0.916
P value < 0.0001 0.0002 < 0.0001 0.0052
Passed normality test (α=0.05)? No No No No
P value summary **** *** **** **
III- KS normality test
KS distance 0.223 0.165 0.287 0.123
P value < 0.0001 0.0003 < 0.0001 0.1177
Passed normality test (α=0.05)? No No No Yes
P value summary **** *** **** ns
42
43
44
45
46
Figure 5 I-MR and Laney-attribute control charts for TOCΨ showing out-of-control points (red dots), mean (green line), upper control limit (UCL) and lower control limit)
4. Discussion
47 The present study aimed to solve this dilemma by using two approaches with a minimum amount of conversions or transformations to minimize the risk of errors in calculations and to save time with minimum efforts yielding a similar outcome. Examples of wild data that do not follow specific distribution are common such as in the current case [20, 21]. The use of I-MR charts was reported previously to be used with non-normal data with a similar outcome with Laney attribute control charts when compared with (I) charts section [22,23]. However, variable control charts have an extra sensitivity over attribute trending charts of detection more alarms that may provide an early warning for excursions before they occur. In Minitab, eight types of alarms could be detected in variable control charts versus four in attribute counterpart. In addition, I-MR charts provide a measure of the process variation stability in MR charts [24]. While it could be evident that I-MR and Laney attribute control charts share one to four alarm-types, five to eight alarms are specific for variable attribute charts.
Since many points (indicated by red dots) showed out-of-control states, the assignable specific causes of such variations require identification and corrections to improve the process and the quality of purified water that feeds healthcare facility. Once the inspected properties (TOC and conductivity) shows improvement and becomes in control (which will be evident in control charts with only common-cause variations are present), the process capabilities parameters could be calculated.
5. Conclusion
In general, both I-MR and Laney attribute charts can be used simply on wild raw data that do not follow any kind of assumed distributions for the creation of specific control charts. Accordingly, they save time and effort to provide a simple and effective way for continuous monitoring of the inspected properties and/or process. However, I-MR charts may show some advantages of Laney attribute charts in term of ease of construction and detection of out-of-control points. In the present case, it is important to provide better control and maintenance of the water treatment plant to improve the quality of TOC and conductivity for the output purified water.
Compliance with ethical standards
Disclosure of conflict of interest
None to declare.
References
[1] Benneyan JC. (2008). The design, selection, and performance of statistical control charts for healthcare process improvement. International Journal of Six Sigma and Competitive Advantage, 4(3), 209-39.
[2] Eissa ME, Mahmoud AM, Nouby AS. (2016). Statistical Process Control in the Evaluation of Microbiological Surface Cleanliness Quality and Spotting the Defects in Clean Area of Pharmaceutical Manufacturing Facility. Haya: The Saudi Journal of Life Sciences, 1(1), 1-17.
[3] SAĞIROĞLU Ş, BEŞDOK E, Erler M. (2000). Control chart pattern recognition using artificial neural networks. Turkish Journal of Electrical Engineering & Computer Sciences, 8(2), 137-46.
[4] McCracken AK, Chakraborti S. (2013). Control charts for joint monitoring of mean and variance: an overview. Quality Technology & Quantitative Management, 10(1), 17-36.
[5] Wheeler DJ. (2000). Understanding Variation: the key to managing chaos, Second edition. SPC Press, Knoxville, TN.
[6] Ryan BF, Joiner BL. (2001). Minitab handbook. Duxbury Press, Pacific Grove, CA.
[7] Eddison J. (2017). Quantitative Investigations in the Biosciences using MINITAB. Routledge. [8] Laney DB. (2002). Improved control charts for attributes. Quality Engineering, 14(4), 531-7.
[9] Statgraphics C. (2009). Statgraphics Centurion XVI User Manual. StatPoint Technologies Inc, Warrenton.
[10] Cholayudth P. (2006). Establishing alert limits for microbial counts in Purified Water. Journal of Validation Technology, 13(1), 44.
48 [12] McDonald-Newman E. (2012). Excel Manual with XLSTAT: Business Statistics. Addison-Wesley, Boston, MA. [13] McLaughlin KM, Wakefield DB. (2015). An Introduction to Data Analysis Using Minitab® 17. Fifth edition. Pearson
Education, Incorporated, Connecticut.
[14] Elevli S. (2006). Coal quality control with control charts. Coal Preparation, 26(4), 181-99.
[15] Mertens K, Decuypere E, De Baerdemaeker J, De Ketelaere B. (2011). Statistical control charts as a support tool for the management of livestock production. The Journal of Agricultural Science, 149(3), 369-84.
[16] Güney MÇ, Kayaalp GT. (2016). Determination of egg shell quality with P control charts in poultry. Turkish Journal of Agriculture-Food Science and Technology, 4(7), 588-91.
[17] Boran S, Diren DD. (2017). Analysis of out of control signals in multivariate processes with multilayer neural network. Acta Physica Polonica A, 132(3), 1054-7.
[18] Anderson DR, Sweeney DJ, Williams TA, Camm JD, Cochran JJ. (2016). Statistics for business & economics. Nelson Education, Stamford.
[19] Neuburger J, Walker K, Sherlaw-Johnson C, van der Meulen J, Cromwell DA. (2017). Comparison of control charts for monitoring clinical performance using binary data. BMJ QualSaf, 0, 1–10.
[20] Changyong FE, Hongyue WA, Naiji LU, Tian CH, Hua HE, Ying LU. (2014). Log-transformation and its implications for data analysis. Shanghai archives of psychiatry, 26(2), 105.
[21] Xu S. (2013). Principles of statistical genomics. Springer, New York, NY, USA, 283-302.
[22] Eissa ME. (2018). Variable and Attribute Control Charts in Trend Analysis of Active Pharmaceutical Components: Process Efficiency Monitoring and Comparative Study.Experimental Medicine (EM), 1(1), 32-44.
[23] Eissa ME. (2018). Application of Attribute Control Chart in the Monitoring of the Physical Properties of Solid Dosage Forms. Journal of Progressive Research in Modern Physics and Chemistry (JPRMPC), 3(1), 104-113. [24] Mukundam K, Varma DR, Deshpande GR, Dahanukar V, Roy AK. (2013). I-MR control chart: A tool for judging the
health of the current manufacturing process of an API and for setting the trial control limits in phase I of the process improvement. Organic Process Research & Development, 17(8), 1002-9.
How to cite this article