Fuzzy VIKOR Optimization for Designing High Performance
Hydroxyapatite/Polycaprolactone Scaffolds for Hard
Tissue Engineering
Fatemeh Nasiri
*, Saeed Ajeli, Dariush Semnani, Mohsen Jahanshahi, and Hamed Morad
Abstract- Electrospinning (ES) is a process affected by different factors including solutions, apparatus, and environmental parameters. Selecting ES parameters having effects on final scaffold properties is a multi-criteria decision-making problem. The use of statistical methods for multi-criteria decision-making can save time, energy and cost of the process and improve the efficiency of the final product. So in this study, the fuzzy VIKOR method with Shannon entropy weighting method was used for optimizing electrospun scaffold for bone tissue healing. For this, in the first step by trial and error, the percentage of polycaprolactone (PCL) in solution was selected. Then composite scaffolds were prepared with different hydroxyapatite (HA) concentrations and ES parameters (flow rate, ES distance, and the voltage). ES parameters, as well as HA concentration affected the studied characteristics of scaffolds. The obtained data were used for deploying weights of seven criteria based on Shannon entropy concept in fuzzy method optimization. Fiber diameter and distribution, surface and volume porosity, fiber alignment, surface roughness, and stable ES process were the 7 criteria considered in this study and 40 electrospun scaffolds were ranked with the fuzzy method by these criteria, then best-ranked samples redesigned. The redesigned samples were studied with SEM, AFM, TGA, Raman spectroscopy, water contact angle, tensile test, MTT assay, live/dead cells, and ALP activity tests. The diameter of the redesigned optimized scaffolds was obtained between 204 and 13 nm; and the surface and volume porosity were 67%-91% and 65%-86%, respectively. No toxicity was found and scaffolds had a positive effect on cell growth.
F. Nasiri, S. Ajeli, and D. Semnani,
Department of Textile Engineering, Isfahan University of Technology, Isfahan, Iran.
M. Jahanshahi
Nanotechnology Research Institute, School of Chemical Engineering, Babol Noshirvani University of Technology, Babol, Iran.
H. Morad
Department of Pharmaceutics, Faculty of Pharmacy, Mazandaran University of Medical Sciences, Sari, Iran.
Correspondence should be addressed to F. Nasiri e-mail: [email protected]
Keywords: electrospinning, PCL/HA scaffold, engineered textile, hard tissue engineering, fuzzy modeling
I. INTRODUCTION
E
very year more than 2 million people require bone grafting surgery for healing bone defects caused by accidents, trauma or diseases (like tumor resection) and is associated with treatment costs exceeding billions of dollars, societal productivity loss, and individual disability [1-3]. Human bone is a dynamic tissue that can regenerate after any kinds of defects but complete healing still is a challenge in orthopedic surgery. The bone remodeling needs osteoblast and osteoclast communication and suitable microenvironment for the cell growing [4,5]. On the other hand, the proper bone healing process takes some months depend on fracture or defect size and kind and patient characteristics (such as age, gender, diet). Autologous bone grafts and allografts are some common materials for bone reconstruction but allergic or body reaction and their mismatch lifespan are just some of their problems [6-8]. So many new natural and synthetic biomaterials and techniques have been investigated yearly for biomedical tissue engineering applications. Among them, electrospun fibrous scaffolds have attracted much attention due to their high surface area to volume ratio, porous communicated network, variety kinds of polymers and blends used, tailored characteristic depending on final usage and ease of electrospinning method itself [10-12].be fabricated with a wide scope of biomaterials containing natural and synthetic polymers and bioceramics [16-18].
For bone tissue engineering scaffolds, it is known that hydroxyapatite (HA) is a major mineral constituent of a bone matrix and has an ability to promote osteogenesis due to having osteoconductive and osteopromotive properties [19]. 70% of bone is composed of HA and in mammals, it is the main mineral [20]. In many studies, the researchers reported that by using HA bioactive ceramics in tissue scaffolds, stem cell growth and proliferation are good but the major drawback of HA is its rather brittle behavior and limited strain compliance. Therefore, some investigations have done on preparing composite scaffold by blending biomaterials with HA to improve its properties as an implant. PCL/HA [21], Polyurethane (PU)/HA [22], HA/silk fibroin [23], HA/collagen [24], metal ions-doped HA [25], HA/graphene oxide(GO) [26], and poly(trimethylene carbonate)(PTMC)/HA [27] are some attempts for improving the final functionality by producing a composite instead of using materials individually.
So in this study, HA and PCL were selected for electrospinning a composite scaffold for bone tissue application. From the wide array of polymeric materials available, PCL, a Food, and Drug Administration-approved biomaterial, is regarded as a soft- and hard-tissue-compatible bioresorbable material. PCL is often selected for electrospun tissue scaffold due to being non-toxic, easily obtainable, biodegradable and biocompatible. However, its poor hydrophilicity, improper mechanical properties and smooth surface (not proper for cell adhesion) reduce its activities in cell culture and also limit its use in hard-tissue engineering [28,29]. Co-electrospinning of PCL with different biopolymers or nanoparticles has provided an alternative strategy for producing high-performance PCL nanofibrous scaffolds. Many pieces of literatures reported that adding nanoparticle could improve the final composite scaffold properties if the volume of these nanoparticles be optimized as well as other processing parameters [30,31].
Therefore, in this investigation, we designed three steps plans for fabricating proper PCL/HA composite scaffold for bone tissue regeneration. The first step was a trial and error step which was an experimental part including preparing electrospinning solution with different biomaterials concentration, fabricating PCL/HA composite scaffold with different ES parameters (solution flow rate, ES distance, voltage) and evaluating the result correspondent to natural bone properties. In the second step by using the first step data, all the parameters took the weight with Shannon entropy and then the fuzzy method used for ranking the scaffolds. The VIKOR method is based on an aggregating function representing “closeness to the ideal”. This method
of compromise ranking determines a compromise solution, providing a maximum “group utility” for the majority and minimum of an individual regret for the opponent, which is an effective tool in multi-criteria decision making. This method is notable in a situation where the decision maker is not able or does not know to express its preference at the beginning of system design [32-34]. At last, the PCL/HA composite scaffold was redesigned and the optimized samples were studied with physicochemical, mechanical and biological tests.
II. EXPERIMENTAL
A. Materials
PCL (Mn=70000-90000; CAS No. 24980-41-4) was purchased from Sigma Aldrich, USA. Synthetic HA nanoparticles were obtained from Pardis Pajohesh Yazd, Iran, with a particle size in the range of 40-70 nm. Methanol and chloroform and other chemicals were of analytical grade and purchased from Sigma Aldrich, USA. Phosphate buffered saline (PBS) and penicillin/ streptomycin (antibiotics) were supplied by Sigma (USA). Fetal bovine serum (FBS) and Dulbecco’s modified Eagle’s medium (DMEM) were purchased from GIBCO (USA). Human osteoblast mesenchymal stem cells were obtained from Iran cell bank. All components were used as received.
B. Methods
B.1. PCL/HA Composite Scaffold Preparation
Fibrous PCL/HA composite scaffolds were developed through electrospinning technique. Different concentrations of PCL were dissolved in methanol/chloroform (75/25 v/v%) under continuous stirring for 2 h to obtain 8-14 w/w% solutions. HA nanoparticles were added to achieve 0.2-2.2 w/w% concentration in the solution and stirred for 1 h to obtain homogeneous solution. Electrospun PCL and PCL/HA scaffolds were prepared separately for studying concentration effect on scaffold morphology. Then electrospinning parameters (flow rate, electrospinning distance, and voltage) were changed to investigating their effect on composite scaffold properties and furthermore, they were chosen for the most influential electrospinning parameters. The applied voltage was in the range of 14-20 kV, the solution flow rate was in the range of 0.5-1.5 mL.h-1 and with the electrospinning distance
between 10 and 18 cm for 1 h. The resultant non-woven composite scaffolds were left in a fume cupboard for 2 days and then stored in a desiccator.
B.2. Characterization of Electrospun Nanofibrous Scaffolds
(NanoWizard® II; Germany) were used for the surface morphological evaluation of scaffolds. Before observation with SEM, the samples were sputter-coated by a thin layer of gold. SEM and AFM images were used for calculating average fiber diameters, scaffold surface porosity (Eq. (1)), surface roughness, diameter distribution, and fiber alignment with utilizing of Image J software. After choosing a defined number of fibers randomly in each SEM image, the most frequency of fiber alignment angle was characterized according to Rahmani et al. reports [35]. Fiber distribution was calculated by using AFM results on scaffold surface in combination with 20 fibers chosen randomly on each SEM image.
(1)
In which Ve is the empty space of surface, VT is the total scaffold surface, and Ps is the surface porosity of scaffold.
Furthermore, scaffold volume porosities were calculated using Eqs. (2) to (5):
(2)
(3)
(4)
(5)
ρa is the scaffolds apparent density; ρb is the bulk density
of scaffold; PV is the volume porosity percent; m is the scaffolds mass; V is the scaffolds volume; L, w, and T are the length, width and thickness of scaffolds, respectively. The density of PCL/HA composite was calculated according to ρb=(w1+w2)/(w1/ρ1 +w2/ρ2) by assuming that the total volume of the materials did not change before and after composite formation. Here, w1 and w2 are the weight fractions of each component in the composites (note that w1+w2=1). The average measurements were reported for each scaffold.
B.3. Wettability
Water contact angles measuring were conducted with a Kruss tester machine of Germany in order to evaluate the hydrophobic characteristics of PCL/HA and PCL scaffolds. Wettability property is an effective feature in cell activity interaction. Water droplets were dropped gently by deposing a 2 µL drop of dH2O on to the surface
of the scaffold. The results were reported as the average
of 5 measurements.
B.4. Thermal Gravimetry
Thermal properties of PCL/HA and PCL scaffolds were measured using a thermal gravimetry instrument (TGA; Perkin Elmer; USA). About 10-15 mg of scaffolds were placed in a platinum sample pan of a TGA. The heating rate was 10 °C/min and the scaffolds were heated up to 600 °C.
B.5. Spectroscopy
Raman spectroscopy (FRA 106/s; Bruker Co.; Germany) was used to determine the molecular constituents of composite scaffolds and confirm the presence of PCL and HA in electrospun scaffolds.
B.6. Tensile Test
Unidirectional tensile testing of scaffolds was performed on a Zwick universal testing machine at room temperature. The samples were cut to a rectangular shape (20×5×0.3 mm3
in length, width, and thickness) and tested at a crosshead speed of 5 mm.min-1 with a 100 N load cell. In all kinds of
samples, five specimens were measured and the mean and standard deviation were calculated.
B.7. MTT Assay
MTT assay and microscopic observation were employed to evaluate the viability and morphology of the human osteoblast cells treated with PCL/HA and PCL scaffolds containing different concentrations of HA and PCL. The human osteoblast cells were cultured in Dulbecco’s modified Eagle’s medium (DMEM). The culture conditions were humidity controlled environment under 5% CO2 at
37 °C. For cell seeding, the nanofibrous matrices (PCL/HA and PCL) were sterilized by immersing them in 70% alcohol for 30 min, washed twice with sterile PBS, and seeded with osteoblast cells at 104 cells well−1 in a 96-well plate. After 72 h of culture, the cell morphology was first observed using an inverted phase contrast microscope with a magnification of 200x for each sample, and then the medium was replaced by MTT assay reagents. Briefly, 10 μL of MTT solution (5 mg.mL−1 in fresh medium) was
added to each well, followed by incubation at 37 °C cell incubator for 4 h. Then, the medium was removed, and the formed formazan crystals were dissolved by the addition of 200 mL DMSO for 15 min, and subsequently the OD value at 490 nm was detected using a microplate reader (BioTek, USA). Mean and standard deviation from the triplicate wells for each sample was reported for 1, 3, 7, and 14 days.
B.8. Cell Proliferation
Human mesenchymal stem cells were cultured with a e s T V P V = a v b P 100 1= × − ρ
ρ
(
)
b polymer air
ρ = ρ + ρ
a mV
ρ =
growth medium that contained Dulbecco’s modified Eagle’s medium (DMEM) containing 10 (v/v%) FBS (fetal bovine serum). After cell seeding (1×10⁵ cells/
scaffold), scaffolds were incubated for 30 min and after that cell media was added. The cell culture was maintained in a 95% humidity incubator with 5% CO2 at 37 °C. The
medium was changed every 3 days. For the experiments, hMSCs at four passages were used. Live and dead cells were visualized with confocal fluorescence imaging at day 1, 7, and 14 time points were first rinsed in sterile PBS
and incubated in a PBS solution of 5 mM calcein AM and 5 mM ethidium bromide homodimer (Invitrogen) for 20 min prior to imaging. A Nikon fluorescent scanning confocal microscope was used to obtain a series of images through the top ~500 µm of each sample (live and dead cells labelling with green and red color, respectively).
By using Cell Counting Kit-8 (CCK-8) assay kits (Dojindo, Japan) seeding efficiency and cell growth in the scaffolds and viable cells were determined. Moreover, absorbance was measured at 450 nm by a microplate reader
No. Code Average diameter (nm)
Distribution (%)
Fiber alignment, average angle (°)
Surface porosity (%)
Volume porosity (%) 1 P14H0.0f1.5d10V18 1810±3.03 71 63±1.02 41 40 2 P14H0.0f1.0d10V18 1740±3.08 75 64±1.10 43 41 3 P14H0.0f0.5d12V18 1520±2.83 78 61±0.98 40 38 4 P14H0.0f1.5d12V18 2260±3.14 70 59±1.05 38 35
5 P13H0.0f1.0d10V18 1780±2.95 74 63±1.12 41 37
6 P13H0.0f1.5d12V18 1560±5.08 42 60±1.24 42 40 7 P13H0.0f1.0d12V18 1230±4.35 57 58±1.18 38 37 8 P13H0.0f1.5d12V15 2050±3.61 68 54±0.95 36 34 9 P12H0.0f1.5d10V18 1030±3.17 73 59±0.89 43 41
10 P12H0.0f1.5d12V18 990±3.08 67 57±1.06 45 43
11 P12H0.0f1.0d12V18 750±2.77 59 54±1.20 43 42 12 P12H0.0f1.5d12V16 1660±2.53 68 51±0.91 41 38 13 P11H0.0f1.5d10V18 820±2.75 68 53±0.83 46 43
14 P11H0.0f1.5d12V18 670±3.98 45 54±1.15 48 47
15 P11H0.0f1.5d15V18 580±3.76 48 51±1.07 42 40 16 P11H0.0f1.5d12V15 1130±4.82 44 49±0.90 41 39
17 P10H0.0f1.5d10V18 940±5.07 43 47±1.16 49 46
18 P10H0.0f1.5d12V18 770±3.19 70 45±0.83 53 50
19 P10H0.0f1.5d15V18 430±4.37 56 47±1.11 51 47 20 P10H0.0f1.5d12V15 1020±5.48 47 43±1.00 47 45
21 P9.0H0.0f1.5d15V18 480±1.29 89 43±0.92 54 52
22 P9.0H0.0f1.5d12V18 410±1.37 87 41±0.76 57 54 23 P9.0H0.0f1.0d16V18 360±1.02 91 35±0.51 51 48 24 P9.0H0.0f1.0d15V16 570±3.40 73 40±1.05 48 44 25 P8.0H0.0f1.5d15V18 440±5.76 46 34±1.47 53 50 26 P8.0H0.0f1.5d12V18 260±6.14 38 30±1.63 57 55 27 P8.0H0.0f1.0d15V18 210±6.71 49 31±1.02 53 48 28 P8.0H0.0f1.0d15V16 480±6.63 55 30±1.19 50 46
TABLE I
PCL SCAFFOLDS PROPERTIES WITH DIFFERENT PCL CONCENTRATIONS AND ES PARAMETERS
every 30 min and mean values were reported.
B.9. Alkaline Phosphate Activity
For alkaline phosphate (ALP) activity evaluation, hMSCs differentiated on scaffolds. ALP catalyzes the hydrolysis of the colorless p-nitrophenyl phosphate into a yellow p-nitrophenol product. After two times washing with PBS, hMSCs lysed in alkaline buffer at room temperature for 30 min. All the scaffolds were homogenized and incubated in glycine buffer. ALP activity was determined by the ALP assay kit according to the manufacturer’s instructions. The relative ALP activity was then normalized to the total amount of protein concentration of each sample. Each experiment was performed three times in triplicate.
B.10. Statistical Analysis
One-way analysis of variance (ANOVA) was carried out to compare the obtained data groups. A probability value of 95% (p<0.05) was used to determine significance. All data are presented as mean ± standard deviation.
III. RESULTS
A. PCL/HA Scaffold Fabrication and Characterization
For producing the desirable architecture of the scaffold, ES method parameters need to be optimized. For optimization of process, different ratios of biomaterial and ES
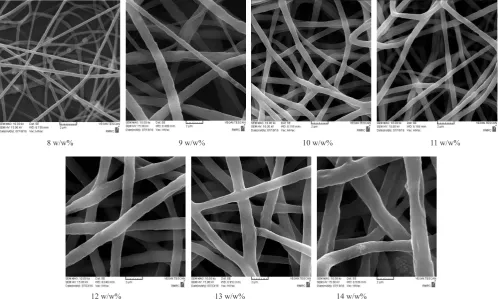
parameters (ES flow rate, ES distance and voltage) must be applied in a way to have a beadles’ scaffold with proper size and homogenously distribution of porosity as well as fiber diameter. As PCL was the organic polymer and used as a substrate for HA nanoparticles, first the amount of PCL must be optimized in ES solution. For this, 8-14 w/w% of PCL were added to chloroform/methanol (75/25 v/v%) solvent because less than 8 w/w% could not be electrospun and more than 14 w/w% made a non-homogenous solution. For obtaining the best w/w% of PCL in ES solution, fiber diameter and distribution, surface and volume porosity, fiber arrangement as well as stable ES process were considered as selection parameters. This stage of optimization was done by trial and error. In other words, the level of ES and solution parameters were optimized by trial and error. In each step of trial and error, SEM and AFM images were taken to calculate the uniformity of electro spun scaffold by determining the scaffold diameter and its distribution, porosity, and fiber alignment according to 2.3. In Table I, PCL scaffolds and their characteristics are listed. Samples are named with PaHbfcdeVg code, in which P and H are PCL and HA symbols, a is PCL w/w% and b is HA w/w%; f means flow rate and c is its amount on mL/h; d is ES distance, and e is its amount on cm; V is the voltage and g is its amount on kV.
12 w/w% 13 w/w% 14 w/w%
Fig. 1. SEM images (2 µm magnification) of PCL scaffold with different PCL concentrations (flow rate=1.5 mL/h; ES distance=12 cm; voltage=18 kV).
ES voltage has a significant effect on solution stretching and generally, it can be concluded that higher voltage results in thinner fibers. On the other hand, when solution is stretched with more force (due to the higher voltage), more ES solution came out of the syringe’s tip. Therefore, optimizing ES voltage is necessary for fabricating uniform scaffold with desired fiber diameter. For PCL with 14 w/w%, in constant flow rate (1.5 mL/h) and ES distance (12 cm), 18 kV could fabricate thinner fibers as compared to 15 kV, which showed that 15 kV did not have enough force to stretch the solution properly. If the voltage (18 kV) and flow rate (1.5 mL/h) were kept constant, more ES distance could help to produce thinner fibers than 12 cm. Moreover, in constant voltage (18 kV) and ES distance (12 cm), reducing flow rate from 1.5 mL/h to 0.5 mL/h by reducing solution amount during ES process, can provide thinner fibers. This phenomenon happens because less polymer solution content is subjected to the same electrical field which stretches it more efficiently. These trends can be seen in 13 and 12 w/w% of PCL, too. These results confirmed the cooperation effect of these three ES parameters and material concentration on the scaffold morphology.
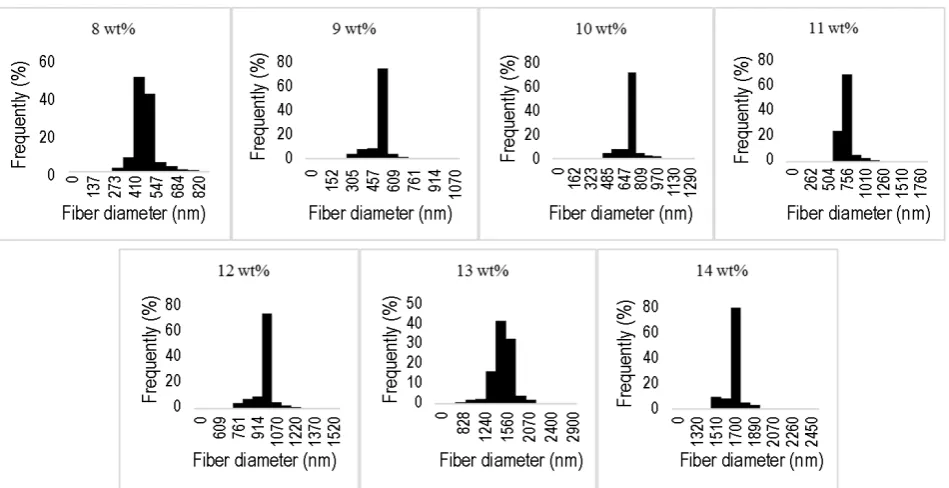
In Fig. 1 the SEM images and in Fig. 2 fiber diameter distribution of PCL scaffold with the same ES parameters can be seen. According to these Figures and Table I, the scaffold had more uniform distribution when the PCL concentration was reduced to 12 w/w%. Furthermore, the
fiber diameter decreased to nanoscale in less than 12 w/w% of PCL. The ES optimization is depended on solution properties such as surface tension, viscosity, concentration, electrical conductivity, and so on. So by decreasing the PCL w/w%, the ES solution characteristic was changed significantly which limited the ES parameters. For example, for 8 w/w% of PCL the minimum amounts of flow rate, ES distance and voltage were 1 mL/h, 12 cm, and 16 kV, respectively and below these amounts the ES process could not be done or the scaffold had lots of non-uniformity in its properties. As can be seen in Figs. 1 and 2 and Table I the best w/w% of PCL was 9 in which the average fiber diameter was 360-570 nm and its distribution was in the range of 73%-91%. Although in 8 w/w% of PCL the fibers were thinner, the uniformity decreasing and bead forming on the scaffold surface made it an unsuitable candidate for the rest of the study.
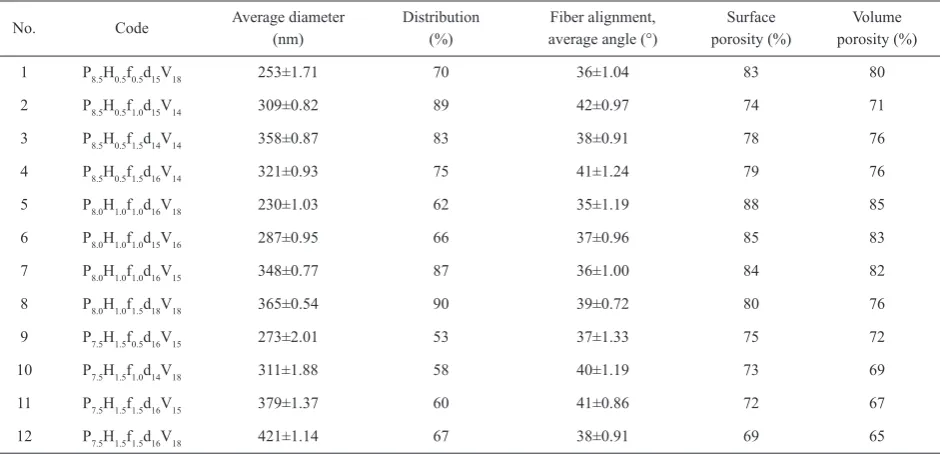
Our initial results showed that 9% polymer in total solution could be the most effective percent, therefore we divided this amount between PCL and HA. According to the experimental results, adding more than 1.6% HA in the PCL/HA solution made an inhomogeneous solution which could not be electrospun in an optimized continuous condition as well as nanoparticle agglomeration tendency did not allow to achieve a favorable PCL/HA scaffold. Thus 0.5, 1.0, and 1.5 w/w% were chosen for HA in final solution, consequently 8.5-7.5 w/w% were the PCL percentages. In Table II the optimized electrospinning parameters which
obtained with trial and error process and the resulted characteristics of fabricated scaffolds are listed.
According to Table II, when the ES parameters were constant, concentration independently, the addition of HA nanoparticles reduced fiber diameter and approximately increased scaffold porosity and mean angle of fiber alignment. The first effect of adding HA nanoparticles on PCL/HA scaffold is fiber diameter and its distribution. The best result of the PCL scaffold was P9.0H0.0f1.0d16V18, with
360±1.02 nm fiber diameter, 91% distribution, 35ᵒ±0.51 fiber alignment, 51% surface and 48% volume porosity. In the following, the best sample of each HA nanoparticle
concentration in fiber diameter (the thinner the best) is compared with P9.0H0.0f1.0d15V18. By adding only 0.5 w/w% HA to PCL/HA scaffold (P8.5H0.5f1.0d16V18), fiber diameter
and its distribution were decreased 29.7 and 23.08%, and scaffold and volume porosity were increased 38.55 and 40%, respectively, and it had no significant effect on the fiber alignment. When HA concentration increased to 1.0 w/w% in the scaffold (P8.0H1.0f1.0d16V18), fiber diameter and its distribution were decreased around 36.11 and 31.86%, respectively, but there was no observed any effect on the fiber alignment, although surface porosity and volume porosity were increased, respectively about
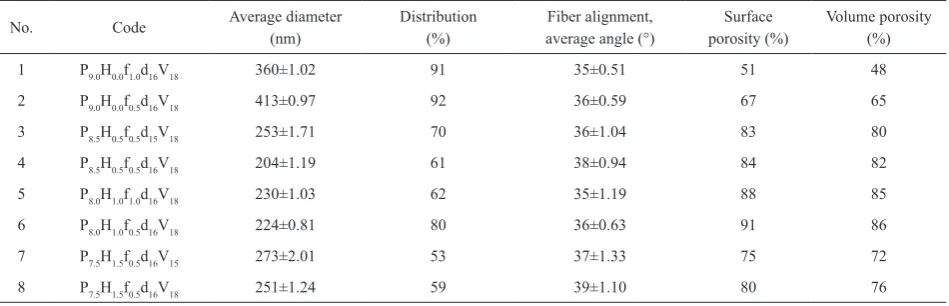
No. Code Average diameter (nm) Distribution (%) average angle (°)Fiber alignment, porosity (%)Surface porosity (%)Volume
1 P8.5H0.5f0.5d15V18 253±1.71 70 36±1.04 83 80
2 P8.5H0.5f1.0d15V14 309±0.82 89 42±0.97 74 71
3 P8.5H0.5f1.5d14V14 358±0.87 83 38±0.91 78 76
4 P8.5H0.5f1.5d16V14 321±0.93 75 41±1.24 79 76
5 P8.0H1.0f1.0d16V18 230±1.03 62 35±1.19 88 85
6 P8.0H1.0f1.0d15V16 287±0.95 66 37±0.96 85 83
7 P8.0H1.0f1.0d16V15 348±0.77 87 36±1.00 84 82
8 P8.0H1.0f1.5d18V18 365±0.54 90 39±0.72 80 76
9 P7.5H1.5f0.5d16V15 273±2.01 53 37±1.33 75 72
10 P7.5H1.5f1.0d14V18 311±1.88 58 40±1.19 73 69
11 P7.5H1.5f1.5d16V15 379±1.37 60 41±0.86 72 67
12 P7.5H1.5f1.5d16V18 421±1.14 67 38±0.91 69 65
TABLE II
PCL/HA COMPOSITE SCAFFOLDS PROPERTIES WITH DIFFERENT HA CONCENTRATIONS AND ES PARAMETERS
* ± is standard deviation.
72.54 and 77.08%. For PCL/HA scaffold with 1.5 w/w% HA (P7.5H1.5f0.5d16V15), the fiber diameter decreased about 24.17% but fiber distribution decreased 41.75%, and surface and volume porosity increased 47.06 and 50.0%, respectively, but there was no significant difference in the fiber alignment.
As discussed above, the thinner diameter did not have the best distribution. The best distribution in 0.5, 1.0, and 1.5% HA nanoparticle respectively occurred in 309±0.82, 365±0.54, and 421±1.14 nm. Adding HA nanoparticle, concentration independently, decreased the fiber diameter and increased scaffold porosities simultaneously. Scaffolds porosity increasing is an important factor in cell growth, adhesion, and proliferation. Proper porosity of 3D structures of biomaterials facilitated the transportation of oxygen and nutrients throughout the scaffold.
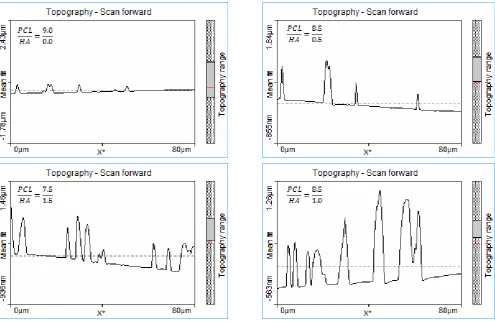
Fig. 3 shows a typical compression of PCL and PCL/HA scaffolds. As can be seen in Fig. 3, PCL scaffold had a near smooth and wrinkle-like surface, fibers bent and fused together at the contact point. The elasticity of the nanofibers decreased and the surface of scaffold nanofibers was coarser with grooves due to adding HA nanoparticles which affecting cell adhesion and attachment to the scaffold
[25]. In Fig. 4, the topography of scaffolds is shown and the positive effect of HA nanoparticles on PCL/HA scaffolds roughness can be seen clearly.
Therefore, adding HA nanoparticles as a nanofiller to the scaffold can improve its surface properties for biomedical application but its concentration and ES parameters must be optimized to provide good homogeneity, and favorable fiber diameter and scaffold porosity and prevent fiber discontinuity and nanofiller agglomeration on the scaffold, leading to weak composite scaffolds.
B. Fuzzy Optimization Model
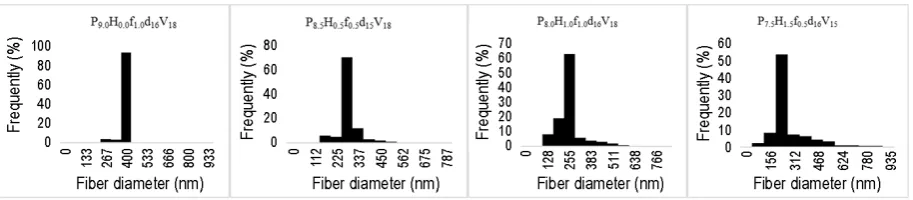
The calculation steps in a fuzzy approach are: (1) forming the decision matrix, (2) normalizing the data, (3) weighting the normalized matrix, (4) determination of positive and negative optimum solution, (5) determining the amount of benefit and regret, (6) calculating fuzzy index, and (7) ranking the data, respectively [37]. In the present work, decision matrix [40×7] is formed with 40 options and 7 criteria. Forty PCL and PCL/HA composites scaffolds produced were the options. Fiber diameter and distribution, surface and volume porosity, fiber alignment, surface roughness, and stable ES process were the 7 criteria. ES parameters, Fig. 4. Comparative diagrams of fiber distribution in PCL and PCLHA scaffold with different HA concentrations.
No. Samples Ranking No. Samples Ranking No. Samples Ranking No. Samples Ranking
1 P8.0H1.0f1.0d16V18 0 11 P9.0H0.0f1.0d16V18 0.2954 21 P8.0H0.0f1.0d15V16 0.8082 31 P11H0.0f1.5d12V15 0.8836 2 P8.5H0.5f0.5d15V18 0.0136 12 P9.0H0.0f1.5d12V18 0.3075 22 P10H0.0f1.5d12V18 0.8148 32 P13H0.0f1.0d12V18 0.8961
3 P8.0H1.0f1.0d15V16 0.0174 13 P7.5H1.5f1.5d16V15 0.3560 23 P11H0.0f1.5d12V18 0.8200 33 P12H0.0f1.5d12V16 0.9093
4 P7.5H1.5f0.5d16V15 0.0208 14 P7.5H1.5f1.5d16V18 0.4936 24 P11H0.0f1.5d15V18 0.8253 34 P14H0.0f0.5d12V18 0.9215
5 P8.5H0.5f1.0d15V14 0.0492 15 P9.0H0.0f1.5d15V18 0.6019 25 P12H0.0f1.0d12V18 0.8289 35 P13H0.0f1.5d12V18 0.9277
6 P8.0H1.0f1.0d16V15 0.0725 16 P9.0H0.0f1.0d15V16 0.7253 26 P11H0.0f1.5d10V18 0.8313 36 P14H0.0f1.0d10V18 0.9541
7 P8.5H0.5f1.5d16V15 0.1036 17 P8.0H0.0f1.0d15V18 0.7614 27 P12H0.0f1.5d12V18 0.8407 37 P13H0.0f1.0d10V18 0.9724
8 P8.5H0.5f1.5d14V14 0.1485 18 P8.0H0.0f1.5d12V18 0.7907 28 P12H0.0f1.5d10V18 0.8484 38 P14H0.0f1.5d10V18 0.9862 9 P8.0H1.0f1.5d18V18 0.1530 19 P8.0H0.0f1.5d15V18 0.8026 29 P10H0.0f1.5d10V18 0.8678 39 P14H0.0f1.5d12V18 0.9943
10 P7.5H1.5f1.0d14V18 0.2550 20 P10H0.0f1.5d15V18 0.8039 30 P10H0.0f1.5d12V15 0.8747 40 P13H0.0f1.5d12V15 1 TABLE III
one of criteria for weighting, analyses and their effects on scaffold characteristic are mentioned in Appendix A. Criteria weights were calculated with Shannon entropy. Objective weights based on Shannon entropy concept could be used to regulate subjective weights or taking in to account the end-users’. Moreover, Shannon entropy can weight criteria with discrete or opposite values [38,39]. Then the fuzzy methodology was applied for optimizing the obtained data and ranking the options. In Appendix B, the process of optimizing is shown. The fuzzy optimization was calculated with fuzzy software, and 40 data ranked with this method are listed in Table III.
IV. DISCUSSION
For bone tissue healing applications in orthopedics, porosities, fiber diameter, and uniformity of the scaffold with cancellous bone are desired because they have the main effect on biological compatibility. So, thinner fiber in nanoscale, more porosities and homogeneity would be desirable. Moreover, in recent years, significant progress has been made toward porous scaffold with desired osteogenesis. The scaffold must have macropororosity as well as micro ones. Interconnection between these porosities are necessary and important due to promote body fluid circulation, cell migration to the core of the implant, enhance the specific surface area, improve the permeability, providing more protein adsorption sites, enhancing the degradation and the osteoinduction of scaffolds [40]. The bone properties depend on many things such as age, sexuality, lifestyle, and so forth, some average values are listed in Table IV. Upon experimental results, we studied ES and solution parameters effect on morphological properties of PCL and PCL/HA composite scaffold. On the other hand, fuzzy optimization ranked the samples corresponding to the bone tissue application. As can be seen, the PCL/HA composite scaffolds have better ranking than PCL scaffolds which can confirm the nanoparticles positive and significant effect on PCL/HA composite scaffold. Moreover, dose- and ES parameters-dependent result for nanoparticles showed the necessity of HA concentration and ES parameters optimization in the ES process. The ES parameters, including solution flow rate, ES distance, and the voltage indicated that they
were not independent and they had cooperation effect on the composite scaffold morphology. In the next step by combining this founding, four samples were redesigned. For redesigning PCL/HA scaffolds, as can be seen in Table IV, all three HA concentrations are in 10 best-ranked samples so the first one of these three concentrations in Table were chosen, named P8.5H0.5f0.5d15V18, P8.0H1.0f1.0d16V18, and P7.5H1.5f0.5d16V15. The first best PCL
scaffold is P9.0H0.0f1.0d16V18, which used for PCL redesigned scaffold and for confirming the HA nanoparticles effect on composite scaffold properties. The physicochemical, mechanical, and biological characteristics of the redesigned scaffolds are studied then.
A. PCL/HA Composite Scaffolds Redesigning
The redesigned process was done by selecting three optimized HA concentrations (0.5, 1, and 1.5%) and the flow rate, ES distance, and the voltage were adjusted upon the experimental and fuzzy results. For each scaffold sample, one of ES parameters changed according to its effect on morphological properties. P9.0H0.0f1.0d16V18 redesigned as P9.0H0.0f0.5d16V18, less flow rate in the constant
voltage and ES distance could fabricate thinner fiber, so for the PCL scaffold, the flow rate reduction was selected. P8.5H0.5f0.5d15V18, P8.0H1.0f1.0d16V18, and P7.5H1.5f0.5d16V15 samples were redesigned by increasing ES distance to 16 cm, decreasing flow rate to 0.5 mL/h and increasing voltage to 18 kV, respectively. So three PCL/HA composite scaffolds were redesigned and named P8.5H0.5f0.5d16V18, P8.0H1.0f0.5d16V18, and P7.5H1.5f0.5d16V18. As a result of these
selective changing, four electrospun scaffolds with the same ES parameters were fabricated and compared. In Table V, the morphological characteristics of these four PCL and PCL/HA composite scaffolds obtained with SEM and AFM images are listed. For better comparison, the morphological properties of previous design scaffolds are listed, too.
By comparing PCL scaffolds with different ES parameters, it could be seen that the fiber diameter was increased by 53 nm and simultaneously its surface and volume porosity were increased. Therefore, it can be concluded that for the PCL scaffold, 0.5 mL/h flow rate, 16 cm ES distance and 18 kV voltage was the better combination of ES parameters,
Elastic modulus
(GPa) Ultimate stress (MPa) Strain to fracture (%) thickness (µm)Average Density (g/cm3)
0.7-4.9 1-25 2-4 300 0.05-1.1
TABLE IV
and more porosities and uniformity were the direct effect of this combination. The results in Table V show that these ES parameters made a reduction in fiber diameters and incrassating in porosities of all three PCL/HA composite
scaffolds. In Figs. 5 and 6 the SEM and AFM images of P9.0H0.0f0.5d16V18, P8.5H0.5f0.5d16V18, P8.0H1.0f0.5d16V18, and
P7.5H1.5f0.5d16V18 are shown. Fiber reduction, porosities
and roughness increasing can be seen from SEM and
No. Code Average diameter(nm) Distribution(%) Fiber alignment,average angle (°) porosity (%) Surface Volume porosity(%)
1 P9.0H0.0f1.0d16V18 360±1.02 91 35±0.51 51 48
2 P9.0H0.0f0.5d16V18 413±0.97 92 36±0.59 67 65
3 P8.5H0.5f0.5d15V18 253±1.71 70 36±1.04 83 80
4 P8.5H0.5f0.5d16V18 204±1.19 61 38±0.94 84 82
5 P8.0H1.0f1.0d16V18 230±1.03 62 35±1.19 88 85
6 P8.0H1.0f0.5d16V18 224±0.81 80 36±0.63 91 86
7 P7.5H1.5f0.5d16V15 273±2.01 53 37±1.33 75 72
8 P7.5H1.5f0.5d16V18 251±1.24 59 39±1.10 80 76
TABLE V
MORPHOLOGICAL CHARACTERISTIC OF REDESIGNED COMPOSITE SCAFFOLDS
* ± is standard deviation.
AFM images. Flow rate reduction had the most effect on fiber distribution of P8.0H1.0f0.5d16V18 (from 62% to 80%).
ES distance increasing in P8.5H0.5f0.5d16V18 had a positive effect on fabricating thinner fiber (from 253±1.71 nm to 204±1.19 nm) but the fiber distribution reduced and no significant effect can be seen on scaffold porosities. Voltage increasing in P7.5H1.5f0.5d16V18, had a positive and significant effect on fiber diameter and porosities, but the fiber distribution was improper in comparing with other samples.
B. Spectroscopy Evaluation of Scaffolds
In Fig. 7, the surface chemistry of PCL and HA nanoparticles individually and PCL/HA composite scaffolds structure is shown by Raman spectroscopy. In the Raman spectrum of pure PCL nanofibers, six obvious peaks can be seen at 965, 1108, 1303, 1438, 1726, and 2925 cm-1 which were
attributed to the stretching vibration of C-C (C-COO group), out-of-plane wagging vibration of C-H, skeletal stretching vibration, bending vibration of C-H, stretching vibration of C=O and C-H, respectively. HA nanoparticle’s Raman spectrum shows three characteristic peaks at 448, 587, and 946 cm-1 that respectively assigned to bending
modes (ν2) of PO-3
4, bending modes (ν3) of PO-34, and
stretching modes (ν1) of PO-34.
In PCL/HA scaffolds with different concentrations of HA nanoparticles (0.5, 1.0, and 1.5 w/w%) the spectra presented the peaks of all two components which Fig. 6. AFM images of four redesigned scaffolds (flow rate=0.5 mL/h; ES distance=16 cm; voltage=18 kV).
revealed the successful hybridization of PCL polymer matrix and HA nanoparticle. Moreover, it can be seen that, as the HA nanoparticles amount increased, the intensity of the characteristic polymer bands in the composite scaffolds decreased. Notably, the main peaks of PCL/HA scaffolds spectra demonstrated some incorporation of nanoparticle into the polymer matrix and also shown proper mixing of biomaterials for ES process [41,42].
C. Thermal Analysis
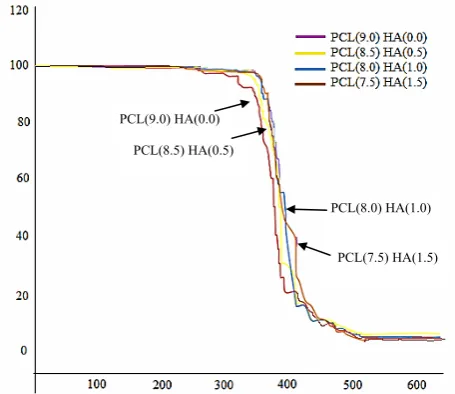
Fig. 8 presents TGA traces for four redesigned electrospun scaffold samples. As can be seen, in TGA curves of all samples there is no significant weight loss up to around 350 °C but adding HA nanoparticles reduced weight loss and increased effective starting temperature for this process. With increasing HA concentration this effect can be seen more clearly which indicates that HA is well dispersed in the polymer matrix. Due to increasing the thermal stability of PCL/HA composite scaffolds in comparison to PCL scaffold, it can be said that this
improved thermal stability is related to incorporation of HA molecules into PCL during the mixing and ES process [8,12]. The major stage of weight loss for the four samples, between 350 and 500 °C, was identified. The residual rates (at 600 °C) were estimated to be about 2%-8% for four samples, respectively. Thus the interface actions between organic PCL and inorganic HA would be beneficial to the enhancement of the thermal stability of PCL/HA scaffolds.
D. Wettability
As explained in this paper, PCL is a hydrophobic polymer which its hydrophobicity is a disadvantage for its cellular reaction [28-30]. So for evaluating the HA nanoparticles’ effect on the hydrophilicity of the PCL scaffold, the water contact angle test was done and its results are listed in Table VI. The increase of surface roughness can improve scaffold hydrophilicity feature [42]. According to Fig. 6, the topography of the scaffold tends to be rougher when HA nanoparticles are added to the PCL scaffold. Adding 0.5, 1.0, and 1.5 w/w% of HA to the PCL scaffold can modify its hydrophilicity by increasing the surface roughness and reducing contact angle to values of 43, 71, and 89°, respectively. Therefore, wettability results moreover show the importance of combining PCL and HA nanoparticles.
E. Tensile Properties
Tensile properties of four redesigned composite scaffolds are listed in Table VI. Adding HA nanoparticles to the PCL scaffold, concentration independently, was reinforced the scaffold strength. Maximum tensile stress and modulus were increased after adding HA nanoparticles; although HA made the composite scaffold more brittle, and reduced its ductility and ultimate elongation. The addition of 0.5, 1.0, and 1.5 w/w% HA nanoparticles to the PCL scaffold increased the stress by 217, 594, and 623%, reduced the scaffolds elongation by 9.9, 17.3, and 27.2%, and simultaneously increased the modulus of the PCL 3, 9, and 14 times, respectively. Thereby it was demonstrated that PCL(9.0) HA(0.0)
PCL(8.5) HA(0.5)
PCL(8.0) HA(1.0)
PCL(7.5) HA(1.5)
Fig. 8. TGA analysis of PCL/HA scaffolds with different HA concentration (0, 0.5, 1.0 and 1.5 w/w %).
No. Sample code Wettability, water contact angle(°) Tensile properties
Stress (MPa) Elongation (%) Modulus (GPa)
1 P9.0H0.0f0.5d16V18 132 0.17±0.27 8.1±0.32 0.03±0.25
2 P8.5H0.5f0.5d16V18 89 0.54±0.33 7.3±0.38 0.09±0.29
3 P8.0H1.0f0.5d16V18 61 1.18±0.31 6.7±0.49 0.28±0.37
4 P7.5H1.5f0.5d16V18 43 1.23±0.56 5.9±0.71 0.42±0.80
TABLE VI
WETTABILITY AND TENSILE PROPERTIES OF COMPOSITE SCAFFOLDS
the introduction of HA improves the strength of the PCL scaffold significantly.
It must be noted that cracks or agglomerating nanoparticles on the surface of scaffold are the proper sites for fracturing [17]. This may negatively affect the tension distribution in scaffolds. So in spite of expecting a positive effect of nanoparticles on tensile properties of scaffolds, the 1.5 w/w% of HA nanoparticles increased the tensile strength just 0.5 MPa in comparing with 1 w/w% of HA. It might be due to nanoparticles tendency for agglomeration which is a challenge in the scaffold ES and can limit its bioapplications.
F. Biological Evaluation of Scaffolds
In implants applications, tissue-engineered scaffold structure and morphology characteristics are very important because the scaffold should provide good osseointegration with surrounding body tissues and desired biocompatibility for the growth promotion of osteoblast cells [34,35]. So the ratio of biomaterials especially nanofillers in ES solution and ES parameters (flow rate, ES distance, and the voltage) should be well controlled to ensure the best biocompatibility for tissue healing. In biological assay for each kind of scaffold 3 samples were tested and the average values were reported.
F.1. MTT Assay
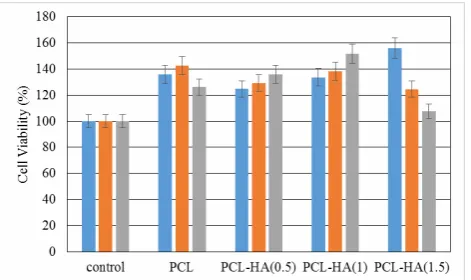
Cytotoxicity of four redesigned scaffolds was evaluated by using MTT assay. The MTT results revealed that the scaffolds materials did not have any toxic effect on cells. The relative density of cells in the scaffolds was compared after 3 days of culture, Fig. 9. All of the three PCL/HA scaffolds exhibited higher cell growth compared to the PCL scaffold. The lowest viability between the three PCL/HA scaffolds belonged to the scaffold with HA nanoparticles concentration of 0.5 w/w%. Osteoblasts showed a higher growth rate on PCL/1.0 w/w% HA scaffold than other samples, confirming that the parameters (concentration, ES parameters) chosen for fabricating composite scaffold were the best.
Fig. 10 shows the cells which were grown over PCL/HA composite scaffolds. The metabolic activity (OD value) of osteoblast cells on different nanofibrous samples increased gradually in comparison with the control group (p<0.05, Fig. 9). That means, these four redesigned scaffolds not only do not have any cellular toxicity but also have proliferative activity. It should be noted that cell attachments and morphology depend on different properties of scaffold, therefore, by adding HA nanoparticles to scaffold and improving the scaffold characteristics (such as surface roughness, porosity, fiber diameter, homogeneity distribution, and etc.) the intracellular responses were improved.
F.2. ALP Activity
ALP activity as a marker of bone metabolism can indicate the mineralization process and the formation of active bone. Cell differentiation as a critical step to obtain bone tissue was assessed with ALP activity of hMSCs cultured on PCL and PCL/HA scaffolds at 1, 3, 7, and 14 days (Fig. 11). During the early stages of osteogenic differentiation, alkaline phosphatase enzyme as a biochemical marker, was expressed by cells. As expected, hMSCs seeded on the Fig. 9. Cell viability of PCL and PCL/HA composite scaffolds with 0.5,
1.0, and 1.5 w/w% of HA nanoparticles in compare with control group which only contains cells.
Fig. 10. Photomicrograph of human osteoblast cells growth over
PCL/HA0.5%, PCL/HA1%, and PCL/HA1.5% composite nanofibers after
PCL/HA scaffolds showed higher ALP activity than those on PCL scaffold. Therefore, the ALP levels increased and showed the osteoblastic differentiation of hMSCs in the culture medium. Consequently, the initial result showed that all scaffolds had a positive effect on ALP activity. It can be seen that P7.5H1.5f0.5d16V18 ALP values between days 7 and
14 were negligible. The ALP activity of P8.0H1.0f0.5d16V18 after 14 days of culture, was 70.2, 22.22, and 1.37% higher than ALP activity of P9.0H0.0f0.5d16V18, P8.5H0.5f0.5d16V18, and P7.5H1.5f0.5d16V18 scaffolds, respectively. Although the result
of ALP activity for P7.5H1.5f0.5d16V18, and P8.0H1.0f0.5d16V18 were near the same at day 14, ALP activity for P8.0H1.0f0.5d16V18
increased with a higher rate than that for P7.5H1.5f0.5d16V18 and it seems the ALP activity increasing in P7.5H1.5f0.5d16V18
was not significantly differed with P8.0H1.0f0.5d16V18 in days 14. These facts confirmed that combining HA and PCL for co-electrospinning and fabricated composite scaffold accelerated stem cells differentiation and could synergistically promote bioactivity of PCL/HA scaffolds.
F.3. Live/Dead Cells
An ideal scaffold for bone tissue engineering applications should enhance cell migration, act as an osteoinductive stimulus to induce differentiate of osteoblasts, induce extracellular matrix (ECM) organization, offer a good substrate for attachment of ECM adhesion protein and promote scaffold-cell interactions. To study the HA nanoparticles impacts to provide the fundamental requirement of composite scaffold implant for bone tissue engineering, and HA role in cellular metabolism, live/dead cells were shown with the fluorescent assay (Fig. 12). The fluorescence signals of the cells showed that more live cells adhered on the sample scaffold. The enhanced cell growth could be seen in all scaffolds. The difference between live cells on the surface of P9.0H0.0f0.5d16V18 and P8.5H0.5f0.5d16V18 was not very significant. On the P8.0H1.0f0.5d16V18 scaffold,
the rate of live cells increased dramatically in culture time and cells were spread on the scaffold’s surface. The red dots showed the dead cells and it seems more red dots were on P7.5H1.5f0.5d16V18 in day 14 than the P8.0H1.0f0.5d16V18 scaffold.
The cell counts at day 14 were not significantly different for P8.0H1.0f0.5d16V18 and P7.5H1.5f0.5d16V18 scaffolds but at day
14 the dead cells increased in P7.5H1.5f0.5d16V18 but the cells growing continued for P8.0H1.0f0.5d16V18 scaffold.
The morphology of the hMSCs cells on the four redesigned scaffolds after 14 days of incubation was examined by SEM (Fig. 13). Due to the composite scaffolds 3D porous architecture, the cells could penetrate into them and the cell adhesion, spread, and proliferated can be seen on the surface of all four evaluated scaffolds. On P8.0H1.0f0.5d16V18, the cells stretched to more regions,
they had better adhesion and proliferation which were in agreement with MTT and live/dead cells test foundations. By doping 0.5 w/w% of HA in the scaffold, the cells spreading improved but it was not as well as 1.0 w/w% of HA nanoparticles. We expected by adding more HA the results came better but in P7.5H1.5f0.5d16V18, there was
some reduction on cell growth which could be due to the nonunion surface caused by HA agglomeration. HA nanoparticles tend to agglomerate and this tendency had a negative effect on transforming of metabolites, oxygen, nutrients and neovascularization for the cellular activities, therefore after 7 days by increasing cell number, dead cells increased with a more increasing rate in P7.5H1.5f0.5d16V18.
Therefore, the 3D porous structure of electrospun composite scaffolds that fabricated with proper biomaterials could offer the attachment, migration, and proliferation of cells as well as ECM. The results of this study showed the dose-dependent effects of HA nanoparticles and ES parameters on PCL scaffolds properties. As a consequence, based on the obtained experimental, studying, and determining ES and solution parameters on ES processing
(b)
Fig. 12. (a) Fluorescent microscopy images of cells grown and (b) cell count number (×105) on PCL/HA scaffolds with 0, 0.5, 1.0, and 1.5 w/w% of HA in different culture times.
and on each other with the help of modeling such as fuzzy model, we can engineer and offer an ideal biocompatible scaffold for cell culture in accordance with human desired properties.
V. CONCLUSION
In this study, we demonstrated that PCL/HA scaffolds could be fabricated by electrospinning method as a high-performance technique by using experimental and modeling studies. First, the parameters including solution and ES parameters should be defined, then upon the experimental result, each parameter affects the process, scaffold properties and other parameters as a cooperation effect, which should be determined. At last with fuzzy modeling, they would take the weight with Shannon entropy, and scaffold with desired end use properties could be designed and fabricated. All these steps were done in this investigation and the results showed that generally, redesigned scaffolds (P9.0H0.0f0.6d16V18, P8.5H0.5f0.5d16V18,
P8.0H1.0f0.6d16V18, and P7.5H1.5f0.5d16V18) had better
morphological properties than their first experimental designed. The initial results showed that more than 1.7 w/w% of HA in ES solution (PCL/HA) created the disorder during the spinning process. Furthermore, 0.5, 1.0, and 1.5 w/w% of HA in PCL/HA composite scaffold were among 10 best-ranked optimized samples. Therefore, 0.5, 1.0, and 1.5 w/w% of HA were added to the PCL/solvent mixture, then ES process was done with 18 kV voltage, 0.5 mL/h flow rate and 16 cm ES distance. All of solutions and parameters determined were upon experimental and fuzzy
modeling results, the resultant scaffolds were evaluated and then tested for characterization. The results showed that adding 1.0 w/w% of HA with defined ES parameters, displayed better properties and gave a PCL/HA scaffold with more roughness, hydrophilic, thermally stable, better strength and modulus properties. The biocompatibility and HA effects on cell biological behavior of scaffold were determined with using MTT assay, live/dead cells and ALP activity. The results showed that PCL/HA (1.0 w/w%) had better cell spread, adhesion, proliferation, and differentiation than others. Thus the combined advantages of high-performance ES designing and PCL/HA scaffold, including porous fibrous 3D structure, better wettability, biocompatibility, and mechanical properties by adding nanofiller (HA nanoparticles), make a kind of fibrous scaffold which is a promising biomaterial for bone tissue engineering application.
APPENDIX A
ES Parameters Effect on Fiber Formation and their Morphology
Flow rate, ES distance, and voltage were three correspondent process variables which had significant effects on processability and the scaffold morphology and properties [43]. The results showed that voltage had direct effects on solution slip from the syringe, Taylor cone
Fig. 13. SEM images of cell differentiation on PCL/HA scaffolds with 0, 0.5, 1.0, and 1.5 w/w% of HA nanoparticles after 14 days of cell culture.
formation, stable jet formation, diameter, and distribution of fiber. Since ES is a process on the electrical field, if the voltage be incorrect the fabricated scaffold would be undesirable. First, the voltage must adjust properly for solution slippage, then it should have enough power for stretching the solution for fiber formation. In Fig. A-1 the compression image of a proper and an improper voltage can be seen. It can be seen an improper voltage made a branched jet which caused fibers with different diameters and as a result decreased scaffold uniformity.
Flow rate had direct effects on an easy solution comes out of a syringe, fiber diameter, uniformity of scaffold, and process speed. If the flow rate be low, the process speed will decrease. On the other hand, the amount of slipped solution would not be enough for ES and discontinues fibers or process problems would occur. Although, high flow rate resulted in more solution slippage, thicker fiber, and process impairment. In Fig. A-2 a high and an improper flow rate and their effects on fiber diameter and distribution
and Taylor cone are shown.
ES distance adjusting had major effects on uniformity and diameter of fibers. In Fig. A-3 the effect of low and high selecting ES distance can be seen. According to Fig. A-3a, more ES distance led to a discontinuity or crack zone in fibers; in Fig. A-3b the thicker fiber diameter due to less ES distance is shown.
The notable point in selecting and determining ES parameters is, these parameters are dependent and have cooperation effects not only between themselves but with ES solution concentration either. Each of these parameters had determined functionality in a specified range, therefore by studying parameters effects on scaffold properties make it possible to engineer the scaffold corresponding to end use. After studying solution and ES parameters, the fuzzy method was used for the process and parameters optimization. The fuzzy modeling results would be used for redesigning the scaffolds corresponding to end use desired properties.
APPENDIX B
The fuzzy VIKOR methodology process of optimizing is shown in the following.
After decision matrix [n×m] formation, data were normalized:
For options with positive effect on results:
(B-1)
For options with negative effect on results:
(B-2)
For weighting normalized matrix, Shannon entropy was used:
(B-3)
(B-4) Fig. A-2. Improper ES flow rate effect on scaffold morphology and uniformity.
Fig. A-3. ES distance effect on scaffold morphology and uniformity: (a)
16 cm and (b) 14 cm (solution concentration, ES flow rate and voltage
were constant).
ij ij
j a n
max a
=
ij ij
j 1 a
n 1
max a
=
ij ij n
ij i 1 a
P ; i, j
a
=
= ∀
∑
1 k(B-5)
Pij is the probability of a given option aij. k is a constant
number that make Ej being in the range of zero to one. Ej shows the quantity of entropy for criteria j.
(B-6)
dj was deviation quantity for criteria j. So for criteria
weighting [37]:
(B-7)
At last the fuzzy optimization was calculated with fuzzy software and the 40 data ranked with this method are listed in Table III.
REFERENCES
[1] M.S. Ghiasi, J. Chen, A. Vaziri, E.K. Rodriguez, and A. Nazarian, “Bone fracture healing in mechanobiological modeling: a review of principles and methods”, Bone Rep., vol. 6, pp. 87-100, 2017.
[2] W.C. Chen, J.C. Chen, C.L. Ko, J.K. Yang, C.L. Huang, C.W. Lou et al., “A comparison of the heat treatment duration and the multilayered effects on the poly(lactic acid) braid reinforced calcium phosphate cements used as bone tissue engineering scaffold”, J.
Ind. Text., vol. 46, pp. 1668-1683, 2016.
[3] K.K. Gomez-Lizarraga, C. Flores-Morales, M.L. Del Prado-Audelo, M.A. Alvarez-Perez, C. Escobedo, and M.C. Pina Barba, “Polycaprolactone- and polycaprolactone/ceramic-based 3D bioplotted porous scaffolds for bone regeneration: a comparative study”,
Mater. Sci. Eng. C, vol. 79, pp. 326-335, 2017. Doi:
10.1016/j.msec.2017.05.003
[4] A.P. Kishan and E.M. Cosgriff-Hernandez, “Recent advancements in electrospinning design for tissue engineering: a review”, J. Biomed. Mater. Res. A, vol. 105, pp. 2892-2905, 2017.
[5] I. Hernandez, A. Kumar, and B. Joddar, “A bioactive hydrogel and 3D printed polycaprolactone system for bone tissue engineering”, Gels, vol. 3, no. 26, 2017. Doi: 10.3390/gels3030026
[6] A. Schindeler, R.J. Mills, J.D. Bobyn, and D.G. Little, “Preclinical models for orthopedic research and bone tissue engineering”, J. Biomed. Mater. Res. A, vol. 36, pp. 832-840, 2017.
[7] R. Rebelo, M. Fernandes, and R. Fangueiro, “Biopolymers in medical implants: a brief review”,
Procedia Engineer., vol. 200, pp. 236-243, 2017.
[8] F. Keivani, P. Shokrollahi, M. Zandi, F. Shokrolahi, and S.C. Khorasani, “Engineered electrospun poly(caprolactone)/polycaprolactone-g -hydroxy-apatite nano-fibrous scaffold promotes human fibroblasts adhesion and proliferation”, Mater. Sci.
Eng. C, vol. 68, pp. 78-88, 2016.
[9] L. Amalorpavamary and V.R. Giri Dev, “Development of biocomposites by a facile fiber spinning technique for nerve tissue engineering applications”, J. Ind.
Text., vol. 46, pp. 372-387, 2015.
[10] I.Y. Enis and T.G. Sadikoglu, “Design parameters for electrospun biodegradable vascular grafts”, J. Ind.
Text., vol. 47, pp. 2205-2227, 2016.
[11] N. Sabetzadeh and A. Gharehaghaji, “How porous nanofibers have enhanced the engineering of advanced materials: a review”, J. Text. Polym., vol. 5, no. 2, pp. 57-72, 2017.
[12] W. Shao, J. He, Q. Han, F. Sang, Q. Wang, L. Chen et al., “A biomimetic multilayer nanofiber fabric fabricated by electrospinning and textile technology from polylactic acid and tussah silk fibroin as a scaffold for bone tissue engineering”, Mater. Sci. Eng. C, vol. 67, pp. 599-610, 2016.
[13] H.M. Pauly HM, D.J. Kelly, K.C. Popat, N.A. Trujillo, N.J. Dunne, H.O. McCarthy et al., “Mechanical properties and cellular response of novel electrospun nanofibers for ligament tissue engineering: effects of orientation and geometry”, J. Mech. Behav. Biomed., vol. 61, pp. 258-270, 2016.
[14] S. Jahnavi, T.V. Kumary, G.S. Bhuvaneshwar, T.S. Natarajan, and R.S. Verma, “Engineering of a polymer layered bio-hybrid heart valve scaffold”, Mater. Sci.
Eng. C, vol. 51, pp. 263–273, 2015.
[15] J. Wang, B. Sun., L. Tian, X. He, Q. Gao, T. Wu et al., “Evaluation of the potential of rhTGF- β3 encapsulated P(LLA-CL)/collagen nanofibers for tracheal cartilage regeneration using mesenchymal stems cells derived from wharton’s jelly of human umbilical cord”, Mater.
Sci. Eng. C, vol. 70, pp. 637–645, 2016.
[16] L. Salmani and M. Nouri, “Electrospun silk fibroin
m j i 1 ij ij E = −k
∑
=[p lnp ]; j∀j j
d 1 E ; j= − ∀
j
j n
j j 1 d
w ; j
d =
= ∀
∑
Criteria
option Criteria 1(X1)
Criteria 2 (X2)
… Criteria n(X n) Option 1 (A1) r11 r12 …. r1n Option 1 (A1) r21 r22 …. r2n
…. …. …. …. ….
Option m (Am) rm1 rm2 …. rmn TABLE B-1
nanofibers with improved surface texture”, J. Text.
Polym., vol. 4, no. 2, pp. 75-82, 2016.
[17] A. Valipouri, “Production scale up of nanofibers: a review”, J. Text. Polym., vol. 5, no. 1, pp. 8-16, 2017. [18] H. Baheri and S.H. Bahrami, “Chitosan/nanosilver
nanofiber composites with enhanced morphology and microbiological properties”, J. Text. Polym., vol. 3, no. 2, pp. 64-70, 2015.
[19] Y.S. More, G. Panella, G. Fioravnti, F. Perrozzi, M. Passacantando, F. Giansanti et al., “Biocompatibility of composites based on chitosan, apatite, and graphene oxide for tissue applications”, J. Biomed. Mater. Res. A, vol. 106, pp. 1585-1594, 2018.
[20] N. Wei, P. Cheng, Z. Xiaojun, C. Liang, W. Weizhong, Z. Yanzhong et al., “Three-dimensional porous scaffold by self-assembly of reduced graphene oxide and nano-hydroxyapatite composites for bone tissue engineering”, Carbon, vol. 116, pp. 325-337, 2017. [21] X. Liu, A. Lee Miller II, B.E. Waletzki, and L.
Lu, “Cross-linkable graphene oxide embedded nanocomposite hydrogel with enhanced mechanics and cytocompatibility for tissue engineering”, J.
Biomed. Mater. Res. A, vol. 106, pp. 1247-1257, 2018.
[22] C.S. Peter and M. Cecilia, “Mesoscale design of multifunctional 3D graphene networks”, Mater.
Today, vol. 19, pp. 428-436, 2016.
[23] S. Sheryas, T.Y. Perry, M.U. Theris, D.C. Sy-Tsong, Y. Letao, and L. Ki-Bum, “Guiding stem cell differentiation into oligodendrocytes using graphene-nanofiber hybrid scaffolds”, Adv. Mater., vol. 26, pp. 3673-80, 2014.
[24] V. Ettorre, P.D. Marco, S. Zara, V. Perrotti, A. Scarano, A.D. Crescenzo et al., “In vitro and in vivo
characterization of graphene oxide coated porcine bone granules”, Carbon, vol. 103, pp. 291-298, 2016. [25] A. Roffi, G.S. Krishnakumar, N. Gostynska, E. Kon, C. Candrian, and G. Filardo, “The role of three-dimensional scaffolds in treating long bone defects: evidence from preclinical and clinical literature- a systematic review”, Biomed. Res. Int., vol. 2017, 2017. Doi: 10.1155/2017/8074178
[26] W. Shiege, H. Fei, L. Jingchao, Z. Shuping, S. Mingwu, H. Mingxian et al., “Design of electrospun nanofibrous mats for osteogenic differentiation of mesenchymal stem cells”, Nanomedicine, vol. 14, no. 7, pp. 2505-2520, 2018.
[27] O. Guillaume, M.A. Geven, C.M. Sprecher, V.A. Stadelmann, D.W. Grijpma, T.T. Tang et al., “Surface-enrichment with hydroxyapatite nanoparticles in stereolithography-fabricated composite polymer scaffolds promotes bone repair”, Acta Biomater., vol.
54, pp. 386-398, 2017.
[28] A. Gholipour-Kanani, A. Samadikuchaksaraeai, and M. Fayyazi, “Biological properties of blend nanofibrous scaffolds from poly(caprolactone)-chitosan-poly(vinyl alcohol)”, J. Text. Polym., vol. 6, no. 1, pp. 3-8, 2018.
[29] M. Fallah, S.H. Bahrami, and M. Ranjbar-Mohammadi, “Fabrication and characterization of PCL/gelatin/ curcumin nanofibers and their antibacterial properties”,
J. Ind. Text., vol. 46, pp. 562-577, 2015.
[30] P. Koushki, S.H. Bahrami, and M. Ranajbar-Mohammadi, “Coaxial nanofibers from poly(caprolactone)/poly(vinylalchohol)/Thyme and their antibacterial properties”, J. Ind. Text., vol. 47, pp. 834-852, 2016.
[31] A. Valipouri and S.A. Hosseini, “Fabrication of biodegradable PCL particles as well as PA66 nanofibers via air-sealed centrifuge electrospinning (ASCES)”, J. Text. Polym., vol. 4, no. 1, pp. 15-19, 2016.
[32] N. Zhang and G. Wei, “Extension of vikor method for decision making problem based on hesitant fuzzy set”,
Appl. Math. Model., vol. 37, pp. 4938-47, 2013.
[33] A.R. Fallahpour and A.R. Moghassem, “Spinning preparation parameters selection for rotor spun knitted fabric using vikor method of multicriteria decision-making”, J. Text. I., vol. 104, pp. 29-39, 2013.
[34] M.T. Chu, J. Shyu, GH. Tzeng, and R. Khosla, “Comparison among three analytical methods for knowledge communities group-decision analysis”,
Expert Syst. Appl., vol. 33, no. 4, pp. 1011-24, 2007.
[35] S. Rahmani, M. Rafizadeh, and F. Afshar Taromi, “Statistical analysis of nanofibers alighnment in magnetic-field-assisted electrospinning including an alignment percentage formula”, J. Appl. Polym., vol. 131, pp. 41179-87, 2014.
[36] A. Shemshadi, H. Shirazi, M. Toreihi, and M.J. Tarokh, “A fuzzy vikor method for supplier selection based on entropy measure for objective weighting”, Expert
Syst. Appl., vol. 38, no. 10, pp. 12160-12167, 2011.
[37] F. Nasiri, S. Ajeli, D. Semnani, M. Jahanshahi, and R. Emadi, “Design, fabrication and structural optimization of tubular carbon/Kevlar/PMMA/ graphene nanoplates composite for bone fixation prosthesis”, Biomed. Mater., vol. 13, no. 4, 2018. Doi: 10.1088/1748-605X/aab8d6
[38] H.C. Liu, J.X. You, X.Y. You, and M.M. Shan, “A novel approach for failure mode and effects analysis using combination weighting and fuzzy vikor method”,
Appl. Soft Comput., vol. 28, pp. 579-588, 2015.
Biomaterial Properties, chapter 2, Springer, 2016. [40] K. Zhang, Y. Fan, N. Dunne, and X. Li, “Effect
of microporosity on scaffolds for bone tissue engineering”, Regen. Biomater., pp. 115-124, 2018. Doi: 10.1093/rb/rby001
[41] M.I. Hassan and N. Sultana, “Characterization, drug loading and antibacterial activity of nanohydroxyapatite/polycaprolactone (nHA/PCL) electrospun membrane”, 3 Biotech., vol. 7, 2017. DOI: 10.1007/s13205-017-0889-0
[42] A. Doustgani, “Effect of electrospinning
process parameters of Polycaprolactone and nanohydroxyapatite nanocomposite nanofibers”, Text.
Res. J., vol. 85, no. 14, pp. 1445-1454, 2015. DOI:
10.1177/00405117514566109