AGRONOMY AND SOILS
Ability of Cotton on the Texas High Plains to Compensate for Pre-bloom Square
Loss and Impact on Yield and Fiber Quality
David L. Kerns*, Dan D. Fromme, Brant A. Baugh, and Tommy Doederlein
D.L. Kerns*, LSU AgCenter, Macon Ridge Research Station, 212A Macon Ridge Road, Winnsboro, LA 71295; D.D. Fromme, LSU AgCenter, Dean Lee Research & Extension Center, 8208 Tom Bowman Drive, Alexandria, LA 71302; B.A. Baugh, Hale Center Coop Supply, 110 E. Stevenson, Hale Center, TX 79041; and T. Doederlein, Texas A&M AgriLife Extension Service, 901-B South Houston, Lamesa, TX 79331 *Corresponding author: [email protected]
ABSTRACT
In the High Plains region of Texas it is not un-usual for cotton (Gossypium hirsutum L.) to suffer pre-bloom fruit loss from insect injury or abiotic factors. The objective of this study was to inves-tigate cotton’s ability to compensate pre-bloom square loss and determine the impact this loss had on yield and fiber quality. Experiments were conducted in Lubbock, TX in 2009, 2010, and 2011 evaluating the impact of 0 to 100% pre-bloom square removal on cotton yield and fiber quality. During 2009 and 2010, cotton was able to either compensate up to 100% pre-bloom fruit loss, or suffered environmentally induced square loss resulting in limited boll carrying capacity that equalized yields and boll density across square removal treatments. If compensation was the rea-son for the lack of differences among treatments, the plants appear to compensate by producing more secondary or tertiary position fruit, as well as retaining additional mid- to upper-canopy fruit. However, evidence suggested that fiber quality may decline in some compensated bolls due to maturity issues. When environmental conditions were harsh, as in 2011, the cotton plant did not appear to be able to compensate fully for yield due to some pre-bloom fruit loss. This was most evident when an early-season termination event, such as a freeze, was simulated. Where cotton was allowed to mature fully, overcompensation was evident in 2011, with the greatest yields occurring at approximately 27% pre-bloom square removal. As with previous years, fiber quality in 2011 might
be impacted adversely from compensated fruit.
C
otton (Gossypium hirsutum L.) is an indeterminate perennial plant that is grown as an annual crop. It sets bolls (fruit) until the leafarea can no longer support additional bolls, fills the
existing bolls while slowing or halting the growth of new leaves and squares (fruiting buds), and then renews growth of leaves and bolls (Mauney, 1986). When fruit is shed, the photo assimilates normally translocated into missing fruiting positions are redirected to other plant sinks. Indeterminate plants, such as cotton, can suffer fruit loss due to insect injury, disease, physical damage, or unfavorable weather. Fruit loss in cotton can alter growth and development. However, indeterminate plants, such as cotton, are better able to withstand limited fruit
loss because these plants flower over a longer period
of time (Pettigrew et al., 1992).
Cotton can recover from a degree of early-season pest damage, often without loss of yield or delay in crop maturity, a process known as compensation (Wilson et al., 2003). Compensation in cotton has been reported following damage by thrips (Sadras and Wilson, 1998; Terry, 1992) and by heliothines(Brook et al., 1992a) and has been reported in a range of other plant species (Trumble et al., 1993). Cotton plants subjected to loss of squares by insect pests during the early growing season subsequently abscised fewer squares and thus retained more fruit later in the growing season (Stew-art and Sterling, 1989; Wilson, 1986). Many factors
influence the ability of cotton to compensate for fruit
loss by square removal (Stewart et al., 2001) such as soil fertility (Guo et al., 1985; Sheng and Ma, 1986), fruit age, injury time and severity, and weather condi-tions (Cox et al., 1990; Hearn and Rosa, 1984; Sadras, 1995). Cotton cultivars (Brook et al., 1992a, b; Mann et al., 1997; Mulrooney et al., 1992), planting density, and number of fruiting branches (Bi et al., 1991) are other key factors affecting the compensation capacity of cotton. Mauney (1984) stated that the yield potential
of cotton depends on retention of first-position bolls
(Guinn, 1982).Moreover, a certain amount of fruit loss early in the season is allowable from the standpoint of being below the economic injury level (Bagwell et al., 1999; Parker et al., 1991; Ring and Benedict, 1993). Bednarz and Roberts (2001) found as the intensity
of early-season flower and square removal increased,
the probability of harvesting a mature boll decreased in the lower canopy but increased in the upper canopy,
which resulted in fewer first-position fruit but more
third-position fruit at harvest. Thus, early-season
re-moval of floral buds resulted in additional seed cotton
production on more apical and distal fruiting positions.
Jones et al. (1996) reported that artificial removal of flowers during early anthesis was compensated for by
an increase in the number of distal and more apical bolls. Pettigrew (1994) found that fruit removal from a sympodium increased boll retention at the remaining
fruiting sites, either at the first or second positions. He
found that fruit removal from sympodia early in the
season increased the mass of bolls at the first position
but not bolls located at the second position. Kerby and
Buxton (1981) studied the influence of boll retention at the first fruiting site on boll retention at the second position. When fruiting structures at the first position
were aborted as a square, retention at the second fruit-ing site increased an average of 17 to 33% relative to
where first-position fruit were retained. Cotton has an
indeterminate growth habit, and the loss of fruiting forms from the earlier positions has resulted in more productive fruiting from later-developed positions that partially to fully compensate for earlier losses (Dale, 1959; Kletter and Wallach, 1982; Ungar et al., 1987).
Loss of fruit from insect, disease, or stress will create an opportunity for compensation where other fruit on the same branch or elsewhere on the plant will survive instead of being shed or grow larger (Constable, 1991; Hearn and Room, 1979; Sadras, 1995).The
loss of fruit from the first position means bolls on the
second or third position will grow larger (Constable, 1991). Sadras (1995)stated that up to 40% of early fruit
can be lost before economic damage can be measured. However, adverse factors associated with compensation are delayed crop maturity, late-season pest problems, and weather related yield loss at harvest (Stewart and Sterling, 1989). Bilbro and Ray (1973) reported that as planting date was delayed, yields, lint percentages,
fiber lengths, and micronaire were reduced, and fiber
strength was increased. Late plantings caused reduced
yields in only one of the three years, did not affect fiber strength, but had lower micronaire and fiber maturity
(Bauer et al., 1998). Porter et al. (1996) planted six
cultivars varying in maturity at planting dates ranging from very early to very late for the Coastal Plain in South Carolina. They reported that as planting was
delayed, fiber strength increased while micronaire de
-creased. They found no effect of planting date on fiber
length. In recent years there has been much research conducted demonstrating the extraordinary capability of cotton to compensate for pre-bloom square loss
due to square feeding insects such as cotton fleahop -per Pseudatomoscelis seriatus (Reuter) and Lygus spp. with little or no on impact yield. Also, windblown sand and sustained cloudy weather often results in the loss of squares in pre-bloom cotton grown on the Texas High Plains. Cotton planting on the Texas High Plains is generally started in late April or early May. However, soil moisture conditions or other factors can prevent planting at this time. Also, during May, thousands of acres of cotton in the area are often destroyed by hail,
blowing soil, flooding, and disease-causing organisms.
Therefore, many acres of cotton might be replanted in the month of June. In some years, cotton planted in
June will not have sufficient time for boll maturation
to occur due to cooler temperatures at the end of the season. For the Texas High Plains, date-of-planting studies have been conducted; however, no information exists regarding late planting coupled with early-season square loss from insects or inclement weather and the
subsequent impact on yield and fiber quality.
Due to the cotton plant’s indeterminate nature to set fruit, it is important to understand the capacity or potential for cotton to compensate or recover from early-season square loss and still have time for boll maturation before the onset of cool temperatures that occur on the Texas High Plains. It is not uncommon for as much as 30% of the High Plains cotton crop to be late planted due to environmental conditions such as lack of precipitation or hail damage. Does cot-ton have the ability to compensate for early-season square loss when the season is shortened due to cool late-season temperatures?
The objectives of this research were: (1) to deter-mine the impact of pre-bloom square loss on the yield of late-planted cotton; (2) if compensation occurs, to determine where compensation occurs on the plant; and (3) to determine the impact of pre-bloom square
loss on fiber quality of late-planted cotton.
MATERIALS AND METHODS
Olton clay loam (fine, mixed, super active, thermic
Aridic Paleustolls) near Lubbock, TX in 2009 to 2011. All three experiments were planted on 102-cm wide rows with an early-mid maturing cultivar, Phy-togen 375WRF (Dow AgroSciences, Indianapolis, IN), on 1 June in 2009 and 2010, and on 16 June in 2011. These dates represent late plantings for the High Plains of Texas. All experiments were irrigated using furrow irrigation as needed to minimize any moisture stress effects on the plots and grown using standard cultural practices as recommended by the Texas A&M AgriLife Extension Service. However, the 2009 experiment did suffer post-bloom
water-deficit stress the last week of June due to irrigation
system mechanical failure and the 2011 experiment
suffered some post-bloom water-deficit stress due
to inability to maintain optimal soil water capac-ity under high temperature and drought conditions. Weather data was obtained from a weather station
located approximately 2 km from the field location
(Table 1). The weather station is operated by the National Oceanic and Atmospheric Administration.
The 2009 and 2010 experiments were randomized complete block designs, whereas the 2011 experiment was conducted as a 2 × 6 factorial randomized com-plete block design. All of the experiments consisted of four replications. Plots for all experiments were a single-row wide by 12.5-m in length. In all experi-ments, during the second week of squaring, plots were uniformly thinned to equivalent stands of 80,667, 64,484, and 74,019 plants ha-1 in 2009, 2010, and 2011
respectively. All abnormally small or deformed plants were removed leaving as uniform a plant population as possible. Thinning dates were 12, 13, and 21 July for 2009, 2010, and 2011, respectively.
Treatments in 2009 consisted of 0, 30, 50, and 100% manual square removal on late-planted pre-bloom cotton. In 2010, the treatments included 0, 20, 40, 60, 80, and 100% manual square removal on late-planted pre-bloom cotton. In 2011, the manual square-removal treatments consisted of 0, 20, 40, 60, 80, and 100% removal on pre-bloom cotton, but were conducted across two main factors; late planted but allowed the remaining full season to mature, and late planted and subjected to early termination as a simulated early freeze.
For all experiments, squares removed within a treatment were chosen using a lottery system. Each square in each plot was counted and numbered. These numbers were then randomized and the ap-propriate percentage removal rate was applied to the
number set beginning with the first number in the
set. Squares slated for removal were then removed
using fine-nosed forceps. Square removal for each
experiment occurred at approximately the 18th day
of squaring, when the cotton was at 13 to 14 node stage. Squares were removed on 12, 13, and 28 July in 2009, 2010, and 2011, respectively.
The 2009, 2010, and the full-season treatments within the 2011 experiment were treated with eth-ephon (Prep; Bayer CropScience, Research Triangle Park, NC) at 2.24 kg a.i. ha-1 12 to 14 d prior to harvest
followed by an application of paraquat dichloride (Gramoxone SL; Syngenta Crop Protection, LLC, Greensboro, NC) at 0.56 kg a.i. ha-1 at approximately
80% open bolls, which was 7 d prior to harvest. The early freeze simulation treatments in the 2011 experi-ment were treated with paraquat dichloride at 0.56 kg a.i. ha-1 at approximately 25% open bolls on 10
October, which coincided with 7 d prior to harvest.
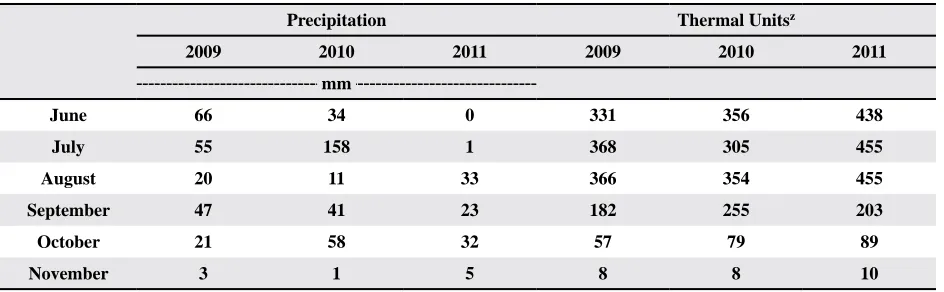
Table 1. Monthly weather summary for 2009, 2010, and 2011 at Lubbock, TXy
Precipitation Thermal Unitsz
2009 2010 2011 2009 2010 2011
mm
June 66 34 0 331 356 438
July 55 158 1 368 305 455
August 20 11 33 366 354 455
September 47 41 23 182 255 203
October 21 58 32 57 79 89
November 3 1 5 8 8 10
RESULTS AND DISCUSSION
2009 Experiment. We were not able to
de-tect any significant differences among pre-bloom
square-removal treatments for yield (Table 2) or any
fiber quality parameters (micronaire, staple length,
uniformity, leaf, and color) with the exception of
fiber strength (Table 3). The reasons for the lack of
differences in yield are not certain, but could include yield compensation or stress-induced limited fruit carrying capacity or a combination of these factors. This experimental site suffered water stress during the last week of June due to delayed irrigation as a result of irrigation system mechanical failure. Other studies also have suggested that very early square loss rarely result in yield reduction (Stewart and Sterling, 1989; Terry, 1992; Wilson, 1986).
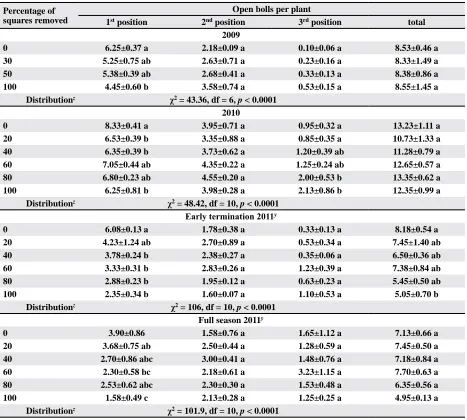
At harvest, plants that had 0% squares removed
had significantly more first-position bolls than plants
where 100% of the squares were removed (Table 4).
Similarly, the frequency of boll distribution (first, sec -ond, and third positions) was different between 0 and
30% square removal (χ2 = 7.349, df = 2, p < 0.0254), 0 and 50% square removal (χ2 = 11.30, df = 2, p < 0.0035), and 0 and 100% square removal (χ2 = 41.38,
df = 2, p < 0.0001). Fruit frequency distribution of the 30 and 50% square-removal treatments were different
from the 100% square removal (χ2 = 14.74, df = 2, p < 0.006 and χ2 = 10.48, df = 7, p < 0.0053, respectively),
but frequency did not differ between 30% and 50%
square removal (χ2 = 0.777, df = 2, p > 0.05).
In each experiment, 10 consecutive plants from each plot were plant mapped and the entire plot was hand harvested. Plant mapping was conducted accord-ing to Bourland and Watson (1990) where open bolls were noted as present or absent for each node and fruiting position on individual plants. Harvesting was conducted on 30 October and 10 November in the 2009 and 2010 experiments, respectively. In 2011, the early freeze simulation plots were harvested on 17 October and the full-season treatments were harvested on 3 November. Samples were ginned at the Texas A&M AgriLife Ginning Facility in Lubbock, TX. Lint samples were submitted to the Fiber and Biopolymer Research Institute at Texas Tech University for HVI analysis, and USDA Commodity Credit Corporation (CCC) loan values were determined for each treatment by plot.
Data were analyzed using GLM and means were separated using an F-protected Tukey’s HSD (p ≤
0.05) (SAS Enterprise Guide, 2010). Fruit distribution analyses were conducted using Chi-square contingency tables (p ≤ 0.05) (GraphPad Prism, 2013). Regression
analyses were conducted using SigmaPlot (SigmaPlot 12: User’s Guide, 2010). Regression analyses were tested for assumptions of linearity using the Spearman rank correlation between the absolute values of the residuals and the observed value of the dependent vari-able, normality was tested using Saprio-Wilk’s test (p < 0.05), and outliers were detected and eliminated based
on Studentized residuals, and disproportional influence
using DFFTTS, Leverage and Cook’s distance tests (SigmaPlot 12: User’s Guide, 2010).
Table 2. Means±SEM, for lint yield, loan value and fiber quality analysis from cotton subjected to four regimes of pre-bloom
square removal in 2009
Percentage of squares removed
Yield (lint-kg ha-1)
Loan value ($ kg-1)
Crop value ($ ha-1)
0 1309.95±90.15 a 1.24±0.01 a 1630.25±126.65 a
30 1295.53±104.10 a 1.22±0.02 ab 1568.84±105.80 a
50 1406.85±50.39 a 1.23±0.01 ab 1734.14±64.17 a
100 1242.46±84.99 a 1.15±0.03 b 1431.10±101.33 a
Means in a column followed by the same letter are not significantly different based on an F-protected Tukey’s HSD Test (p ≥ 0.05).
Table 3. Means±SEM, for lint fiber quality analysis from cotton subjected to four regimes of pre-bloom square removal in 2009
Percentage of squares removed
Micronaire Length (mm)
Uniformity (%)
Strength
(g tex-1) Leaf
Grayness (%Rd)
Yellowness (Hunter’s +b)
0 4.18±0.25 a 28.70±0.37 a 82.2±0.24 a 29.58±0.71 a 2.00±0.00 a 80.78±0.71 a 8.08±0.13 a
30 3.83±0.40 a 28.26±0.30 a 81.45±0.16 a 29.13±0.39 a 2.30±0.30 a 81.1±0.75 a 7.90±0.19 a
50 3.93±0.19 a 28.51±0.28 a 81.85±0.21 a 28.68±0.38 ab 2.30±0.50 a 80.65±0.23 a 7.95±0.06 a
100 3.55±0.37 a 27.94±0.52 a 81.5±0.32 a 27.53±1.54 b 2.30±0.60 a 81.48±0.58 a 7.93±0.16 a
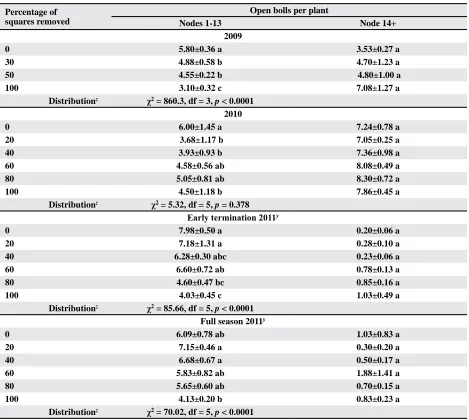
There were also differences in boll distribution vertically within the plant canopy. When looking at the number of fruit at nodes 13 and lower, there
were significantly more bolls where there were no
squares removed relative to the other treatments (Table 5). Although the 30 and 50% square-removal treatments did not differ from each other, both had
significantly more bolls at nodes 13 or lower rela -tive to the 100% removal treatment. There were no differences among treatments in the total number of bolls per plant, suggesting either compensation
in the addition of upper-canopy bolls in the 30, 50, and 100% square removal treatments, or all treat-ments reached a stress-induced boll carrying capac-ity, possibly due to irrigation system malfunction
(Table 4). Vertical distribution of bolls (nodes ≤ 13 vs. nodes ≥ 14) was significantly different (p < 0.0001) with more bolls occupying the upper canopy with increasing levels of square removal (Table 5). These data suggest that boll distribution was affected somewhere between 50 and 100% square loss, and that the vertical distribution and horizontal, fruiting
Table 4. Mean±SEM number of open bolls per plant by lateral branch position subjected to various degrees of pre-bloom
square removal and crop termination
Percentage of squares removed
Open bolls per plant
1st position 2nd position 3rd position total
2009
0 6.25±0.37 a 2.18±0.09 a 0.10±0.06 a 8.53±0.46 a
30 5.25±0.75 ab 2.63±0.71 a 0.23±0.16 a 8.33±1.49 a
50 5.38±0.39 ab 2.68±0.41 a 0.33±0.13 a 8.38±0.86 a
100 4.45±0.60 b 3.58±0.74 a 0.53±0.15 a 8.55±1.45 a
Distributionz χ2 = 43.36, df = 6, p < 0.0001
2010
0 8.33±0.41 a 3.95±0.71 a 0.95±0.32 a 13.23±1.11 a
20 6.53±0.39 b 3.35±0.88 a 0.85±0.35 a 10.73±1.33 a
40 6.35±0.39 b 3.73±0.62 a 1.20±0.39 ab 11.28±0.79 a
60 7.05±0.44 ab 4.35±0.22 a 1.25±0.24 ab 12.65±0.57 a
80 6.80±0.23 ab 4.55±0.20 a 2.00±0.53 b 13.35±0.62 a
100 6.25±0.81 b 3.98±0.28 a 2.13±0.86 b 12.35±0.99 a
Distributionz χ2 = 48.42, df = 10, p < 0.0001 Early termination 2011y
0 6.08±0.13 a 1.78±0.38 a 0.33±0.13 a 8.18±0.54 a
20 4.23±1.24 ab 2.70±0.89 a 0.53±0.34 a 7.45±1.40 ab
40 3.78±0.24 b 2.38±0.27 a 0.35±0.06 a 6.50±0.36 ab
60 3.33±0.31 b 2.83±0.26 a 1.23±0.39 a 7.38±0.84 ab
80 2.88±0.23 b 1.95±0.12 a 0.63±0.23 a 5.45±0.50 ab
100 2.35±0.34 b 1.60±0.07 a 1.10±0.53 a 5.05±0.70 b
Distributionz χ2 = 106, df = 10, p < 0.0001
Full season 2011y
0 3.90±0.86 1.58±0.76 a 1.65±1.12 a 7.13±0.66 a
20 3.68±0.75 ab 2.50±0.44 a 1.28±0.59 a 7.45±0.50 a
40 2.70±0.86 abc 3.00±0.41 a 1.48±0.76 a 7.18±0.84 a
60 2.30±0.58 bc 2.18±0.61 a 3.23±1.15 a 7.70±0.63 a
80 2.53±0.62 abc 2.30±0.30 a 1.53±0.48 a 6.35±0.56 a
100 1.58±0.49 c 2.13±0.28 a 1.25±0.25 a 4.95±0.13 a
Distributionz χ2 = 101.9, df = 10, p < 0.0001
Means in a column within a year/termination, followed by the same letter are not significantly different based on an
F-protected Tukey’s HSD Test (p ≥ 0.05).
z Boll position distribution data analyzed using Chi-square contingency table analyses.
y No significant interaction between termination event and percentage square removal (p = 0.71, p = 0.55, p = 0.77, p =
branch position, were both influenced. The fact that
vertical distribution differs among square-removal treatments is not surprising because lower squares were manually removed. The frequency of bolls in the 100% square-removal treatment were higher on the plant (Table 5)and further out on individual fruiting branches (Table 4). We would expect this
treatment to suffer fiber maturity problems regard -less of yield; yet we did not detect differences among treatments in micronaire (Table 3). However, some linear trends were observed. Micronaire appears to decline in relation to increased square removal
(Table 6). However, where fruit was compensated, the regression of micronaire against percentage fruit retention (based on individual plots) indicates that micronaire declines with higher fruit retention (Fig. 1). Thus the fruit that replaced or compensated for those physically removed tended to have lower micronaire. These data support the hypothesis that stress, due to irrigation equipment malfunction, was limiting boll load capacity resulting in equal yield and boll density across treatments; plots that shed the most upper-canopy fruit (typically low quality bolls), regardless of treatment, had the highest micronaire.
Table 5. Mean±SEM number of open bolls per plant by vertical canopy position subjected to various degrees of pre-bloom
square removal and crop termination
Percentage of squares removed
Open bolls per plant
Nodes 1-13 Node 14+
2009
0 5.80±0.36 a 3.53±0.27 a
30 4.88±0.58 b 4.70±1.23 a
50 4.55±0.22 b 4.80±1.00 a
100 3.10±0.32 c 7.08±1.27 a
Distributionz χ2 = 860.3, df = 3, p < 0.0001
2010
0 6.00±1.45 a 7.24±0.78 a
20 3.68±1.17 b 7.05±0.25 a
40 3.93±0.93 b 7.36±0.98 a
60 4.58±0.56 ab 8.08±0.49 a
80 5.05±0.81 ab 8.30±0.72 a
100 4.50±1.18 b 7.86±0.45 a
Distributionz χ2 = 5.32, df = 5, p = 0.378 Early termination 2011y
0 7.98±0.50 a 0.20±0.06 a
20 7.18±1.31 a 0.28±0.10 a
40 6.28±0.30 abc 0.23±0.06 a
60 6.60±0.72 ab 0.78±0.13 a
80 4.60±0.47 bc 0.85±0.16 a
100 4.03±0.45 c 1.03±0.49 a
Distributionz χ2 = 85.66, df = 5, p < 0.0001
Full season 2011y
0 6.09±0.78 ab 1.03±0.83 a
20 7.15±0.46 a 0.30±0.20 a
40 6.68±0.67 a 0.50±0.17 a
60 5.83±0.82 ab 1.88±1.41 a
80 5.65±0.60 ab 0.70±0.15 a
100 4.13±0.20 b 0.83±0.23 a
Distributionz χ2 = 70.02, df = 5, p < 0.0001
Means in a column within a year/termination, followed by the same letter are not significantly different based on an
F-protected Tukey’s HSD Test (p ≥ 0.05).
z Boll position distribution data analyzed using Chi-square contingency table analyses.
y No significant interaction between termination event and percentage square removal (p = 0.15, p = 0.74 for Nodes 1-13
As previously noted, the 100% square-removal
treatment had lower fiber strength relative to the
other treatments (Table 3). These data suggest that some compensation was occurring and that the com-pensated bolls tended to be less mature and suffered
lower fiber strength. Fiber strength was the primary
parameter affecting loan values (Table 2), although the 100% square-removal treatment was the only treatment that statistically differed from the 0% square removal, having a lower loan value.
2010 Experiment. The results in 2010 were similar
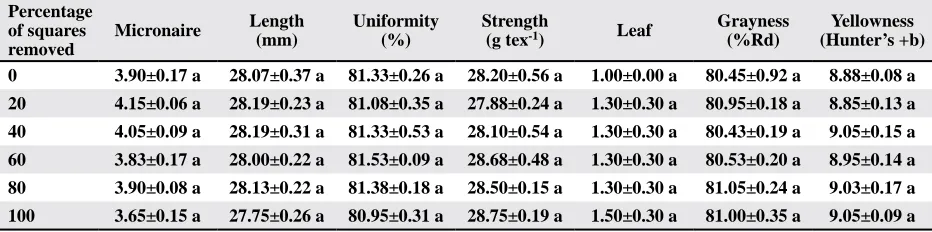
to the findings in 2009; we could not detect any dif -ferences in yield among the treatments (Table 7). Ad-ditionally, we could not detect any differences among
treatments for any of the fiber quality measurements
(Table 8). However, unlike 2009, there was no linear
relationship between micronaire and the percentage of squares removed (Table 6), or for micronaire and percentage fruit retention (Fig. 2). Although plots had as much as 100% of their early squares removed, there
were no significant differences among treatments in the
total number of bolls produced (Table 4). There were
differences among treatments in the number of first- and
third-position bolls, and fruiting frequency
distribu-tion among treatments. There were more first-posidistribu-tion
bolls where no squares were removed, no differences in second-position squares, and it appeared that third-position squares increased relative to the number of squares removed. This is also evident when comparing boll distribution among square-removal treatments, with more second- and third-position bolls being pres-ent with increasing square removal.
Figure 1. Linear relationship by plot between percent fruit
retention and fiber micronaire, 2009.
Y = 6.41 - 0.06X r2 = 0.83
P < 0.0001
Percent fruit retention
30 40 50 60
M
ic
ronaire
2.5 3.0 3.5 4.0 4.5 5.0
Table 6. Results of regression analyses between the mean percentages of squares removed from pre-bloom cotton (X) and
fiber micronaire (Y)
Experiment F Pr > F r2 df Regression equation Slope SEM
2009 13.42 0.0671 0.87 3 Y = 4.13 – 0.0058X 0.0016
2010 3.47 0.1359 0.47 6 Y = 4.07 – 0.0032X 0.0017
2011, early termination 5.97 0.071 0.60 6 Y = 4.13 – 0.0009X 0.0042 2011, full season 23.57 0.0083 0.86 6 Y = 4.47 – 0.0086X 0.0018
Table 7. Means±SEM, for lint yield, loan value and crop value from cotton subjected to four regimes of pre-bloom square
removal in 2010
Percentage of squares removed
Yield (lint-kg ha-1)
Loan value ($ kg-1)
Crop value ($ ha-1)
0 1325.98±130.12 a 1.23±0.01 a 1637.05±170.07 a
20 1500.43±185.62 a 1.25±0.01 a 1871.16±238.31 a
40 1555.78±158.57 a 1.25±0.01 a 1940.77±197.82 a
60 1461.20±102.47 a 1.24±0.03 a 1806.95±133.13 a
80 1556.65±96.12 a 1.25±0.00 a 1939.14±116.24 a
100 1438.59±183.21 a 1.21±0.02 a 1759.06±255.46 a
Means in a column followed by the same letter are not significantly different based on an F-protected Tukey’s HSD Test (p ≥ 0.05).
Y = 3.87 + 0.001x r2 = na
P = 0.85
Percent fruit retention
20 40 60 80
M
ic
ronaire
3.2 3.4 3.6 3.8 4.0 4.2 4.4
Figure 2. Non-linear relationship by plot between percent
We also detected differences among treatments in the number of bolls within nodes 1 to 13; likely due to square removal in that zone (Table 5), but were un-able to detect a difference in the frequency distribution among treatments for fruiting in nodes 1 to 13 and upper fruit. However, if the plants compensated by adding second- and third-position squares, primarily in the lower canopy, one would expect there to be no differences. It is likely that cotton in 2010 was able to fully compensate for early-season square loss because the growing season was marked by wet weather in June and July, dry conditions in August, and a prolonged warm fall (Table 1). Thus, in an irrigated environment the possibility of achieving full compensation for yield
and fiber maturity was high during this year. If fruit
compensation is the reason for the lack of yield dif-ferences, it appears that compensation was achieved primarily by adding fruit to replace missing fruit rather than increasing the size or quantity of the surviving fruit. Regardless of whether or not the treatments yielded similarly due to compensation or equalizing carrying capacity, the prolonged growing conditions enabled
sufficient crop maturity across all treatments.
2011 Experiment. The 2011 growing season was marked by extreme hot and dry weather conditions throughout the season, causing yields across the region to be substantially reduced relative to previous years (Table 1). Even though there was a prolonged warm fall that facilitated cotton maturation, the possibility of
achieving full compensation for yield and fiber maturity was not realized, which could have been influenced by post-bloom water-deficit stress. We detected dif -ferences in yield between termination treatments (p = 0.0019) and among the percent square-removal treat-ments across termination treattreat-ments (p = 0.0001) (Table 9). Regression analyses demonstrated the importance of protecting early fruit for yield in a shortened growing season (Fig. 3) and that cotton can overcompensate up to 50% square loss with peak yields obtained at about
27% square loss where cotton is given sufficient time
to mature (Fig. 4). Overcompensation of fruit and yield from early-season fruit loss has been demonstrated in a number of plant species including cotton (Belsky et al., 1993; da Costa et al., 2011; Li et al., 2003). Following fruit loss, the reason for overcompensation can be due to increases in total leaf area subsequent photosynthetic activity (Li et al., 2003).
Figure 3. Linear relationship by plot between pre-bloom square removal and mean lint yield in early-terminated cotton, 2011.
Table 8. Means±SEM, for lint fiber quality analysis from cotton subjected to four regimes of pre-bloom square removal in 2010
Percentage of squares removed
Micronaire Length (mm)
Uniformity (%)
Strength
(g tex-1) Leaf
Grayness (%Rd)
Yellowness (Hunter’s +b)
0 3.90±0.17 a 28.07±0.37 a 81.33±0.26 a 28.20±0.56 a 1.00±0.00 a 80.45±0.92 a 8.88±0.08 a
20 4.15±0.06 a 28.19±0.23 a 81.08±0.35 a 27.88±0.24 a 1.30±0.30 a 80.95±0.18 a 8.85±0.13 a
40 4.05±0.09 a 28.19±0.31 a 81.33±0.53 a 28.10±0.54 a 1.30±0.30 a 80.43±0.19 a 9.05±0.15 a
60 3.83±0.17 a 28.00±0.22 a 81.53±0.09 a 28.68±0.48 a 1.30±0.30 a 80.53±0.20 a 8.95±0.14 a
80 3.90±0.08 a 28.13±0.22 a 81.38±0.18 a 28.50±0.15 a 1.30±0.30 a 81.05±0.24 a 9.03±0.17 a
100 3.65±0.15 a 27.75±0.26 a 80.95±0.31 a 28.75±0.19 a 1.50±0.30 a 81.00±0.35 a 9.05±0.09 a
Means in a column followed by the same letter are not significantly different based on an F-protected Tukey’s HSD Test (p ≥ 0.05).
Percentage squares removed
0 20 40 60 80 100
0 200 400 600 800 1000 1200 1400
Y = 1084.40 - 6.67x r2 = 0.70
P < 0.0001
Yi
el
d (
kg
-li
nt h
a
-1)
Percentage squares removed
Y = 1003.91 + 4.55X - 0.087X2 r2 = 0.50
P = 0.0007
0 20 40 60 80 100
400 600 800 1000 1200 1400 1600
Yi
el
d (
kg
-li
nt h
a
-1)
Among square-removal treatments there were
significant differences for total number of harvest -able bolls per plant in the early-terminated plots,
whereas there were no significant differences in
the full-season plots (Table 4). Where the growing season was abbreviated and the crop was terminated early, the differences in yield appeared to be caused
by differences in the number of first-position bolls
from the lower nodes of the plant (Tables 4 and 5). Conversely, for the treatment that was not ter-minated early, lost fruit was compensated with an increase in second- and third-position harvestable bolls (Table 4).
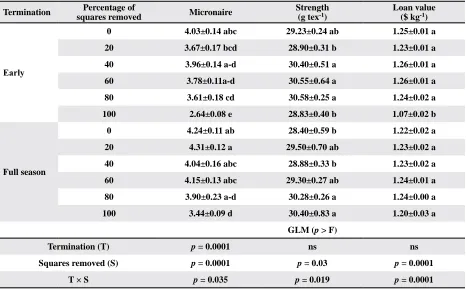
In 2011, differences in fiber quality between cotton
subjected to the simulated early termination relative to full season, albeit late planted, varied depending on
spe-cific fiber parameters (Tables 9 and 10). Early terminated cotton had significantly higher fiber length and unifor -mity, and better color grades (Table 9). Early-season termination resulted in an average increase of 0.78 mm
and 0.89% in fiber length and uniformity, relative to the
full-season cotton. Additionally, early terminated cotton exhibited better color grade parameters than full-season cotton with a 2.35% increase in Rd and a 0.32% decrease in +b, resulting in grades of white, good middling (11-2), and white strict middling (21-3), respectively. There
was a significant interaction between termination event and percentage square removal for fiber micronaire and strength, which resulted in the significant interaction for
loan values (Table 10). Early terminated cotton exhibited a curvilinear increase in mironaire with increasing per-centage fruit retention plateauing at approximately 35% fruit retention (Fig. 5). Lower micronaire is indicative
of immature cotton fibers and suggests that bolls did not have sufficient time to fully mature; particularly
in the early-termination plots (Quisenberry and Kohel, 1975). This is not uncommon for cotton with a truncated growing season, especially for fruit produced later in the season (i.e., third-position bolls). However, with the above-normal heat unit accumulation in 2011 (Table 1), micronaire was not a major issue for the early terminated cotton; with the 100% square-removal treatment being the only treatment falling in the low micronaire discount range (Table 10). Conversely, where plants maintained their fruit load and had the full season to mature, micro-naire values in the premium range were observed.
How-ever, micronaire values did exhibit a significant trend
towards higher values with increasing fruit retention (Fig.
6). Full-season plots also tended to suffer reduced fiber
strength where fewer squares were removed. Pettigrew
et al. (1992) reported that square removal did not influ
-ence fiber strength except where first-position squares
remained. In our study, early-terminated cotton had
fairly uniform fiber strength among the square-removal treatments, and we detected no significant difference in
strength between the early termination and full season (p > 0.05). However, others studies have reported
in-creased fiber strength where cotton is terminated early
(Fromme et al., 2014; Gwathnmey et al., 2004; Snipes and Baskin, 1994).
Figure 5. Curvilinear relationship by plot between percent
fruit retention and fiber micronaire in cotton subjected to
early termination, 2011.
Y = -50.16 + 54.02(1 - 0.84x)
r2 = 0.58
P = 0.0159
Percent fruit retention
10 20 30 40 50 60 70
M
ic
ronaire
2.0 2.5 3.0 3.5 4.0 4.5
Y = 3.34 + 0.18x r2 = 0.51
P = 0.0107
Percent fruit retention
10 20 30 40 50 60 70
M
ic
ronaire
3.0 3.2 3.4 3.6 3.8 4.0 4.2 4.4 4.6 4.8
Figure 6. Linear relationship by plot between percent fruit
retention and fiber micronaire in full season cotton, 2011. Significant differences in loan values among treat -ments were slight (Table 10). Only the 100% square-removal treatment from the early-terminated plots
was significantly different from all other treatments
from both termination events. This demonstrates that under the environmental conditions experienced in 2011, where maturity was accelerated, the bolls that were harvestable reached adequate maturity. Thus total
crop value was influenced more by yield than by loan
Table 9. Means±SEM, for lint fiber quality analysis, yield and crop value from cotton subjected to four regimes of pre-bloom square removal in 2011, where no significant (p ≥ 0.05) interactions were detected between termination and percentage of
squares removed
Factor Length
(mm)
Uniformity
(%) Leaf
Grayness (%Rd)
Yellowness (Hunter’s +b)
Yield (lint-kg ha-1)
Crop value ($ ha-1)
Termination Early 28.55±0.14 a 81.56±0.22 a 1.20±0.09 a 81.66±0.20 a 9.08±0.06 b 751.84±59.24 b 924.53±76.14 b Full-season 27.77±0.15 b 80.67±0.22 b 1.40±0.13 a 79.31±0.18 b 9.40±0.05 a 910.67±49.40 a 1121.42±63.80 a
Percentage of squares removed
0 27.97±0.20 a 80.64±0.35 a 1.50±0.27 a 80.21±0.48 b 9.09±0.08 b 1028.20±66.74 a 1273.62±88.27 a
20 27.88±0.25 a 80.60±0.21 a 1.50±0.27 a 80.33±0.74 b 9.01±0.10 b 999.90±62.09 a 1225.29±76.80 a
40 28.15±0.19 a 81.18±0.49 a 1.40±0.20 a 80.28±0.52 b 9.21±0.08 ab 982.57±106.23 a 1225.53±134.67 a
60 28.32±0.35 a 80.98±0.50 a 1.10±0.13 a 80.04±0.47 b 9.40±0.12 a 817.02±66.93 ab 1021.25±81.98 ab
80 28.58±0.32 a 81.64±0.26 a 1.10±0.13 a 80.49±0.51 ab 9.26±0.12 ab 649.16±64.45 abc 802.17±78.75 bc
100 28.07±0.32 a 81.66±0.49 a 1.30±0.16 a 81.58±0.43 a 9.48±0.07 a 510.68±56.67 c 589.96±77.38 c
GLM (p > F)
Termination (T) p = 0.001 p = 0.004 ns p = 0.0001 p = 0.0001 p = 0.0019 p = 0.0023
Squares removed (S) ns ns ns p = 0.0026 p = 0.0001 p = 0.0001 p = 0.0001
T × S ns ns ns ns ns ns ns
Means in a column within a factor followed by the same letter are not significantly different based on an F-protected
Tukey’s HSD Test (p ≥ 0.05).
Table 10. Means±SEM, for lint fiber quality analysis, yield and crop value from cotton subjected to four regimes of pre-bloom square removal in 2011, where significant (p < 0.05) interactions were detected between termination and percentage of
squares removed
Termination Percentage of
squares removed Micronaire
Strength (g tex-1)
Loan value ($ kg-1)
Early
0 4.03±0.14 abc 29.23±0.24 ab 1.25±0.01 a
20 3.67±0.17 bcd 28.90±0.31 b 1.23±0.01 a
40 3.96±0.14 a-d 30.40±0.51 a 1.26±0.01 a
60 3.78±0.11a-d 30.55±0.64 a 1.26±0.01 a
80 3.61±0.18 cd 30.58±0.25 a 1.24±0.02 a
100 2.64±0.08 e 28.83±0.40 b 1.07±0.02 b
Full season
0 4.24±0.11 ab 28.40±0.59 b 1.22±0.02 a
20 4.31±0.12 a 29.50±0.70 ab 1.23±0.02 a
40 4.04±0.16 abc 28.88±0.33 b 1.23±0.02 a
60 4.15±0.13 abc 29.30±0.27 ab 1.24±0.01 a
80 3.90±0.23 a-d 30.28±0.26 a 1.24±0.00 a
100 3.44±0.09 d 30.40±0.83 a 1.20±0.03 a
GLM (p > F)
Termination (T) p = 0.0001 ns ns
Squares removed (S) p = 0.0001 p = 0.03 p = 0.0001
T × S p = 0.035 p = 0.019 p = 0.0001
CONCLUSIONS
The impact of pre-bloom fruit loss in cotton pro-duced in the High Plains region of Texas is highly de-pendent upon the proportion of squares lost, the length of the growing season, and biotic and abiotic conditions throughout the growing season. In experiments con-ducted in Lubbock, TX over a 3-yr period, during two out of three years cotton was able to either compensate up to 100% pre-bloom fruit loss, or suffered environ-mentally induced square loss that equalized treatments across square removal regimes. If compensation was the reason for the lack of differences among treatments, the plants appear to compensate by producing more second- or third-position fruit as well as retaining ad-ditional mid- to upper-canopy fruit. However, there
was evidence that fiber quality can be lower in some
compensated bolls due to decreased maturity. When environmental conditions were harsh, as experienced in 2011, the cotton did not fully compensate for yield due to some pre-bloom fruit loss and this was most evi-dent in the early-season termination treatment. Where cotton was allowed to fully mature, overcompensation was evident in 2011, with the greatest yields occurring at approximately 27% pre-bloom square removal. As
with previous years, fiber quality can be impacted
adversely from compensated fruit. Thus, in environ-ments where early termination events are uncommon, unless environmental conditions are extremely harsh as experienced in Texas in 2011, pre-bloom square loss as high as 100% might not impact economically the end of season crop value. Thus, the risk of losing pre-bloom squares to insect predation and shed might not be as important as traditionally emphasized.
ACKNOWLEDGMENT
Supported in part by the Plains Cotton Improve-ment Program.
DISCLAIMER
Trade names of commercial products included only for better understanding and clarity. Reference to commercial products or trade names is made with the understanding that no discrimination is intended and no endorsement by the Texas A&M University System or LSU AgCenter is implied. Readers should realize that results do not necessarily represent con-clusive evidence that the same response would occur where conditions vary.
REFERENCES
Bagwell, R.D., B.R. Leonard, G. Burris, and S. Micinski. 1999. Cotton insect control 1999. La Coop Ext. Publ. 1083.
Bauer, P.J., O.L. May, and J. J. Camberato. 1998. Planting date and potassium fertility effects on cotton yield and
fiber properties. J. Prod. Agric. 11(4):415–420.
Bednarz, C.W., P.M. Roberts. 2001. Spatial yield
distribu-tion in cotton following early-season floral bud removal. Crop Sci. 41:1800–1808.
Belsky, A.J., W.P. Caarson, C.L. Jensen and G.A. Fox. 1993. Overcompensation by plants: herbivore optimization or
red herring? Evolutionary Ecol. 7: 109–121.
Bi, C.P., Q.H. Yang, and M.X. Zhou. 1991. A mathematical mode of cotton compensation for cotton bollworm dam-age. (In Chinese with English abstract). Acta
Phyto-phylacica Sin. 18:11–17.
Bilbro, J.D., and L.L. Ray. 1973. Effect of planting date on
the yield and fiber properties of three cotton cultivars. Agron. J. 65:606–609.
Brook, K.D., A.B. Hearn, and C.F. Kelly. 1992a. Response of cotton, Gossypium hirsutum L., to damage by insect pests in Australia: Manual simulation of damage. J. Econ.
Entomol. 85:1368–1377.
Brook, K.D., A.B. Hearn, and C.F. Kelly. 1992b. Response of cotton, Gossypium hirsutum L., to damage by insect pests in Australia: Compensation for early season fruit
damage. J. Econ. Entomol. 85:1378–1386.
Bourland, F.M. and C.E. Watson. 1990. COTMAP, a tech-nique for evaluating structure and yield of cotton plants.
Crop Sci. 30:224–226.
Constable, G.A. 1991. Mapping the production and survival
of fruit on field-grown cotton. Agron. J. 83:374–378.
Cox, P.G., S.G. Marsden, K.D. Brook, H. Talpaz, and A.B. Hearn. 1990. Economic optimization of Heliothis thresh-olds on cotton using the SIRATAC pest management
model. Agric. Syst. 35:157–171.
da Costa, V.A., J.T. Cothren, and J.B. Bynum. 2011. Abiotic stress effects on plant growth and yield components of
1-MCP treated cotton plants. Agron. J. 103:1591–1596.
Dale, J.E. 1959. Some effects of continuous removal of
floral buds on the growth of the cotton plant. Ann. Bot. 23:636–649.
Fromme, D.D., J.T. Cothren, R.G. Lemon, and J. Bynum. 2014. Effect of an upper temperature threshold on heat
GraphPad Prism. 2013. Version 6.00 for Windows. GraphPad Software, La Jolla, CA.
Guinn, G. 1982. Causes of square and boll shedding in cotton.
USDA Tech. Bull. No. 1672. U.S. Gov. Print. Office,
Washington, D.C.
Guo, Y.Y., W.G. Wang, and H. Wang. 1985. On the damage and economic threshold of cotton bollworm (Heliothis armigera Hubner.) to cotton. (In Chinese with English
abstract.) Acta Phytophylacica Sin. 12:261–268.
Gwathmey, C.O., C.W. Bednarz, D.D. Fromme, E.M. Holman, and D.K. Miller. 2004. Response to defoliation timing
based on heat-unit accumulation in diverse field environ
-ments. J. Cotton Sci. 8:142–153.
Hearn, A.B., and G.D. Rosa. 1984. A simple model for crop management application for cotton (Gossypium hirsutum
L.). Field Crops Res. 12:49–69.
Hearn, A.B., and P.M. Room. 1979. Analysis of crop
develop-ment for cotton pest managedevelop-ment. Prot. Ecol. 1:265–277.
Jones, M.A., R. Wells, and D.S. Guthrie. 1996. Cotton
re-sponse to seasonal patterns of flower removal: II. Growth and dry matter allocation. Crop Sci. 36:639–645.
Kerby, T.A., and D.R. Buxton. 1981. Competition between
adjacent fruiting forms in cotton. Agron. J. 73:867–871.
Kletter, E., and D. Wallach. 1982. Effects of fruiting form re-moval on cotton reproductive development. Field Crops
Res. 5:69–84.
Li, Y., W. Xuan, H. Wang, and C. Sheng. 2002. Physiological mechanism of over-compensation by cotton plants for simulated bollworm infestation on early squares. Acta
Entomologica Sin. 46:267–271.
Mann, J.E., S.G. Turnipseed, M.J. Sullivan, J.A Durant, and
O.L. May. 1997. Effects of early-season loss of flower
buds on yield, quality, and maturity of cotton in South
Carolina. J. Econ. Entomol. 90:1324–1331.
Mauney, J.R. 1984. Cotton square shedding. Why they fall;
what it means to yields. Crop Soils 37:20–22.
Mauney, J.R. 1986. Vegetative growth and development of
fruiting sites. p. 11–28. In J.R. Mauney and J.M. Stewart (ed.). Cotton Physiology. The Cotton Foundation, Mem-phis, TN.
Mulrooney, J.E., W.L. Parrott, and J.N. Jenkins. 1992. Response of cotton to damage by tobacco budworm (Lepidoptera:Noctuidae): Changes in fruit distribution. J.
Econ. Entomol. 85:981–986.
Parker, R.D., R.L. Huffman, and C.G. Sansone. 1991. Man-agement of cotton insects in the southern, eastern, and blackland areas of Texas. Texas Agric. Ext. Bull. 1204.
Pettigrew, W.T., J.J. Heitholt, and W.R. Meredith. 1992. Early
season floral bud removal and cotton growth, yield, and fiber quality. Agron. J. 84:209–214.
Pettigrew, W.T. 1994. Source-to-sink manipulation effects on cotton lint yield and yield components. Agron. J.
86:731–735.
Porter, P.M., M.J. Sullivan, and L.H. Harvey. 1996. Cotton cultivar response to planting date on the southeastern
Coastal Plain. J. Prod. Agric. 9:223–227.
Quisenberry, J.E., and R.J. Kohel. 1975. Growth and
devel-opment of fiber and seed in upland cotton. Crop Sci. 15:463–467.
Ring, D.R., and J.H. Benedict. 1993. Comparison of insect injury-cotton yield response functions and economic injury levels for Helicoverpa zea and Heliothis virescens (Lepidoptera:Noctuidae) from the lower gulf coast of
Texas. J. Econ. Entomol. 86:1228–1235.
Sadras, V.O. 1995. Compensatory growth in cotton after loss
of reproductive organs. Field Crops Res. 40:1–18.
Sadras, V.O., and L.J. Wilson. 1998. Recovery of cotton crops after early season damage by thrips (Thysanoptera).
Crop Sci. 38:399–409.
SigmaPlot 12: User’s Guide. 2010. Sysstat Software, Inc., San Jose, CA.
SAS Institute. 2004. SAS System for Windows, Version 9.1. SAS Institute, Cary, NC.
Sheng, C.F., and S.J. Ma. 1986. Econ-ecological benefit of
manual removal of squares during the 2nd generation
cotton bollworm (Heliothis armigera). (In Chinese with
English abstract.) Acta Ecol. Sin. 6:148–157.
Snipes, C.E., and C.C. Baskin. 1994. Influence of early defo
-liation on cotton yield, seed quality, and fiber properties. Field Crop Res. 37:137–143.
Stewart, S.D., and W.L. Sterling. 1989. Causes and temporal patterns of cotton fruit abscission. J. Econ. Entomol.
82:954–959.
Stewart, S.D., M.B. Layton, M.R. Williams, D. Ingram, and W. Maily. 2001. Response of cotton to pre-bloom square
loss. J. Econ. Entomol. 94:388–396.
Terry, L.I. 1992. Effect of early season insecticide use and
square removal on fruiting patterns and fiber quality of cotton. J.Econ. Entomol. 85:1402–1412.
Trumble, J.T., D.M. Kolodny Hirsh, and I.P. Ting. 1993. Plant compensation for arthropod herbivory. Ann. Rev.
Ento-mol. 38:93–119.
Ungar, E.D., D. Wallach, and E. Kletter. 1987. Cotton
Wilson, L.T. 1986. The compensatory response of cotton to
leaf and fruit damage. p. 149–152. In Proc. Beltwide Cotton Prod. Res. Conf., Las Vegas, NV. 4-9 Jan. 1986. Natl. Cotton Counc. Am., Memphis, TN.
Wilson, L.J., V.O. Sadras, S.C. Heimoana, and D. Gibb. 2003. How to succeed by doing nothing: Cotton compensa-tion after simulated early season pest damage. Crop Sci.