115 1. Introduction
It is a well-known fact that solar resource or solar radiation varies spatially as well as temporally across the face of the earth [1]. Hence, resource assessment is a preliminary step for all solar applications. Information about solar radiation on the earth’s surface is required for many applications. In many applications of solar energy [2], by solar engineers, architects, meteorologists, agriculturists and hydrologists a reasonably accurate information about the availability of solar resources is a requirement at any desired site [3]. Solar Radiation and Sunshine duration are two of the most important variables in the energy budget of the earth. They play an important role in the performance evaluation of renewable energy systems [4]. In many applications of solar energy, the most important parameters that are often required are the daily short and long wave solar
radiation. In spite of its importance, solar radiation is not widely measured compared to other meteorological data [5]. For this reason, there have been attempts at estimating it from theoretical models. Many empirical solar radiation models based on meteorological data have been discussed for estimation of global solar radiation it is Depending on the latitude, altitude and many meteorological factors [6]. The solar radiation modeling has shown significant progress in recent decades, reaching at present integration in
geographic information systems that allow
quantification at its spatial distribution [7].
Several empirical models have been used to calculate solar radiation, utilizing available meteorological, geographical and climatologically parameters such as sunshine hours, latitude, relative humidity, air temperature, precipitation, cloudiness. The most commonly used parameter for
Click here, type the title of your paper, Capitalize first letter of each words
First Author
a, Second Author
b,*aFirst affiliation, Address, City and Postcode, Country b
Second affiliation, Address, City and Postcode, Country
Journal of Solar Energy Research Vol 3 No 2 (2018) 115-121
Journal of Solar Energy Research (JSER)
Journal homepage: jser.ir
A B S T R A C T
Click here and insert your abstract text. Click here and insert your abstract text. Click here and insert your abstract text. Click here and insert your abstract text. Click here and insert your abstract text. Click here and insert your abstract text. Click here and insert your abstract text. Click here and insert your abstract text. Click here and insert your abstract text. Click here and insert your abstract text. Click here and insert your abstract text. Click here and insert your abstract text. Click here and insert your abstract text. Click here and insert your abstract text. Click here and insert your abstract text. Click here and insert your abstract text. Click here and insert your abstract text. Click here and insert your abstract text. Click here and insert your abstract text. Click here and insert your abstract text. Click here and insert your abstract text Click here and insert your abstract text Click here and insert your abstract text Click here and insert your abstract text Click here and insert your abstract text Click here and insert your abstract text Click here and insert your abst
© 2013Published by University of Tehran Press. All rights reserved.
ARTICLE INFO Received:
Received in revised form: Accepted:
Available online:
Keywords:
Type 3-6 keywords here,
separated by semicolons ;
Evaluation of optimal model for estimating solar radiation in a moderate and
mountainous area based on climatical data (Case Study: Kermanshah, Iran)
M.M. Moghadasi
Department of architecture, Qasr-e shirin branch, Islamic azad university, Qasr -e shirin, Iran *Email:[email protected]
Journal of Solar Energy Research (JSER)
Journal homepage: www.jser.ut.ac.ir
A B S T R A C T
The solar radiation received by earth surface is one of the most applicable parameter that is usable in hydrology, agriculture, architecture and passive houses, climatology and meteorological modeling. Many different experimental equations had been suggested by researchers to estimate this parameter in different climates. This study aimed to calibrate existing model and develop a new model for estimating global solar radiation data using commonly and available measured meteorological records such as two well-known solar radiation models Angstrom-Prescott and Allen were calibrated and eight new empirical global solar radiation models were developed. Three statistical parameters Root Mean Square Error (RMSE), Nash-Sutcliffe equation (NSE) and Mean Bias Error (MBE) have been used to estimate error and model validation. The results showed that, the value of RMSE, NSE, MBE and Rs2 for Rs3 model got the highest rank with 44.59, 43.36, -594.92 and 0.9933, respectively. All models were calibrated based on available meteorological data and sunshine hours and validated using daily measured solar radiation
© 2018 Published by University of Tehran Press. All rights reserved.
ARTICLE INFO
Received: 28 Jun 2018 Received in revised form: 15 Jul 2018
Accepted: 3 Aug 2018 Available online: 8 Aug 2018
Keywords:
116 estimating global solar radiation is sunshine duration [8] and sun shine hours [9]. There is a range of estimation methods, the firsts uses formulations that seek empirical parameterization
of the local physical conditions, using
measurements in this field, from which
quantitatively describes the optical characteristics of the air by simple equations and attenuation of solar radiation on the surface [10]. This study evaluating of optimal model to find the best intensity of solar radiation in Kermanshah [11], The reason for this approach comes from the fact that the air temperature and humidity is worldwide measured meteorological parameters, and is used by several authors in solar radiation estimation techniques. The objectives of this study were to compare, calibrate and validate existing solar radiation models to predict solar global radiation from available meteorological data [12].
2. Study Area
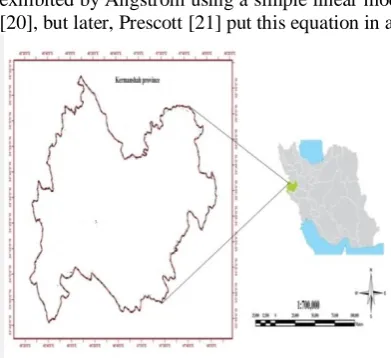
Kermanshah province is located in the middle of western part of Iran with an area of 25008 km 2 within 45º 24' and maximum 48º 07' of east longitude and 33º 40' and maximum 35º 18' of north latitude [13] the fig .1 shows Location of Kermanshah province in Iran. Kermanshah has a climate which is heavily influenced by the proximity of the Zagros mountains, classified as a hot dry summer Mediterranean climate [14]. The city's altitude and exposed location relative to westerly winds makes precipitation a little bit high (more than twice that of Tehran) [15], but at the same time produces huge diurnal temperature swings especially in the virtually rainless summers, which remain extremely hot during the day [16]. Kermanshah experiences rather cold winters and there are usually rainfalls in fall and spring. Snow cover is seen for at least a couple of weeks in winter. This province meets Kurdestan province from north, Lorestan and Ilam provinces from south and Hamadan province from east and has 330 km of common border with Iraq [17]. All data
were calculated using observations from
Kermanshah airport regional station was coincides with those obtained by using in situ automatic weather station [18]. For this purpose, the amounts of incoming solar radiation on a daily basis were estimated considering local in Station No. 40766 (altitude, latitude and longitude) and climatic (Humidity, temperature, pressure, length of day, sunshine hours, solar angle, sky albedo, absorption by aerosols, ground albedo, air mass, absorption by ozone, and Rayleigh distribution) characteristics [19].
3. Studied Models
The first correlation between the global solar irradiation and the sunshine duration was first
exhibited by Angstrom using a simple linear model [20], but later, Prescott [21] put this equation in a
Fig. 1. Location of Kermanshah province in Iran
more convenient form by replacing the monthly global irradiation on a clear day by the monthly average daily extraterrestrial radiation, The Angstrom - Prescott model [22] is the most commonly used model as given by:
N n b a R
Rs a (1)
where Rs is the monthly average daily global radiation, Ra is the monthly average daily extraterrestrial radiation, n is the day length, N is the maximum possible sunshine duration, and a and b are empirical coefficients. The values of the monthly average daily extraterrestrial radiation (Ra) are calculated for days giving average of each month [23], These ratios (Rs/Ra) vary between zero and one [24]. Ra Was calculated from the following equation:
sin sin 360
. 2 sin cos cos
* ) 2 ( 365
) ( 360 cos 33 . 0 1 * 24
Ws Ws
day n ISC
Ra
(2)
where Isc is the solar constant (1367 Wm-2) which
is calculated in this study, is the altitude of the
site, is the sun declination and is the mean sunrise
hour angle for the given month, n( day) is the average
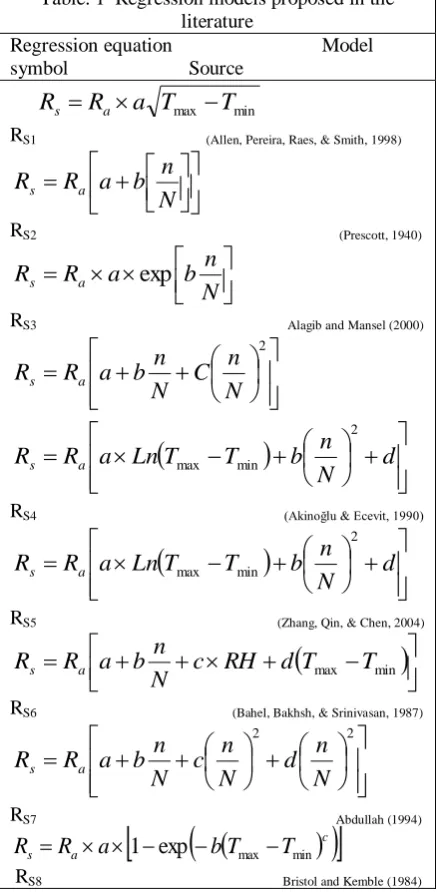
day of each month. The regression models proposed in the literature based on Angstrom and Prescott and other Parameters are listed in Table 1. The Allen model is the most commonly used methods given as follows:
min max
T
T
a
R
R
s
a
(3)117 and 0.7511, respectively. These findings are in agreement with results of [25] and [26] in which they recommended "a+b" equal to 0.75 and 0.76, respectively. The value of Rs1 coefficient ("a") calibrated equal to 0.1665 for our study station. This amount is in agreement with finding of Allen, Pereira, Raes, & Smith, (1998) in which they recommended it in the range of 0.16-0.19.
In table 1, eight empirical global solar radiation models based on meteorological data and relative
sunshine hours ( ) were generated and validated as
follows:
Table. 1 Regression models proposed in the literature
Regression equation Model symbol Source
R
s
R
a
a
T
max
T
minRS1 (Allen, Pereira, Raes, & Smith, 1998)
N
n
b
a
R
R
s aRS2 (Prescott, 1940)
N
n
b
a
R
R
s aexp
RS3 Alagib and Mansel (2000)
2N
n
C
N
n
b
a
R
R
s a
d
N
n
b
T
T
Ln
a
R
R
s a2
min
max
RS4 (Akinoğlu & Ecevit, 1990)
d
N
n
b
T
T
Ln
a
R
R
s a2
min
max
RS5 (Zhang, Qin, & Chen, 2004)
c
RH
d
T
maxT
minN
n
b
a
R
R
s aRS6 (Bahel, Bakhsh, & Srinivasan, 1987)
2 2N
n
d
N
n
c
N
n
b
a
R
R
s aRS7 Abdullah (1994)
c
a
s
R
a
b
T
T
R
1
exp
max
minRS8 Bristol and Kemble (1984)
Various models have been developed to estimate global solar radiation using sunshine hour data which are discussed for estimation of global solar radiation, in early 1954 Black found the regression model that coefficient ‘b’ was more or less constant, whereas the value of ‘a’ showed
marked variation [27]. Also, for all practical purposes the coefficient ‘b’ was considered constant [28]. Page in 1988 had also noted that the clearer the atmosphere, the higher the value of
(
) obtained for a given value of ( ) and that
affected the values of ‘a’ and ‘b’ found by regression analysis. The method used [29] for the estimation of monthly mean values of daily solar radiation on vertical and inclined surfaces from sunshine recorders, in conjunction with the method proposed and used for determination of the constants ‘a’ and ‘b’ of the Angstrom formula, was selected for the calculation of monthly and annual total values of global solar radiation over Greece [30].
Macris in 1976 use the model that distributed solar energy in Greece with using a form of the
Angstrom type equation for the National
Observatory of Athens with a=0.32 and b=0.68 [31]. These values compared to the results of other investigators mentioned above and to the values of ‘a’ and ‘b’ obtained were in excess of the latter. Similar values (a=0.31 and b=0.66) were used in overall regression equation [32].
Rietveld Model in 1978 was based on the well-known Kimbell-Angstrom-Page equation, which related the monthly average daily values of the global solar radiation G to the fraction of possible sunshine hours [33]. This model was expected to have an extended validity as shown in the later studies. Rietveld’s correlation was believed to be applicable anywhere in the world.
Flocas in his model said that despite the
importance of global radiation, many
meteorological stations recorded only the duration of sunshine and only a few of them recorded accurate measurements of solar radiation. A graphical relationship between the constants ‘a’
and ‘b’ and the annual average of ( ) had been
proposed. The solar radiation in Brazil, applying the Angstrom formula and using the method proposed has been estimated. It was used for the determination of the constants ‘a’ and ‘b’.
118 Tropical Agriculture station of Onne, Nigeria, a high rainfall station located at latitude 40 46' N, Longitude 70 10' E with an altitude of 10 m [38]. The method of least squares was used to obtain the constants ‘a’ and ‘b’.
3. Results and Discussion
Model constants were estimated by
minimizing the sum of square errors from measured and predicted values. Performance of the models were evaluated by statistical error tests including coefficient of determination (R2), root mean square error (RMSE), mean bias error (MBE) and the Nash-Sutcliffe
equation (NSE) [39] as follows:
n O P MBE
n i i
1 (4)
n O P RMSE
n i i
1
2
(5)
n
i i n
i i i
O O
P O NSE
1
2 1
2
1 (6)
Where, n is the total number of measurements, i is the measurement number, O and P are the measured and estimated values, respectively
and ̅ is the average of measured values. A model
is more efficient when NSE is closer to one [40]. The mean bias error value provides information on the long-term performance. A low MBE is desired. A positive value gives the average amount of over-estimation of an individual measurement, which
will cancel under-estimation in separate
measurements. The RMSE gives information on the short-term performance of the correlations by allowing a term-by-term comparison of the actual deviation between the predicted and measured data. The smaller the value, the better is the model’s performance. However, a few large errors in the sum can produce a significant increase in the RMSE [41]. The calibrated constants for the eight models of Regression equation in the study station are shown in table 2.
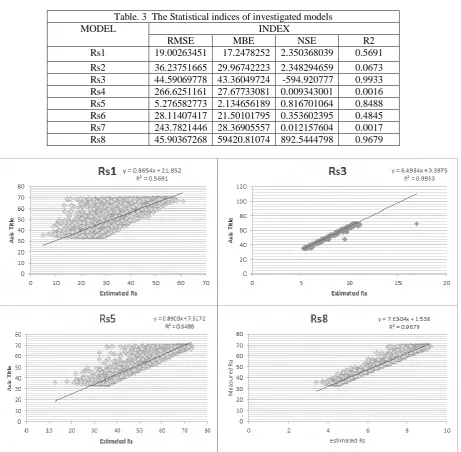
The values of statistical indices including
RMSE, MBE, NSE and R2 are shown in table 3 for
all 8 models. For statistical analysis, it was assumed that the best methods were those that yielded the lowest RMSE and Absolute value of
(MBE) and highest value of NSE and R2 .Based on
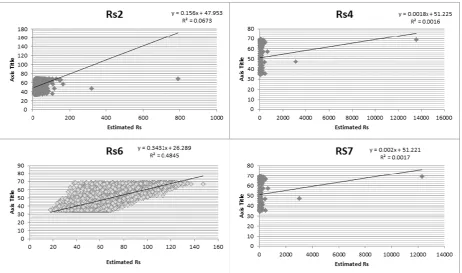
Table 3, all recommended models except Rs2, Rs4 and Rs7 show an acceptable accuracy. The minimum amounts of RMSE belong to Rs1, Rs5 and maximum amount of R2 belong to model Rs2 and model Rs8, respectively.
Rs3 was found to be the most accurate model for the prediction of global solar radiation in study station with RMSE, MBE, NSE and R2 values of 44.59069778 MJ/m2/d, 43.36049724 MJ/m2/d, -594.920777 and 0.9933, respectively. Results
confirmed that meteorological variables such as precipitation, daily mean air temperature, square root of the maximum and minimum air temperature differences, daily averaged relative humidity, saturation deficit and relative sunshine durations could be used to reasonably estimate the daily global solar radiation. After the Rs3, model Rs8 could estimate the daily global radiation with
relatively high accuracy and is therefore
recommended to estimate the global solar radiation
when the Tmax and Tmin are available [42]. The
values of measured and predicted global solar radiation by all models during 2008 to 2015 are compared as shown in Figure 2. As it can be seen from this figure 3, the estimated values of solar radiation using model Rs3 are very close to the measured values.
Temperature, square root of the maximum and minimum air temperature differences, daily averaged relative humidity, saturation deficit and relative sunshine durations could be used to reasonably estimate the daily global solar radiation. Results of statistical analysis suggest that models Rs3 (Alagib and Mansel model) and Rs8 (Bristol and Kemble model) presented in this paper are the most accurate models amongst the solar radiation models, which are based on meteorological data and sunshine hours. Therefore, these models are recommended to be used in Kermanshah region for estimation of solar radiation with higher accuracy.
4. Conclusion
Results confirmed that meteorological variables such as precipitation, daily mean air temperature, square root of the maximum and minimum air temperature differences, daily averaged relative humidity, saturation deficit and relative sunshine durations could be used to reasonably estimate the daily global solar radiation. After the Rs3, model Rs8 could estimate the daily global radiation with
relatively high accuracy and is therefore
recommended to estimate the global solar radiation when the Tmax and Tmin are available. The values of measured and predicted global solar radiation by all models during 2008 to 2015 are compared as shown in Figure 2. As it can be seen from this figure 3, the estimated values of solar radiation using model Rs3 are very close to the measured values.
119
Table. 2 Calibrated constants for the models in the study station Model a b c d
Rs1 0.1665
Rs2 0.2204 0.5307
Rs3 0.1514 0.0299 0.4831
Rs4 0.2165 0.0044 0.4356
Rs5 0.1958 0.0043 0.0099 0.4224
Rs6 0.2097 0.0090 0.2446 0.0585
Rs7 0.2059 0.0066 0.4614 -
Rs8 0.4470 0.294 0.1085 0.0031
Table. 3 The Statistical indices of investigated models
MODEL INDEX
RMSE MBE NSE R2
Rs1 19.00263451 17.2478252 2.350368039 0.5691
Rs2 36.23751665 29.96742223 2.348294659 0.0673
Rs3 44.59069778 43.36049724 -594.920777 0.9933
Rs4 266.6251161 27.67733081 0.009343001 0.0016
Rs5 5.276582773 2.134656189 0.816701064 0.8488
Rs6 28.11407417 21.50101795 0.353602395 0.4845
Rs7 243.7821446 28.36905557 0.012157604 0.0017
Rs8 45.90367268 59420.81074 892.5444798 0.9679
120
Fig. 3. Correlation of measured and estimated radiation data by rejected models
References:
[1] Dubayah R . C. Journal of Vegetation Science. 1994. V. 5. N. 5. pp. 627-640. [2] Suehrcke H. Solar Energy. 2000. V. 68. N. 5. pp. 417-425.
[3] Şen Z Öztopal . A & Şahin A . D. Energy conversion and management. 2001. V. 42. N. 2. pp. 217-231.
[4] Gadiwala M. Pakistan Journal of Meteorology. 2013. V. 9. N. 18. pp.
[5] Hussein T . A .T & Ahmed T. Int. J. Latest Trends Agr. Food Sci. V. 2. N. 2. pp. 74-82.
[6] Rahimi I.، Bakhtiari B.، Qaderi K. & Aghababaie M. Energy Procedia. 2012. V. 18. pp. 644-651.
[7] Elagib N A.، Babiker S F & Alvi S H. Energy conversion and management. 1998. V. 39. N. 8. pp. 827-836.
[8] Ghobadi G.، Gholizadeh B & Motavalli S. Iran. International Journal of Agriculture and Crop Sciences. 2013. V. 5. N. 21. pp. 26-50. [9] Namrata K.، Sharma S P & Seksena S B L. Applied solar energy. 2016. V. 52. N .3. pp. 164-172.
[10] Ehnberg J S & Bollen M H. Solar Energy. 2005. V. 78. N. 2. pp. 157-162. [11] Badescu V. Solar Energy. 1997. V. 61. N. 4. pp. 251-264.
[12] Besharat F & Dehghan A A & Faghih A
R. Renewable and Sustainable Energy
Reviews. 2013. V. 21. pp 798-821.
[13] Dalimi A.، Sattari A & Motamedi. Veterinary Parasitology. 2006. V. 142. N. 1. pp. 129-133.
[14] Assari A & Assari E. Journal of American Science. 2012. V. 8. N. 1. pp. 202-109.
[15] Assari A & Mahesh T. Journal of Geography and Regional Planning. 2011. V. 4. N. 8. pp. 463-470.
[16] Samadi S.، Sagareswar G & Tajiki M. International Journal of Global Warming. 2010. V. 2. N. 4. pp. 347-365.
[17] Madjdzadeh S M & Mehrparvar M. North-Western Journal of Zoology. 2009. V. 5. N. 2. pp. 338-348.
[18] Ghahreman N.، Varshavian V.، Javan-Nikkhah M & Liaghat A. Forecasting of Potato Early Blight Disease Using Different Sets of Meteorological Data. 2015.
[19] Bakhtiari A A & Hematian A. Evaluation of Flat Plate Solar Collector to Optimizing the Tilt Angle, Case Study: Tabriz, Iran. 2013.
[20] Angstrom A. Quarterly Journal of the Royal Meteorological Society. 1924. V. 50. N. 210. pp. 121-126.
121 [22] Wan K K., Tang H, Yang L, & Lam J
C. Energy. 2008. V. 33. N. 7. pp. 1115-1127. [23] Erbs D, Kl.، ein S & Duffie J. Solar Energy. 1982. V. 28. N. 4. pp . 293-302. [24] Assari A & Mahesh T. Journal of Geography and Regional Planning. 2011. V. 4. N. 8. pp. 463-470.
[25] Allen R G.، Pereira L S.، Raes D & Smith M. Crop evapotranspiration-Guidelines for computing crop water requirements-FAO Irrigation and drainage paper 56. FAO, Rome. 1998.
[26] Liu X.، Mei X.، Li Y.، Wang Q.، Jensen J R.، Zhang Y & Porter J R. Agricultural and Forest Meteorology. 2009. V. 149. N. 9. pp. 1433-1446.
[27] Black J.، Bonython C & Prescott J.. Quarterly Journal of the Royal Meteorological Society. 1954.V. 80. N. 344. pp. 231-235. [28] Glover J & McCulloch J. Quarterly Journal of the Royal Meteorological Society. 1958. V. 84. N. 360. pp. 172-175.
[29] Page M & Norris D. Psychological Review. 1998. V. 105. N. 4. p. 761.
[30] Flocas A. Solar Energy. 1980.V. 24. N. 1. pp. 63-70.
[31] Macris G J. National Observatory. 1976. [32] Katsoulis B D & Papachristopoulos C E. Solar Energy. 1976. V. 21. N. 3. pp. 217-226.
[33] Rietveld M. Agricultural
Meteorology.1978. V. 19. N. 2. pp. 243-252. [34] Hutchinson M. International journal of geographical information systems. 1995.V. 9. N. 4. pp. 385-403.
[35] Hounam C E. Aust. Met. Mag. 1963. V. 43. N. 1.
[36] Fagbenle R L. International journal of energy research. 1992. V. 16. N. 7. pp. 583-595.
[37] Kumar R.، Aggarwal R.، & Sharma J. Advances in Energy Engineering. 2013. pp. 66-73.
[38] Etuk S.، Akpabio L.، & Akpabio K. Ghana journal of science. 2003.