Highlights from BESIII experiment
Yanping Huangaon behalf of the BESIII Collaboration Institute of High Energy Physics Bejing 100049, ChinaAbstract. BESIII had collected large data samples onJ/ψandψ0peaks during the first run in 2009. We review recent results on charmonium decays and hadron spectroscopy. The prospects on open charm physics are also discussed.
1 Introduction
The newly built BEPCII/BESIII is an upgrade to the previous BEPC/BES [1]. The BEPCII is a double ring collider with a design luminosity of 1×1033cm−2s−1 at a center-of-mass energy of 3.78 GeV,
which luminosity is one order of higher than that at CESR-c. It is operating between 2.0 and 4.6 GeV in the center of mass. The BESIII experiment is used to study the charm andτphysics. It is foreseen to collect on the order of 10 billion J/ψevents or 3 billionψ(2S) events per year according to the designed luminosity. About 32 millionDDpairs and 2.0 millionDSDS at threshold will be collected per year [1]. In last run, the peak luminosity of BEPCII has reached 6.5×1032cm−2s−1.
In 2009, the BESIII had collected about 225 M and 106M data set on the J/ψandψ0peaks,
respec-tively. The results in this paper is based above data set.
2 Highlights from BESIII
The BESIII collaboration has published so-far a variety of papers with many new results in the field of light hadron and charmonium spectroscopy, as well as charmonium decays [2–12]. A number of new hadronic states were discovered or confirmed, and various decay properties were measured for the first time. In addition, many data analyses are in an advanced stage and will lead to a rich set of new publications in the near future. Here, we show recent highlights from the BESIII, thereby, illustrating the potential of the BESIII experiment. In this paper, for the reported experimental results, the first error and second error will be statistical and systematic, respectively, if they are not specified.
2.1ηc(1S)resonance viaψ0→γηcdecay
Based on the data sample of 106 Mψ0events collected with BESIII detector, theη
cmass and width are measured from the radiative transitionψ0 → γη
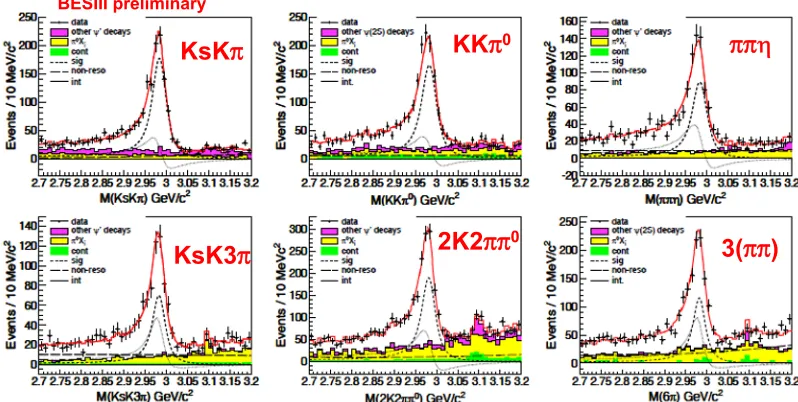
c. Theηccandidates are reconstructed from six exclusive decay modes: KsKπ, K+K−π0, ηπ+π−, KsK+π−π+π−, K+K−π+π−π0, and 3(π+π−), where Ks is reconstructed inπ+π− mode,η andπ0 fromγγfinal states. For a hindered M1 transition the matrix element acquires terms proportional to E2
γ, which, when combined with the usual Eγ3 term for the allowed transitions, lead to contributions in the radiative width proportional toE7
γ. Thus, the
ηc lineshape is described by a BW modified byE7γ convoluted with a resolution function. It is im-portant to point out that the interference betweenηc and non-resonance in the signal region is also
a e-mail:[email protected]
C
Owned by the authors, published by EDP Sciences, 2012
considered. The statistical significance of the interference is 15 σ. This affects the ηc resonant pa-rameters significantly. Assuming an universal relative phase between the two amplitudes, we obtain
ηc mass and width, M = 2984.2±0.6±0.5 MeV/c2 andΓ = 31.4±1.2±0.6 MeV, respectively, as well as the relative phaseφ = 2.41±0.06±0.04 rad. Figure 1 shows the fit results in the six
ηc decay modes. With precise measurement of the ηc mass, one can obtain the hyperfine splitting, ∆Mh f(1S)cc¯ ≡= M(J/ψ)−M(ηc) = 112.5±0.8 MeV, which agrees with the quark model predic-tion [14], and will be helpful for understanding the spin-dependent interacpredic-tions in hidden quarkonium states.
r
r
r
r
I
r
r
KsKS
KKS
0SS
K
KsK3S
2K2SS
03(SS)
BESIII preliminary
Fig. 1.The invariant mass distributions for the decays KsKπ, K+K−π0, ηπ+π−, KsK+π−π+π−, K+K−π+π−π0,
and 3(π+π−), respectively. Solid curves show the fitting results; the fitting components (η
c signal/
non-resonance/interference) are shown as (dashed/long-dashed/dotted) curves. Points with error bar are data, shaded histograms are (in green/yellow/magenta) for (continuum/otherηcdecays/otherψ0decays) backgrounds.
2.2 Observation ofψ0→γη c(2S)
Using the largestψ0 data sample in the world which was collected by the BESIII, we searched for
the M1 transition ψ0 → γη
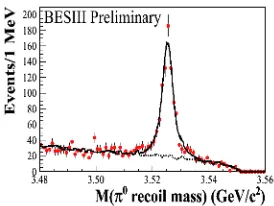
c(2S) through the hadronic final states KsK±π∓. A bump is observed around 3635 MeV on the mass spectrum as shown in Fig. 2. In order to determine the background and mass resolution using data, the mass spectrum range is enlarged (3.47∼3.72 GeV/c2) to include
χc1andχc2events. The resonancesχc1andχc2are described by the corresponding Monte Carlo (MC) shape convolved a Gaussian which takes account the small difference on the mass shift and resolu-tion between data and MC. So the mass resoluresolu-tion for theηc(2S) in the fitting is fixed to the linear extrapolation of the mass resolutions from theχc1 andχc2signals in data. The line shape forηc(2S) produced by such the M1 transition is described by (E3
γ×BW(m)×damping(Eγ))⊗Gauss(0, σ) where mis the invariant mass of KsK±π∓,Eγ =
m2
ψ0−m2 2m2
ψ0 is the energy of the transition photon in the rest frame ofψ0,damping(E
γ) is the function to damp the diverging tail raised by E3γ andGauss(0, σ) is the Gaussian function describing the detector resolution. In the fit, the width of ηc(2S) is fixed to PDG value. From the fit to the data, a signal with a statistical significance of 6.5 standard de-viation is observed which is the first observation of the M1 transition ψ0 → γη
mea-BESIII preliminary
Fig. 2.Fitting of the mass spectrum forηc(2S)→KsK±π∓.
sured mass forηc(2S) is 3638.5±2.3±1.0 MeV/c2. The measured branching ratio is BR(ψ0 →
γηc(2S))×BR(ηc(2S)→ KsK±π∓)=(2.98±0.57±0.48)×10−6. Together with the BABAR result BR(ηc(2S)→KK¯π)=(1.9±0.4±1.1)% [15], the M1 transition rate forψ0→γηc(2S) is derived as BR(ψ0→γη
c(2S))=(4.7±0.9±3.0)×10−4.
2.3hc(1P)properties
The BESIII Collaboration reported the results on the production and decay of thehcusing 106M ofψ0 decay events in 2010 [2], where we studied the distributions of mass recoiling against a detectedπ0to measureψ0→π0h
cboth inclusively (E1-untagged) and in events tagged ashc →γηc(E1-tagged) by detection of the E1 transition photon. In 2011, 16 specific decay modes ofηcare used to reconstruct ηccandidates in the decay mode ofhc →γηc. Fig. 3 is the sum of the 16 decay modes. We fit the 16 π0recoil-mass spectra simultaneously that yieldsM(h
c)=3525.31±0.11(stat.)±0.15(syst.) MeV/c2 andΓ(hc)=0.70±0.28(stat.)±0.25(syst.) MeV/c2. These preliminary results are consistent with the previous BESIII inclusive results and CLEO-c exclusive results.
The centroid of the3P
J states (χc0,χc1,χc2) is known to behM(3PJ)i = [5M(3P2)+3M(3P1)+ M(3P
0)] = 3525.30±0.04 MeV [13]. If the3PJ states centroid masshM(3PJ)iis identified as the mass ofM(3P), then BESIII observes the hyperfine splitting as∆M
h f(1P)cc =−0.01±0.11(stat.)± 0.14(syst.) MeV which agrees with zero.
%(6,,,SUHOLPLQDU\
K
o
S
\oJ
S
(a)
(b)
(c)
(d)
Fig. 4.The invariant mass distributions: (a) invariant mass of f0(980)π0from J/ψ→γπ+π−π0; (b) invariant mass
of f0(980)π0 mass from J/ψ → γπ0π0π0; (c) the invariant mass ofη0 → 3πs in J/ψ → γπ+π−π0, (d) mass of
η0→3πs from J/ψ→γπ0π0π0, respectively.
2.4η0andη(1405)in J/ψ→γπππdecays
The spectrum of radial excitation states of isoscalarηandη0is still not well known. An important issue
is about the nature ofη(1405) andη(1475) states, which are not well established. BESIII measured the decays of J/ψ → γπ+π−π0 andγπ0π0π0. In the two decay modes, clear f0(980) signals are observed on bothπ+π− andπ0π0 spectra, the width of observed f0(980) is much narrower (∼10 MeV) than that in other processes [13]. By taking events in the window of f0(980) on the ππmass spectrum, we observed evidence of f1(1285) in the low mass region of f0(980)π0 as shown in Fig. 4 (a) and (b), which corresponding to significance of about 4.8σfor f1(1285)→ f0(980)π0in f0(980)→π+π− mode (1.4σinf0(980)→π0π0). It is interesting that clear peak around 1400 MeV is also observed on the mass of f0(980)π0(see Fig. 4 (a) and (b)). Preliminary angular analysis indicates that the peak on 1400 MeV is fromη(1405)→ f0(980)π0decay. BESIII measured the combined branching fraction of
η(1405) production to beBR(J/ψ→γη(1405))×BR(η(1405)→ f0(980)π0)×BR(f0(980)→π+π−)=
(1.48±0.13±0.17)×10−5andBR(J/ψ→γη(1405))×BR(η(1405)→ f0(980)π0)×BR(f0(980)→
π0π0)=(6.99±0.93±0.95)×10−6, respectively. It is the first time that we observe anomalously large isospin violation in the strong decay ofη(1405)→ f0(980)π0.
By looking at the invariant mass ofπππinJ/ψ→γ3πs decays as shown in Fig. 4 (c) and (d), we observe signals forη0→π+π−π0andπ0π0π0decays, respectively, and determine the decay rates to be BR(η0→π+π−π0)=(3.83±0.15±0.39)×10−3andBR(η0→π0π0π0)=(3.56±0.22±0.34)×10−3, respectively. Forη0 → π+π−π0 decay, it is consistent with CLEO-c’s measurements and precision is
improved by a factor of 4. In contrast , forη0 →π0π0π0decay, it is two times larger than that in the
PDG value [13].
2.5 Observation of resonances above 2.0 GeV inJ/ψ→γη0π+π−decay
1.5 2.0 2.5 3.0
) 2 Events/(0.04GeV/c 0 200 400 600 800 1000 1200 (a)
Mηπ+π−(GeV/c2)
1.5 2.0 2.5 3.0
) 2 Events/(0.04GeV/c 0 50 100 150 200 250 300 (b)
Mηπ+π−(GeV/c2) 1.4 1.6 1.8 2.0 2.2 2.4 2.6 2.8
) 2 Events/(0.02GeV/c 0 100 200 300 400 500
1.4 1.6 1.8 2.0 2.2 2.4 2.6 2.8
) 2 Events/(0.02GeV/c 0 100 200 300 400 500 (c)
Mηπ+π−(GeV/c2) |cosθγ|
0.0 0.2 0.4 0.6 0.8 1.0
|γ θ dN/d|cos 0 1000 2000 3000 4000 5000 (d)
Fig. 5.The invariant mass distributions ofη0π+π−with (a)η0→γρ(b)η0→ηπ+π−, and (c) the combined plot for (a) and (b), and fitting results. (d) is for the cos(θγ) distribution, whereθγis the pole angle of the radiative photon.
The X(1835) was firstly observed at the BESII with a statistical significance of 7.7σ [16]. The possible interpretations of the X(1835) include a pp¯ bound state [17,18], a glueball [19], a radial excitation of the η0 meson [20], etc. We report a study of J/ψ → γη0π+π− that used two η0 decay
modes,η0 → γρandη0 → π+π−η. Figure 5 (a) and (b) show theη0π+π−invariant mass spectrum in
J/ψ → γη0π+π− withη0 → γρandη0 → π+π−ηdecay modes, respectively. TheX(1835) resonance is clearly seen. Additional peaks are observed around 2.1 and 2.3 GeV/c2, denoted asX(2120) and X(2370), as well as the f1(1510) in the low mass region and the distinctηc(1S) signal in the high mass region.
Fits to the mass spectra have been made using four efficiency-corrected Breit-Wigner functions convolved with a Gaussian mass resolution plus a nonresonantπ+π−η0contribution and background
representations. The fitting result of the combined mass spectrum is shown in Fig. 5(c). The mass and width of X(1835) are measured to be M = 1836.5±3.0+−5.62.1 MeV/c2 andΓ = 190±9+38−36 MeV with a significance larger than 20σ. The masse and width forX(2120) (X(2370)) is determined to be M=2122.4±6.7+−4.72.7MeV/c2(M =2376.3±8.7−+3.24.3MeV/c2) andΓ=83±16−+3111MeV (Γ=83±17+−446 MeV) with significance 7.2σ(6.4σ). ForX(1835), thecosθγdistribution is shown in Fig. 5, whereθγ is the polar angle of the radiative photon in the J/ψcenter of mass system. It agrees with (1+cos2θγ), which is expected for a pseudoscalar.
2.6 pp¯mass threshold enhancement inJ/ψandψ0radiative decay
) 2 (GeV/c p -2m p p M
0.0 0.1 0.2 0.3
) 2 Events/(0.005GeV/c 0 100 200 300 400 500 600 700 (a) γ θ cos
-1.0 -0.5 0.0 0.5 1.0
Events 0 50 100 150 200 250 300 350 400 (b) p θ cos
-1.0 -0.5 0.0 0.5 1.0
Events 0 50 100 150 200 250 300 (c) ) ° ( p φ
-100 0 100
Events 0 50 100 150 200 250 300 350 (d)
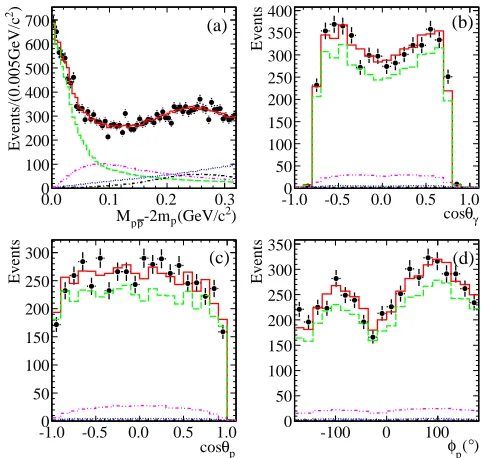
Fig. 6.Comparisons between data and PWA fit projection: (a) thepp¯ invariant mass; (b)-(d) the polar angleθγ
of the radiative photon in theJ/ψcenter of mass system, the polar angleθpand the azimuthal angleφp of the
proton in the pp¯center of mass system withMpp¯−2mp <50 MeV/c2, respectively. Here, the black dots with
error bars are data, the solid histograms show the PWA total projection, and the dashed , dotted , dash-dotted and dash-dot-dotted lines show the contributions of theX(pp¯), 0++phase space,f0(2100) andf2(1910), respectively.
1832+19
−5 (stat.)+
18
−17 (syst.)±19 (model) MeV/c2; and its total width to beΓ <76 MeV/c2at the 90% C.L. The product of branching ratios is measured to be BR(J/ψ → γX(pp))BR(X(p¯ p)¯ → pp)¯ = (9.0+0.4
−1.1 (stat.)−+15.0.5 (syst.)±2.3 (model))×10
−5. A similar analysis performed onψ(3686) → γpp¯
decays shows, for the first time, the presence of a corresponding enhancement with a production rate relative to that forJ/ψdecays ofR=(5.08+0.71
−0.45(stat.)+
0.67
−3.58(syst.)±0.12 (model))%.
2.7 Open charm physics
As of May, 2011, the BESIII has accumulated integrated luminosity of 2.9 fb−f on ψ(3770) peak
for open charm physics, which is about 3.5 times the previous largestψ(3770) data set taken by the CLEO-c Experiment. Taking advantage of the high luminosity provided by the BEPCII collider, BE-SIII is expected to take much more data at both 3770 MeV and higher energies. Many high precision measurements, including CKM matrix elements related to charm weak decays, decay constantsfDand fDs, form factors from D semileptonic decays, Dalitz decays, searches forCPviolation, and absolute decay branching fractions, will be accomplished in the near future.
There are many advantages of doing charm physics at experiments withe+e−collider at threshold.
Withe+e−colliding, the initial energy and quantum numbers are known. Forψ(3770)→DD, both D¯
daughter mesons can be fully reconstructed, allowing absolute measurements, namely, the so called double-tag technique. The continuum background is greatly suppressed by doing this, and kinematic constraints can be applied to infer missing particles on the other side D meson. The neutrino can be reconstructed in the leptonic and semileptonicDdecays, so that decay constants and form factor/CKM matrix elements can be precisely measured. Thus, these precise measurements could be used to test and calibrate the theoretical tools such as lattice QCD, which are critical for dealing with B decays.
3 Summary
The BESIII experiment addresses a wide range of topics in the field of QCD and searches for new physics beyond the standard model. At present the BESIII collaboration has collected a record on statistics on J/ψ,ψ0, andψ(3770) charmonium states. These data are being exploited to provide
pre-cision measurements with a high discovery potential in light hadron and charmonium spectroscopy, charmonium decays, and open charm productions. Most recent highlights from BESIII are reviewed in this paper.
Since very recently, data about 470 pb−1luminosity have been taken at a center-of-mass energy of
4010 GeV, which could give new insights in our understanding of the recently discoveredXYZstates and which will allow to explore the field ofDsphysics.
We would like to thank the accelerator people at BEPCII for their hard work which makes our high luminosity possible. We would also like to thank the great computational and software support of the IHEP staff. This work is supported in part by the Ministry of Science and Technology of China.
References
1. M. Ablikimet al.(BESIII Collaboration), Nucl. Instrum. Meth.A614, 345 (2009). 2. M. Ablikimet al.(BESIII Collaboration), Phys. Rev. Lett.104, 132002 (2010). 3. M. Ablikimet al.(BESIII Collaboration), Phys. Rev. Lett.105, 261801 (2010). 4. M. Ablikimet al.(BESIII Collaboration), Phys. Rev. D81, 052005 (2010). 5. M. Ablikimet al.(BESIII Collaboration), Chin. Phys. C34, 4 (2010).
11. M. Ablikimet al.(BESIII Collaboration), Phys. Rev. Lett.107, 092001 (2011). 12. M. Ablikimet al.(BESIII Collaboration), Phys. Rev. Lett.108, 112003 (2012). 13. PDG 2010: Particle Data Group, Journal of PhysicsG 37, 075021 (2010).
14. E. Eichten, K. Gottfried, T. Kinoshita, K. D. Lane and T.-M. Yan, Phys. Rev.D17, 3090 (1978). 15. B. Aubertet al.(Babar Collaboration), Phys. Rev.D 78, 012006 (2008).
16. M. Ablikimet al.(BESII Collaboration) Phys. Rev. Lett.95, 262001 (2005). 17. G. J. Ding and M. L. Yan, Phys. Rev.C 72, 015208 (2005).
18. G. J. Ding and M. L. Yan, Eur. Phys. J.A 28, 351 (2006). 19. B. A. Li, Phys. Rev. D 74, 034019 (2006).