www.ijaer.in Copyright © IJAER 2019, All rights reserved Page 805
CORRELATION COEFFICIENTS BETWEEN YIELD AND YIELD
COMPONENTS OF GROUNDNUT (
Arachis hypogaea
L.) AS AFFECTED
BY NUTRIENT COMBINATIONS IN A DRYLAND ECOLOGY
B. Goni1*, H. A. Daya2 and I. B. Kumshe3
1Department of Forestry Technology, Mohamet Lawan College of Agriculture,
P.M.B. 1427, Maiduguri, Borno State Nigeria.
2Department of Forestry Technology, Yobe State College of Agriculture Gujba,
P.M.B. 1104, Damaturu, Yobe State Nigeria.
3Department of Agricultural Technology, Mohamet Lawan College of Agriculture,
P.M.B. 1427, Maiduguri, Borno State Nigeria.
ABSTRACT
Trials were conducted during the 2015 rainy season on farmers’ fields in 15 villages across 3 Local Government Areas (LGAs) of Kano State to study the effects of various nutrient applications and combinations on groundnut productivity. The treatments were P only, P + K, P + K + Micronutrients (Mc), P + K + Mc + Organic manure (OM), OM only and no fertilizer treatment (Control). The treatments were laid out in a Randomized Complete Block Design with farmers as replicates. The results showed that all the yield traits expectedly correlated positively and highly significantly with pod yield and plant height in Gaya and Ajingi. In Gezawa, except for days to flowering (which correlated negatively), number of branches plant-1 and days to maturity (which shows no association), all other parameters correlated positively with pod yield at 1% level of probability.
Keywords: Correlation coefficient, Groundnut, Yield and yield components.
INTRODUCTION
www.ijaer.in Copyright © IJAER 2019, All rights reserved Page 806
almost 13.9 million metric tons, followed by India with 7.1 million metric tons and Nigeria with 2.9 million metric tons. Nigeria is the largest groundnut producing country in Africa, accounting for 39% of production in the region (Ajeigbe et al., 2014).
The low level of groundnut productivity has been ascribed to several constraints, among them are; low organic matter content, poor soil fertility, imbalanced use of fertilizers accompanied by restricted use of organic manures that made the soils not only deficient in the required nutrients, but also deteriorate the soil health (Akbari et. al., 2011). Groundnut is an energy-rich crop and thus, its requirement for major nutrients and micronutrients is very high. The nutrient removal varies considerably, depending upon crop productivity and soil fertility (Hegde, 2000). Ghosh et al. (2002) further stressed that proper fertilizer management of groundnut crop with the right kind of nutrients at the right time adapting right method of application has significant effect on yield and quality.
MATERIALS AND METHOD
Trials were conducted during the 2015 rainy season on farmers’ fields in 15 villages across 3 LGAs of Kano State Nigeria. The LGAs were Gaya, Ajingi and Gezawa.
The following treatments were assigned at random to each experimental plot;
1 = Phosphorous (P) only at the rate of 30 kg/ha of (18%) P2O5, dibbled at planting.
2 = 30 kg/ha P2O5 + Potassium (K) at the rate 25 kg/ha K2O.
3 = 30 kg/ha P2O5 + 25 kg/ha K + Micronutrients (Mc) at the rate of 42.5 g/ha.
4 = 30 kg/ha P2O5 + 25 kg/ha K + Mc + Organic matter (OM) at the rate of 4 tons/ha.
5 = OM only (4 tons/ha)
6 = Control (no fertilizer treatment)
The micronutrients were applied as foliar spray of Agrolyser Micronutrient Fertilizer (AMF), consisting of;
Na = 1.04%, Zn = 0.11%, Mg = 0.19%, Cu = 0.19%, S = 2.72%, Fe = Trace, Mn = Trace and Mo = Trace.
The treatments were laid out in a Randomized Complete Block Design (RCBD) with 5 replications (where each farmer serves as a replicate).
www.ijaer.in Copyright © IJAER 2019, All rights reserved Page 807 RESULTS
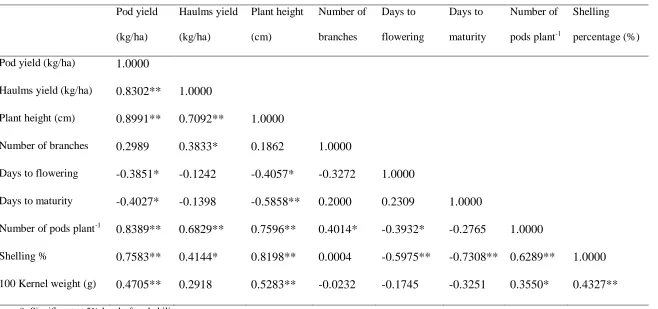
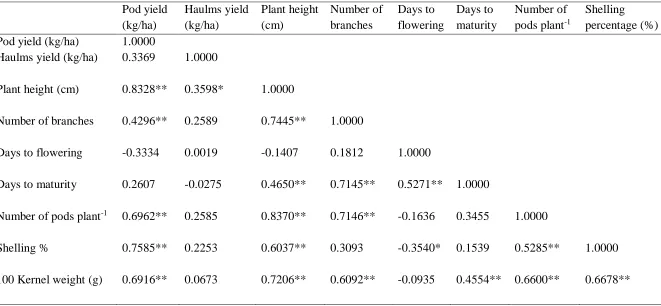
The results of correlation analyses between yield and growth parameters of groundnut as affected by nutrient combinations in Ajingi, Gaya and Gezawa LGAs were presented in Tables 1, 2 and 3, respectively. The trend of associations between pair of variables in Gaya LGA were similar to what was obtained in Ajingi LGA where all the yield traits expectedly correlated positively and highly significantly with pod yield and plant height. Similarly, the r values between 100 kernel weight and all other parameters were highly significant and positive except haulms yield and days to flowering. On the other hand, the association of haulms yield and all other parameters at Gaya were not significant except with plant height, which correlated at P≤0.05. This relationship was not the case at Ajingi except for days to flowering, days to maturity and 100 kernels weight. Association between days to flowering and all other variables were also not significant except with days to maturity and shelling %, which correlated at 1% and 5% respectively, while the relationship was negatively significant (p≤0.05) with pods yield, plant height, number of pods plant-1 and shelling % at Ajingi.
www.ijaer.in Copyright © IJAER 2019, All rights reserved Page 808 Table 1: Correlation Matrix between Yield and Growth Parameters of Groundnut in
Ajingi Local Government Area During 2015 Wet Season.
Pod yield
(kg/ha)
Haulms yield
(kg/ha)
Plant height
(cm)
Number of
branches
Days to
flowering
Days to
maturity
Number of
pods plant-1
Shelling
percentage (%)
Pod yield (kg/ha) 1.0000
Haulms yield (kg/ha) 0.8302** 1.0000
Plant height (cm) 0.8991** 0.7092** 1.0000
Number of branches 0.2989 0.3833* 0.1862 1.0000
Days to flowering -0.3851* -0.1242 -0.4057* -0.3272 1.0000
Days to maturity -0.4027* -0.1398 -0.5858** 0.2000 0.2309 1.0000
Number of pods plant-1
0.8389** 0.6829** 0.7596** 0.4014* -0.3932* -0.2765 1.0000
Shelling % 0.7583** 0.4144* 0.8198** 0.0004 -0.5975** -0.7308** 0.6289** 1.0000
100 Kernel weight (g) 0.4705** 0.2918 0.5283** -0.0232 -0.1745 -0.3251 0.3550* 0.4327**
www.ijaer.in Copyright © IJAER 2019, All rights reserved Page 809 Table 2: Correlation Matrix between Yield and Growth Parameters of Groundnut in
Gaya Local Government Area during 2015 Wet Season.
Pod yield (kg/ha)
Haulms yield (kg/ha)
Plant height (cm)
Number of branches
Days to flowering
Days to maturity
Number of pods plant-1
Shelling percentage (%)
Pod yield (kg/ha) 1.0000
Haulms yield (kg/ha) 0.3369 1.0000
Plant height (cm) 0.8328** 0.3598* 1.0000
Number of branches 0.4296** 0.2589 0.7445** 1.0000
Days to flowering -0.3334 0.0019 -0.1407 0.1812 1.0000
Days to maturity 0.2607 -0.0275 0.4650** 0.7145** 0.5271** 1.0000
Number of pods plant-1 0.6962** 0.2585 0.8370** 0.7146** -0.1636 0.3455 1.0000
Shelling % 0.7585** 0.2253 0.6037** 0.3093 -0.3540* 0.1539 0.5285** 1.0000
100 Kernel weight (g) 0.6916** 0.0673 0.7206** 0.6092** -0.0935 0.4554** 0.6600** 0.6678**
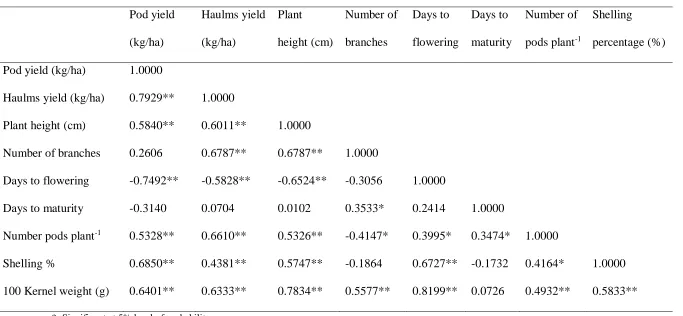
www.ijaer.in Copyright © IJAER 2019, All rights reserved Page 810 Table 3: Correlation Matrix between Yield and Growth Parameters of Groundnut in
Gezawa Local Government Area during 2015 Wet Season.
Pod yield
(kg/ha)
Haulms yield
(kg/ha)
Plant
height (cm)
Number of
branches
Days to
flowering
Days to
maturity
Number of
pods plant-1
Shelling
percentage (%)
Pod yield (kg/ha) 1.0000
Haulms yield (kg/ha) 0.7929** 1.0000
Plant height (cm) 0.5840** 0.6011** 1.0000
Number of branches 0.2606 0.6787** 0.6787** 1.0000
Days to flowering -0.7492** -0.5828** -0.6524** -0.3056 1.0000
Days to maturity -0.3140 0.0704 0.0102 0.3533* 0.2414 1.0000
Number pods plant-1 0.5328** 0.6610** 0.5326** -0.4147* 0.3995* 0.3474* 1.0000
Shelling % 0.6850** 0.4381** 0.5747** -0.1864 0.6727** -0.1732 0.4164* 1.0000
100 Kernel weight (g) 0.6401** 0.6333** 0.7834** 0.5577** 0.8199** 0.0726 0.4932** 0.5833**
www.ijaer.in Copyright © IJAER 2019, All rights reserved Page 811 DISCUSSION
The trend of associations between pair of variables in Gaya LGA were similar to what was obtained in Ajingi LGA where all the yield traits expectedly correlated positively and highly significantly with pod yield and plant height. These results are in accordance with previous results by Ibrahim et al. (2013) who reported that pod yield was positively and significantly correlated to plant height, number of branches, number of pods, weight of pod and 100-kernel weight. Similar findings were previously testified by Vishnuvardhan et al. (2012) and Padmaja et al. (2015), where pod yield presented a positive correlation with kernel yield, 100 kernel weight, and shelling percent, indicating a favorable association between yield and its components. Dhakar et al. (2017) also conveyed a positive and highly significant associations between pod yield with number of pods plant-1, haulms yield and 100 kernel weight. Zongo et al. (2017)
found significant and positive correlation of pod and kernel yields with 100 kernel weight and shelling percent. Association between days to flowering and all other variables were also not significant except with days to maturity and shelling %, which correlated at 1% and 5% respectively. These results were not in accordance with previous results (Korat et al., 2010; Gaikpa et al., 2015) who reported a significant and positive relationships between days to 50%
flowering with pod yield and kernel yield.
The trend of association in Gezawa is such that, except for the number of branches/plant and days to flowering, all the parameters correlated positively with pod yield at 1% level of probability. These results contradicts Vasanthi et al. (2015) and Hugar and Savithramma (2017) who described a strong positive association of number branches per plant with pod yield. The association between haulms yield and all other parameters had positive and highly significant estimates except with days to flowering which was negatively correlated and days to maturity which recorded low and insignificant coefficient (r = 0.0704), this result is in conformity with the results of Kwaga (2014) who stated a significant positive association between haulm yield, number of pods plant-1, shelling percentage and 100-kernels weight.
CONCLUSION
The study revealed that Plant height, haulms yield, number of pods plant-1, 100 kernels weight
www.ijaer.in Copyright © IJAER 2019, All rights reserved Page 812 REFERENCES
Ajeigbe, H.A, Waliyar F, Echekwu C.A, Ayuba K, Motagi B.N, Eniayeju D and Inuwa A. (2014). A Farmer’s Guide to Groundnut Production in Nigeria. Patancheru 502 324, Telangana, India: International Crops Research Institute for the Semi-Arid Tropics. 36 pp.
Akbari, K. N., Kanzaria, K. K., Vora, V. D., Sutaria, G. S and Padmini, D. R. (2011). Nutrient management practices for sustaining groundnut yield and soil productivity on sandy loam soils. J. Indian Soc. Soil Sci. 56(3):308-311.
Hegde D.M. (2000). Nutrient management in oilseed crops. Fert. Res., 45(4): 31-38 and 41.
Ghosh, P K, K G Mandal, K K Bandyopadhyay, K M Hati, A Subba Rao, A K Tripathi (2002). Role of plant nutrient management on oilseed production. Fertility News 47(11): 67-77.
Ibrahim, U., Ayinde, B.T., Dauda H., and Mukhtar, A.A. (2013) Socio Economic factors affecting groundnut production in Sabongari Local Government of Kaduna State.
International J. of Food and Agric. Econs 1(1):41-48.
Vishnuvardhan, K.M. Vasanthi, R.P. Reddy, K.H.P. Reddy, B.V. (2012). Genetic variability studies for yield attributes and resistance to foliar diseases in groundnut (Aracchis
hypogeae L.). Int. J. Appl. Biol. Pharm. Tech. 3: 390-394.
Padmaja, D. Eswari, K.B. BrahmeswaraRao, M.V. ShivaPrasad, G. (2015) Genetic variability studies in F2 population of Groundnut (Arachis hypogaea L.). Helix 2: 668–672.
Zongo, A. Nana, A.T. Sawadogo, M. Abdourasmane, K. Konate, A. Sankara, P. Ntare, B.R. and Desmae, H. (2017). Variability and Correlations among Groundnut Populations for Early Leaf Spot, Pod Yield, and Agronomic Traits. Agronomy; 7(52); pp. 11.
Korat, V.P. Pithia, M.S. Savaliya, J.J. Pansuriya, A.G. Sodavadiya, P.R. (2010) Studies on characters association and path analysis for seed yield and its components in groundnut
(Arachis hypogaea L.). Legume Res. 33, 211–216.
www.ijaer.in Copyright © IJAER 2019, All rights reserved Page 813
Vasanthi, R.P., Suneetha, N. and Sudhakar, P. (2015), Genetic variability and correlation studies for morphological, yield and yield attributes in groundnut (Arachis hypogaea L.). Legume
Research, 38(1): 9-15.
Hugar, A. A and Savithramma, D. L. (2017). Association and Path Coefficient Studies for Traits Related to Water Use Efficiency, Yield and Its Components of RILs in Groundnut
(Arachis hypogaea L.). Int. J. Curr. Microbiol. App. Sci. 6(9): 1266-1271.
Kwaga, Y.M. (2014). Correlation Coefficients Between Kernel Yield Of Groundnut (Arachis
hypogaea L.) Under Infestation Of Alectra Vogelii (Benth) In The Northern Guinea