Modelling of Vertical Wall Influence on the Single Bubble Motion
Dariusz Mikielewicz, Jan Wajs
Department of Heat Technology, Gdansk University of Technology, Faculty of Mechanical Engineering, Narutowicza 11/12, 80-952 Gdansk, Poland,
tel. +48 58 3472254; fax.+48 58 3472816; e-mail: [email protected]
Abstract
In this paper authors would like to present the results of experimental investigations and modelling of repulsive force acting on the rigid sphere (representing the bubble) in its flow along the vertical wall. It has been found that such force has a periodical character and depends on the flow Reynolds number. Comparison between measured and calculated values has been made, which gives satisfactory agreement.
1. Introduction
From the point of view of thermodynamics and heat transfer the two-phase flows introduce into the processes an important feature that they intensify the heat transfer. The boiling process, particularly at a small content of vapour phase, enhances heat transfer in channels which is depicted in a significantly higher, compared to single phase flows, heat transfer coefficient. In the era of reduction of technical appliances sizes the idea of implementation of two-phase flows in the systems of semiconductor laser cooling, or microprocessors in electronics seem inevitable. Hence investigations of boiling in small diameter channels or microchannels as well as extended microsurfaces are conducted in several research centers in the world [1, 2]. Similar investigations have also commenced at the Heat Technology Department at Gdansk University of Technology. Also the two-phase flows without bubble generation, i.e. flows where bubbles coexists within liquid fins numerous practical applications. Here also the mathematical modeling presents serious shortcomings.
Issues connected with the presence of a vertical wall and bubble movement around it are important in two-phase flows analysis. Additionally, there is no sufficient experimental data on the flow resistance of gas bubbles near vertical walls as well as mathematical description of that problem is incomplete. According to experimental data [3], characteristic feature of two-phase flow is wall peaking and core peaking (Fig. 1), which means bubbles grouping near the wall or core of the flow, respectively. Such phenomenon still strikes difficulties and there is no unanimous explanation to that fact. Mikielewicz [4], for
example, postulated that some additional angular velocity causes that phenomenon. He devised a model, which allows to determine the flow with void fraction distribution. Unfortunately, there is no experimental data confirming the details of that hypothesis apart from integral characteristics of the flow, i.e. velocity profile and void fraction distribution. Analysis of Eq. (1), a typical bubble diffusion equation, shows that in case of presence of void fraction maximum, D, the sign change of its derivative dD/dx is expected. The diffusion equation of bubbles in the transverse direction, mentioned earlier, yields:
x d d Db
b D
D- (1)
where -b is transverse bubble velocity and Db – bubble
diffusion coefficient. In the case when the void fraction derivative changes its sign there is only one other remaining quantity, which can also alter its sign. That is the transverse velocity -b. It is associated with the change
Nomenclature
D – angle, void fraction A – projection area cD – drag coefficient
Db – bubble diffusion coefficient FD – drag force
F – repulsive force h – maximum deviation m – mass
N – string force U – density
Re – Reynolds number t – time
tc – time of maximum deflection - – transverse velocity
x – Cartesian coordinate
x0 – initial distance between sphere and wall
motion. More details about hypothesis explaining that phenomenon have been presented in [4].
Fig. 1. A schematic depicting wall peaking and core peaking phenomenon
It is also expected, that the presence of the wall has a strong influence on the flow around a bubble, which becomes asymmetric. It leads to changes in drag force and appearance of transverse components of velocity. The aim of this work is investigation focused on accurate, experimental verification of forces effect on bubble flowing along the wall. The bubble is represented by a solid sphere suspended on a thin string. It is acknowledged that bubbles in such motion exhibit some specific patterns of motion, however, the authors are convinced that the model of a bubble considered in the present approach captures at least a qualitative behaviour of a bubble in the flow and will allow to determine the transverse force acting on the bubble.
2. Experimental rig
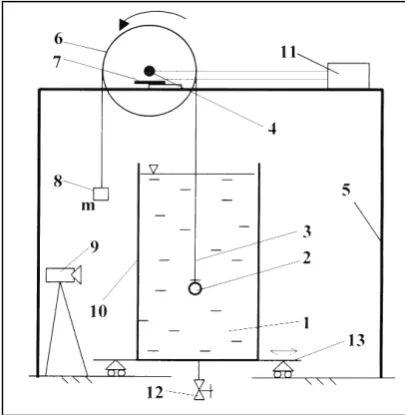
In order to measure the forces acting on the bubble an experimental rig, shown in Fig. 2, was designed and assembled at the Heat Technology Department of the Gdansk University of Technology. The rig consists of: 1 – vessel, 2 – sphere (the bubble model), 3 – steel string, 4 – velocity adaptor, 5 – frame, 6 – wheel, 7 – tensometric beam, 8 – mass, 9 – digital camera, 10– linear scale attached to vessel wall, 11– data acquisition set, 12– drain valve. Experimental rig is positioned in air-conditioned room with temperature 20 r 1 qC. The vessel (0,5 x 0,5 x 1m), containing distilled water, is made of Plexiglas 8 mm thick. It is assumed that water properties are: density
U = 998,2 kg/m3, viscosity Q = 1,006 x 10–6 m2/s, surface tension V = 726,9 x 10⁻⁴ N/m, i.e. they correspond to temperature 20 qC. The wheel with negligible mass was located on stiff frame. The small mass of the wheel was obtained by selection of a special aluminium hoop with thin spokes and a light nave. The wheel is placed in two ball bearings with dimensions 6/10 mm, which results in insignificant movement resistance. The aluminium wheel was cut with 130 000 notches in order to determine the acceleration of the wheel and its angular velocity. The vessel has positioning system which gives the opportunity for measurements with varying distance from the wall. The sphere used in experiment is a physical model of gas bubble moving in vertical direction along the wall. The sphere movement was forced by the mass m falling down due to gravity on the opposite side of the wheel. The drag force was measured by means of tensometric force adapters of SCAIME type, measuring the tension in a steel string with the diameter of 0.35 mm. Tension on the perimeter of string is not taken into account, because of water environment (in author’s opinion the viscous effect is negligible). The adapters were placed in the wheel bearing support. The sphere movement was also recorded by digital camera enabling taking 25 frames per second. This enables to observe a wall effect, it means deviation of the sphere trajectory.
c (5)
3. Model of wall forces acting on single bubble
Observations during experiments showed, that the sphere trajectory (the bubble model) depends on the bubble initial position, that is the distance in x direction (Fig. 3). If the sphere, in the initial time, is located very close to the wall, then the trajectory has significant deviation during the rising (Fig. 3). It is an evidence of repelling force from the wall. This effect lessens with increasing distance between the sphere and the wall and finally disappears.
The Eq. (2) should be solved, with different initial sphere and wall distance values to predict F values. In the first approximation it has been assumed that both forces F and N are independent of time and the angle D is a mean value of deviation from the vertical direction.
First integration of Eq. (2) leads to:
1 D)t C
F sin N F ( t d x d
m D (6)
and another integration yields:
2 1 2
D)t2 Ct C
F sin N F (
mx D (7)
Constants C1 and C2 in equations (6) and (7) are estimated from the boundary conditions:
t = 0 x = x0 (8)
t = tc x = h (9)
Thus constants in Eq. (6) and Eq. (7) are:
2 t ) F sin N F ( t x h m C C D C 0
1 D (10)
0
2 mx
C (11)
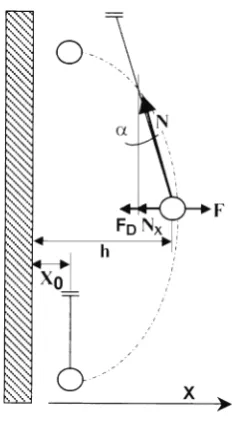
Fig. 3. A part of the sphere trajectory
Taking to account constants (10) and (11) Eq. (7) can be expressed:
The analysis range is placed between the moment when the repulsive force arises and when the repulsive force reaches its minimum. The drag force (FD) and the horizontal component of the string force (Nx) is compensated by the repulsion force at each location. The largest repulsion force acts near the wall, F and our aim was to correlate it.
t 2 t t ) F sin N F ( ) x t t x h x ( m C D 0 c 0 ¸ ¹ · ¨ © § D (12)
The quantities appearing in Eq. (12), i.e. displacement x, force N(t), maximum sphere trajectory deviation h, and time required to reach the maximum deflection tc and
finally angle D between the steel string and vertical direction are measured directly in the experimental rig. The sphere mass m is also known. The force F, related to initial sphere and wall position, is the one and only unknown value.
There is a possibility to determine values of F experimentally. The sphere motion equation in the direction perpendicular to the wall can be expressed in the form: ) t ( F ) t ( N ) x ( F t d d
m - X D (2)
4. Experimental verification of the theoretical model where 22
t d x d t d d
and NX(t) N(t)sinD(t), (3)
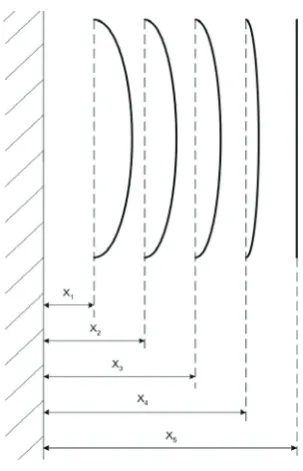
The sphere movement trajectory can be predicted by solving Eq. (12). The experiments where carried out with two spheres of different diameters: D = 40 mm and D = 30 mm. The experimental results showing the trajectories of spheres are presented in Fig. 4 and Fig. 5. In the presented cases the mass causing the sphere movement is m=2g. The experiments where also carried out with other loads, i.e. m=5g and m=10g. The repulsive force decreases when the initial distance from the wall increases, according to a schematic presented in Fig. 6. Experiments show that the effect connected with presence of the wall disappears when the initial distance between The drag form can be expressed as:
A 2 c
FD DU-2 (4)
the sphere and the wall exceeds about 1,5 sphere diameter in the case of excitation of m=2g. The comparison of proposed model predictions with experimental data are shown in Fig. 4. In Fig. 7 and Fig. 8 presented are mean values of the repelling force. Value of the force was determined for varying values of x and t in Eq. (12). Such force has an exponential character, however authors were yet unable to devise a general correlation describing such repelling force. Satisfactory consistency between measurements and the model has been obtained.
0,41 0,42 0,43 0,44 0,45 0,46 0,47 0,48 0,49 0,50 0,51
0 0,5 1 1,5 2 2,5 3
distance [cm]
force
[mN
]
Fig. 4. Comparison between experimental and calculated
values of repelling force (D=40mm, m=2g, xo=8mm)
Fig. 5. Photograph of the sphere trajectory (D=30mm,
m=2g, x0=1mm)
Fig. 7. Repelling force calculated for various values of distance between the sphere and the wall
(D=40mm, m=2g, x0=0,8cm)
0,03 0,06 0,09 0,12 0,15 0,18
0 0,1 0,2 0,3 0,4 0,5 0,6 0,7
distance [cm]
force [mN]
Fig. 8. Repelling force calculated for various values of distance between the sphere and the wall
(D=30mm, m=2g, x0=0,1cm).
Fig. 6. Sphere trajectories for different initial distance between sphere and wall.
5. Conclusion
References [3] Marié, J.L.; Moursali, E.; Tran-Tong, S.: Similarity law and turbulence intensity profiles in a bubble layer at low void fractions. Int. J. Multiphase Flow, 23, 227-247, 1997.
[1] Yan Y.Y., Lin T.F.: Evaporation heat transfer and pressure drop of refrigerant R-134a in a small pipe. Int. Journal of Heat and Mass Transfer, vol.41,
4183-4194, 1998. [4] Mikielewicz D.: Hydrodynamics and heat transfer in bubbly flow in the turbulent boundary layer. Int. J. of Heat and Mass Transfer, vol. 46, 207-220, 2002. [2] Huo X., Tian Y.S., Wadekar V.V., Karayiannis
T.G.: Two-phase flow and boiling heat transfer in small diameter tubes. Raport South Bank University 1999.