Http://www.ijetmr.com©International Journal of Engineering Technologies and Management Research [44]
CONSUMER PERCEPTIONS ON STORE ATTRIBUTES: AN INSIGHT
INTO CONSUMER BEHAVIOUR
Dr. K. Aparna 1, Dr. P. Murali Krishna 2, Dr. V. Satish Kumar 3
*1 Assistant Professor in Humanities & Basic Science Department G. Pulla Reddy Engineering
College (Autonomous) Kurnool – 518007, India
2 Professor of Management & Dean, Industry Interface & International Collaboration (IIIC)
Sri Krishnadevaraya University ANANTAPUR (AP) – 515003, India
3 Dr. V. Satish Kumar, Professor of Industrial Management G. Pulla Reddy Engineering College
(Autonomous) Kurnool – 518007, India Abstract:
Determining the dynamics of consumer behaviour is most challenging task for any marketer. It is, especially, important for retailers to develop in-depth consumer insight as they are in direct contact with customers and as purchasing has become increasingly experience-oriented. Now customers expect better purchasing experience with a wide range of merchandise, store ambience and visual merchandising.
The Indian retail sector is witnessing a sea change and the emerging market is a spectator of major change in the growth pattern. Both existing and new players are trying out with new retail formats. These emerging retail formats offer extensive range to customers and offer an ideal shopping experience with a blend of product, entertainment, food and service, all under a single roof. Changing tastes and preferences of consumers’ are leading to necessary change in standard of living and spending pattern and this in turn is leading to surge in new business opportunities
Thus, retailers have to make continuous innovations to enrich the shopping experience. Modern retailers may try to distinguish themselves on the basis of improved shopping experience from conventional retailers.
Keywords: Consumer Behaviour; Preferences; Retail Format; Satisfaction; Shopping; Strategies; Store Attributes.
Cite This Article: Dr. K. Aparna, Dr. P. Murali Krishna, and Dr. V. Satish Kumar. (2019). “CONSUMER PERCEPTIONS ON STORE ATTRIBUTES: AN INSIGHT INTO CONSUMER BEHAVIOUR.” International Journal of Engineering Technologies and Management Research,
6(4), 44-49. DOI: https://doi.org/10.29121/ijetmr.v6.i4.2019.369.
1. Introduction
Http://www.ijetmr.com©International Journal of Engineering Technologies and Management Research [45] Many studies have been conducted to analyse the relation between consumer values and some major store attributes. An effort is made to examine the perceptions of sample consumers on the store attributes. One of the major determinants of choice of a retail store is the store image. It is largely based on store attributes. Combined with such consumer characteristics as shopping orientation, store attributes help retailers to foresee which retail outlets consumers will prefer.
The present study is an attempt to understand the association between the choice of retail formats based on store attributes relating to the atmosphere, location, prices, promotion, service, satisfaction and loyalty in order to arrive at meaningful retail mix strategies.
As already indicated, opinion of the customer is extremely important to any organisation for sustaining in the market. It is with close association alone the information about the stores' reputation, its attitude towards customers and thereby measuring background, the researcher has made an attempt to study the important determinants of store attributes influencing the buying decision of consumers.
2. Objective of the Study
To study the major store attributes influencing the consumers towards choice of retail Outlet.
The related hypothesis is:
Ho: there is no significant impact of store attributes on the selection of retail outlet.
H1: there is significant impact of store attributes on the selection of retail outlet.
3. Statistical Analysis on Store Attributes
The researcher further attempted to subject the raw data for statistical analysis. For this factor analysis, reliability test and testing of hypotheses are carried out to validate the data and results of analysis.
Factor Analysis for Store Attributes
The Principal Component Factor Analysis (PCA) with Varimax Rotation was performed for 29 items measuring store attributes to determine the important factors of store attributes influencing buying decision of customer,
The result indicated that the Bartlett’s Test of Sphericity was significant (Chi-Square – 33247.447, p<0.000). The Kaiser-Meyer-Olkin (KMO) measure of sampling adequacy was higher at 0.971. This KMO value of 0.971 is excellent since it exceeded the recommended value of 0.60 (Kaiser, 1974). The two results (KMO and Bartlett’s) suggested that the data is appropriate to proceed with the factor analysis.
Table 1: KMO and Bartlett's Test for Store Attributes Kaiser-Meyer-Olkin Measure of Sampling Adequacy. .971 Bartlett's Test of Sphericity Approx. Chi-Square 33247.447
df 406
Sig. .000
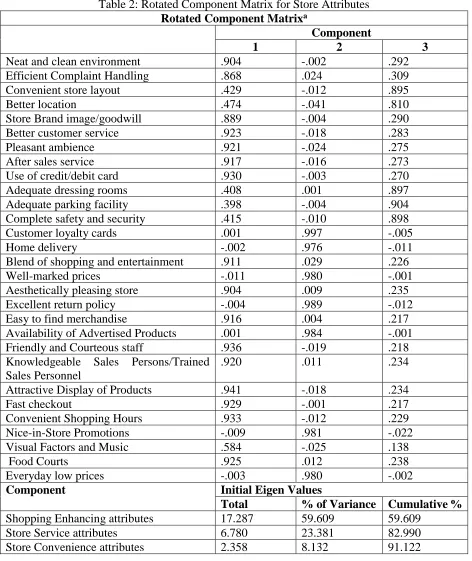
Http://www.ijetmr.com©International Journal of Engineering Technologies and Management Research [46] Four rounds of EFAs were performed before it extracted three (3) distinct dimensions with Eigen value exceeding 1.0. The total variance explained for the three dimensions is 91.12. The contribution from the component 1, component 2 and component 3 are 59.60, 23.381 and 8.132 respectively. The following table presents the Rotated Component Matrix for dimension of retail store selection.
Table 2: Rotated Component Matrix for Store Attributes Rotated Component Matrixa
Component
1 2 3
Neat and clean environment .904 -.002 .292
Efficient Complaint Handling .868 .024 .309
Convenient store layout .429 -.012 .895
Better location .474 -.041 .810
Store Brand image/goodwill .889 -.004 .290
Better customer service .923 -.018 .283
Pleasant ambience .921 -.024 .275
After sales service .917 -.016 .273
Use of credit/debit card .930 -.003 .270
Adequate dressing rooms .408 .001 .897
Adequate parking facility .398 -.004 .904
Complete safety and security .415 -.010 .898
Customer loyalty cards .001 .997 -.005
Home delivery -.002 .976 -.011
Blend of shopping and entertainment .911 .029 .226
Well-marked prices -.011 .980 -.001
Aesthetically pleasing store .904 .009 .235
Excellent return policy -.004 .989 -.012
Easy to find merchandise .916 .004 .217
Availability of Advertised Products .001 .984 -.001
Friendly and Courteous staff .936 -.019 .218
Knowledgeable Sales Persons/Trained Sales Personnel
.920 .011 .234
Attractive Display of Products .941 -.018 .234
Fast checkout .929 -.001 .217
Convenient Shopping Hours .933 -.012 .229
Nice-in-Store Promotions -.009 .981 -.022
Visual Factors and Music .584 -.025 .138
Food Courts .925 .012 .238
Everyday low prices -.003 .980 -.002
Component Initial Eigen Values
Total % of Variance Cumulative %
Shopping Enhancing attributes 17.287 59.609 59.609
Store Service attributes 6.780 23.381 82.990
Http://www.ijetmr.com©International Journal of Engineering Technologies and Management Research [47] Extraction Method: Principal Component Analysis.
Rotation Method: Varimax with Kaiser Normalization
Rotation converged in 4 iterations.
Source: Statistical Analysis on Field Data
Explanation of the factors derived
The factor analysis extracted three factors out of 29 variables relating to store attributes on which data was collected from the customers. These factors are referred as components.
Component 1 was named as "Shopping Enhancing factors", since it comprised of items are measuring the characteristics which draw the customers into the store. The component 1 comprises of such items as Neat and clean environment, Efficient Complaint Handling, Store Brand image/goodwill, Better customer service, Pleasant ambience, After sales service, Use of credit/debit card, Blend of shopping and entertainment, Aesthetically pleasing store, Easy to find merchandise, friendly and Courteous staff Knowledgeable Sales Persons, Attractive Display of Products Fast checkout Convenient Shopping Hours Visual Factors and music Food Courts.
Component 2 was named as “Store Service attribute “, since it reflects the service provided by the store to attract the customers. These items are Customer loyalty cards, Home delivery, Well-marked prices, Excellent return policy, and Availability of Advertised Products, nice-in store promotions and Everyday low prices.
Component 3 was named as “Store Convenience attributes“, to refer to the convenient store layout, Better location, Adequate dressing rooms, Adequate parking facility and Complete safety and security.
In short the EFA performed to determine the factors considered in retail store selection decision emerged three factors ranging from (1) Shopping Enhancing factors (2) Store Service factors and (3) Store Convenience factors.
4. Reliability Test
A reliability test is also conducted to ensure that the instrument measures are consistent and stable over time. In other words, the reliability of the measure is without bias (error free) and, hence, ensures consistent measurement across time and across the various items in the instruments.
In the present study, the reliability of the standardized scales was confirmed using Cron-bach's coefficient alpha. The higher the coefficients, the better the measuring instruments. However, according, to theory, Cronbach's alpha should be at least 0.7 to be considered as acceptable. In this study, all the Cronbach's alpha coefficients show a value higher than 0.07 meeting minimum acceptable requirement.
Http://www.ijetmr.com©International Journal of Engineering Technologies and Management Research [48] 5. Conclusion
The survival of the retailer depends on the behaviour of customer. When everything revolves around the customer, then understanding customer is imperative. It varies across different categories. There has been an exceptional change in the Indian consumer. Liberalisation and steady economic growth have been the main factors that have driven the change.
The behaviour of retail consumer varies across markets. A mix of factors like range of merchandise sold in the store, the convenience of the outlet, the time spent on travelling to the store, the socio-economic background, the culture and the stage of the family life cycle that the consumer is in, all influence the buying behaviour. After the recognition of need for a product, consumers look for information about the product and the place where he can make the purchase. Depending on the criteria important to him, the consumer evaluates various options available and narrows down the choice to a few stores where he may make the purchase. A buying decision is then made. The experience during and after the purchase leads to satisfaction or dissatisfaction with the particular store.
With this backdrop an attempt is made to study the relationship between store attributes and consumer choice of a retail store. The study has taken the influence of store attributes on consumers’ purchase intention. In case of store attributes, shopping enhancing factors are considered more vital than store service factors and store convenience factors. In a nutshell analyzing consumer perceptions intends to develop various strategies which can give competitive edge to retailers.
References
[1] Swapna Pradhan (3rd Edition) Retailing Management: Text & cases NewDelhi:Tata McGraw Hill [2] Mishra, M.S. (2007). The consumption pattern of Indian Consumers: choice between traditional
and organized Retail. http://ssrn.com/abstract=994238.
[3] Tendai, M., and Crispen, C. (2009). In-store shopping environment and impulsive buying. African Journal of Marketing Management, 1(4), 102-108.
[4] C.R.Kothari 2007). Research Methodology:Methods & Techniques (Rev.Second Ed.), NewDElhi: New Age International Pubishers
[5] Frankfort-Nachmias, C., & Nachmias, D. (1996). Research methods in social sciences (5 ed.). London: Arnold.
[6] Jackson, P., Aguila, R.P.D., Clarke, I., Hallsworth, A., Kervenoael, R.D., and Kirkup, M. (2006). Retail restructuring and consumer choice 2: understanding consumer choice at the household level. Environment and Planning A, 38 (1), 47-67.
[7] Baltas, G., & Papstathopoulou, P. (2003). Shopper characteristics, product and store choice criteria: a survey in the Greek grocery sector. International Journal of Retail & Distribution Management, 31(10), 498-507.
[8] Dalwadi, R., Rathod, H.S., and Patel, A. (2010). Key Retail Store Attributes Determining Consumers’ Perceptions: An Empirical Study of Consumers of Retail Stores Located in Ahmadabad (Gujarat). SIES Journal of Management, 7(1), 20-34.
[9] Erdem, O., Oumlil, A.B., and Tuncalp, S. (1999). Consumer values and the importance of store attributes. International Journal of Retail & Distribution Management, 27(4), 137-144.
Http://www.ijetmr.com©International Journal of Engineering Technologies and Management Research [49] [11] Ghosh, P., V. Tripathi, and A. Kumar. (2010). Customer expectations of store attributes: A study
of organized retail outlets in India. Journal of Retail & Leisure Property, 9(1), 75-87.
[12] Baker, j., Dhruv Grewal, & Parasuraman, a. (1994). The influence of store environment on quality inferences and store image. Journal of the Academy of Marketing Science, 22(4), 328-339.
[13] Baker, J., Dhruv Grewal, & Michael Levy. (1992, Winter). An experimental approach to making retail store environmental decisions. Journal of Retailing, 445-460.
[14] KVS Madaan.(2009). Fundamentals of Retailing NewDelhi:Tata McGraw Hill
[15] Kotler, P., & Armstrong, G. (2008). Marketing: an introduction (9 ed.). New Jersey: Pearson Prentice Hall.
[16] Dr.Harjit Singh (2009). Retail Management: A Global Perspective Text and Cases NewDelhi:S.chand & Company Ltd
*Corresponding author.