Http://www.ijetmr.com©International Journal of Engineering Technologies and Management Research [17]
DEVELOPMENT AND TESTING OF ARROWROOT (MARANTHA
ARUNDINACEA L.) GRINDING MACHINE
Alexander M. Pascua *1
*1 School of Agriculture, Fisheries and Natural Sciences, Marinduque State College, Philippines Abstract:
An arrowroot grinding machine was developed and evaluated in terms of functional performance and cost effectiveness. The model consists of different component assembly parts such as transmission, rasper, crusher and base frame. It is powered by a 7.5 hp gasoline engine. Its salient features such as: 1) made of locally available food grade materials, 2) portable and 3)can be operated by a single person, give it the edge over other existing machines in attaining effective processing. The model has an overall cost of P65,000.00.
The effects of different factors which include the machine speed, tuber size and tuber maturity on the response variables such as power requirement, processing time, machine capacity and efficiency (percent starch recovery) were observed. RSReg and Response Surface Methodology (RSM) were used to determine the effect of the treatment factors and optimum performance of the machine; respectively. Experimental runs using Box and Behnken design with three level-incomplete factorial designs were conducted. Results revealed that change on the levels of treatment factors significantly affect most of the response variables. Data obtained from the response variables mostly fit the linear and quadratic regression models.
Results of evaluation revealed that the model is capable of grinding arrowroot tubers with average power consumption of 0.85 kW, processing time of 7.85 minutes, capacity of 46.6 kilograms per hour and efficiency (starch recovery) of 16.6%. Verification tests indicated that the actual values of responses were relatively close to the predicted values. Further, financial analysis showed that the machine was economically feasible for small scale farm arrowroot production with payback period of 0.343 years or 4 months and 3 days, break-even point of around 350 kg per year and benefit cost ratio of 1.96.
Keywords: Arrowroot; Grinder; Capacity; Efficiency; Optimization.
Cite This Article: Alexander M. Pascua. (2018). “DEVELOPMENT AND TESTING OF ARROWROOT (MARANTHA ARUNDINACEA L.) GRINDING MACHINE.” International
Journal of Engineering Technologies and Management Research, 5(7), 17-30. DOI:
https://doi.org/10.29121/ijetmr.v5.i7.2018.255.
1. Introduction
Http://www.ijetmr.com©International Journal of Engineering Technologies and Management Research [18]
sufficient moisture throughout its growing period. It can also be planted in shaded areas although yield is highly reduced.
Marinduque is an island province in the Southern Region of the Philippines with a total land area of 95925 hectares (PCIP, 2017). Out of the total land area, 53587.05 hectares or 56.9% are agricultural lands. In 2014, coconut farms comprise 35450 hectares or around 66% of the total agricultural land area which shows that coconut is the major livelihood of people in the province (PSA, 2017). However, maximum utilization of coconut farms by raising other potential crops is not being explored by majority of the farmers. Very few are engaged in inter-cropping scheme for it is only around 421 hectares or 0.74% of the total agricultural land area is utilized for growing root crops (PAO, 2007). Development and adaptation of improved technologies that would give opportunity for other potential crops as food source should be studied (Malinis and Pacardo, 2012). One potentially and very promising crop is arrowroot (Marantha arundinacea) locally known as “uraro” which rhizomes are readily available source of energy.
Arrowroot flour extracted from the rhizomes is of superior quality and an important ingredient that can be made into biscuits, cookies and other delicacies which are popular not only in Marinduque but also in the provinces of Laguna and Pampanga, Philippines. There are bakery businesses producing arrowroot cookies established in Marinduque but the present supply of arrowroot flour is not enough to meet the steadily growing demand of the said delicacy. Low arrowroot flour production is attributed with the method of processing arrowroot tuber using the traditional practice of flour extraction. Aside from being labor intensive which requires 6 to 7 persons and time consuming, the traditional method (Figure 1) has a very low extraction capacity and efficiency.
Http://www.ijetmr.com©International Journal of Engineering Technologies and Management Research [19]
kilograms (kgs). It has a capacity of 100 kgs fresh arrowroot which can be powdered in 25 minutes and with a production of 8 kgs powder or flour or an equivalent flour recovery of 8%.
Despite the enormous data available in the literature for agricultural products, there is limited information on the design and development of machines for grinding fresh arrowroot tubers and their flour extraction efficiency. The aim of the work reported in this paper was to develop a motor-operated mobile arrowroot grinding machine made of food grade materials which can increase flour production in the future and eventually help in sustaining the demand for arrowroot products in the province.
Figure 1: Traditional method of crushing/grinding arrowroot tubers using coconut trunk locally known as “Ilod” in Barangay, Poctoy, Torrijos, Marinduque, Philippines
2. Materials and Methods
The materials used for the fabrication of the model composed of angle and flat bars, stainless steel sheets, pulleys, v-belts, pillow block bearings, welding rod for stainless steel, bolts and nuts,paints and thinner. The machine was powered by a 7.5 hp gasoline engine. Arrowroot tubers harvested at the same maturity were used for the performance testing of the model.
Description of the Component Parts
The pictorial drawing of the arrowroot machine is shown in Figure 2. It consists of rasper or grater assembly and crusher or presser assembly with the following components and functions as listed and described below:
1) Power assembly- A single cylinder, air-cooled gasoline engine was used as prime mover. A 76.2 mm diameter v-pulley is attached to the engine shaft which drives the 108 mm diameter v-pulley connected to the rasper drum shaft thru a v-shaped belt. The other end of the shaft of the rasper blade was attached to 65mm v- pulley which then served as driver for the presser/extruder assembly placed at the bottom of the rasper assembly. All components can be easily assembled or disassembled to allow replacement during operation and maintenance.
Http://www.ijetmr.com©International Journal of Engineering Technologies and Management Research [20]
3) Rasper blades- The rasper blades are the serrated part of the cylindrical drum made of stainless steel sheet as result of punching holes on the sheet. The serration is a saw-tooth like blade, which served as the crusher mechanism for arrowroot tubers.
4) Rasper Blade housing- The housing was made of stainless steel plain sheet where the cylindrical drum with saw-tooth blades was installed. Brace supports were used for the installation of the housing to the machine frame. It has a hopper made of stainless steel sheet to accommodate more tubers during operation.
5) Crusher- This is made of food grade plain stainless steel sheet welded on a stainless steel shaft, which served as conveyor to crush/squeeze grated arrowroot tubers to separate the juice from the fiber.
6) Crusher housing- The housing was also made of plain stainless steel sheet where the crusher/presser assembly is assembled.
7) Fastening parts. These parts are bolts, nuts, washers, which connect and attach the different machine elements as well as the frame of the machine itself.
Figure 2: Pictorial drawing of the model
Principles of Operation
The arrowroot machine consists of two operations namely: rasping or grating and crushing. The first operation is being able to grate the arrowroot tubers to loosen the starch and the fiber. This process requires the rotational force of the rasper blade to effect grating action. The blade also pushes crushed tubers at the other end to convey them at the crusher or presser assembly to effect extraction of arrowroot juice from the fiber or bagasse.
The operations begin as soon as the engine (prime mover) is started. Cranking the engine is done manually through a cranking lever. Feeding of arrowroot tubers is done manually at the hopper and extracted juice and fiber are collected at the bottom of the crusher assembly.
Description of the Instruments
Http://www.ijetmr.com©International Journal of Engineering Technologies and Management Research [21]
parts: 1) outer case, 2) hall sensor, 3) end caps, 4) shaft, ball bearings, 5) donut circuit, 6) flux gate coil, bobbin, slip ring, board, laminated magnetic shielding and plastic tube spacer. The calibration curve of the torque transducer is shown in Figure 3. The relationship was linear which confirmed the derived equation through regression analysis:
Y = 3.14x – 12. 55, r2 = 0.997 Where: y = torque, Kg-m
X = voltage, mV X- intercept, c = 5.15 Constant, b = 3.14
The calibration constant and intercept were inputted to the values in the data logger calibration which is the readout of the sensor and at the same time storage of data.
Figure 3: Relationship between load (torque, kg-m) and voltage (millivolts)
Data logger/amplifier/multi-meter. This instrument receives signal from the sensor, signal conditioning system and also serves as data storage. This can store data up to more than 3000. The logger can be set to one (1) second for storing data. Power was supplied by a 12 volts DC battery.
Tachometer. This was used to measure the engine and grinder speed. It can be set into two measuring modes by turning the switch to photo detect. Features include five digit display, measurements up to 50,000 RPM and readings obtained at a rate of one per second. It has a resolution and accuracy of 0.1 rpm and (+/-) 0.5% + 1 digit; respectively. It is operated with “AA” type battery.
Testing and Evaluation
Http://www.ijetmr.com©International Journal of Engineering Technologies and Management Research [22]
machine was assembled, series of initial test was conducted to check for possible defects and improvement of the model. This ensured that each assembly would run well during actual tests. Testing and evaluation were done by measuring the torque and power requirement, processing time, machine’s capacity and efficiency. These parameters were determined as follows:
Power requirement. This was determined by measuring the average torque of the machine’s grinder multiplied by the shaft speed divided by 1000 as:
Ave. torque = ∑torque readings (Equation 1) Number of readings
Ave. power (kW) = = Torque (kg-m) x grinding speed (rpm) x 1.03 (Equation 2) 1000
Processing Time (PT). The processing time (PT) was determined by recording the time (in minutes) of sample arrowroot tubers using a stop watch in attaining complete rasping and crushing per test run.
Machine Capacity (MC). Machine capacity (MC) is the ability of the machine to grate and crush certain amount of tubers with recorded time of processing in kilograms per hour.
Machine Efficiency (ME). The machine efficiency (ME) or percent starch recovery was determined by dividing the weight of extracted flour by the initial weight of tubers times 100 percent.
Financial Feasibility
The financial feasibility of the machine was determined using cost and return analysis which include: break-even point, payback period and benefit/cost ratio. The formulas are given by Toquero, Catanus, Ebron, and Maranan (1988) as follows:
Break-Even Point (BEP). This is the level at which the investment operation would neither incur a loss nor produce a profit or the rate at which the machine or a given investment should be used in order to cover annual costs.
BEP = TFC / (SP-Cst) (Equation 3)
where: BEP = Break-even point, kg/yr TFC = Total fixed cost per year, P/yr
SP = selling price per kg, P/kg Cst = cost per kg, P/kg
Payback Period (PP). This measure approximates the length of time from the beginning of an investment until net benefits equal the costs of the capital investment. It is the span of time needed or required to recover the money or capital invested.
Http://www.ijetmr.com©International Journal of Engineering Technologies and Management Research [23]
where: PP = Payback period, yrs IC = Investment cost, P ANB = Annual net benefit, P/yr
Benefit/Cost Ratio (BCR). This is the ratio of the present value of gross benefits divided by the present value of gross costs. The BCR should be greater than one to indicate that the investment being evaluated is profitable.
BCR = PWB / (PWC + IC) (Equation 5)
where: BCR = Payback period
PWB = Present worth benefit, P PWC = Present worth costs, P
IC = Investment cost, P
Statistical Analysis
The data were analyzed statistically using 2x3X3 Factorial in Completely Randomized Design (CRD) with two machine speed, three arrowroot tuber sizes (length in mm) and three tuber maturity (months). The data generated from the test runs were analyzed using the Response Surface Regression (PROC RSREG) which includes the analysis of variance (ANOVA), regression analysis, and calculations of regression coefficients and Duncan’s Multiple Range Test (DMRT) at 95% level of significance.
The data gathered were also statistically analyzed using the Response Surface Methodology (RSM) of the Box and Behnken design (1960) to determine the optimum combination of the independent variables that would result in the optimum grinding performance of the model. This was done to obtain an optimal response using a set of designed experiment in an approximated first degree polynomial model. Further, verification of the response models was conducted by separate test runs using derived optimum values. The results were compared with computed data using analysis of variance (ANOVA) subjected to 95% level of confidence.
3. Results and Discussions
Specification of the Model
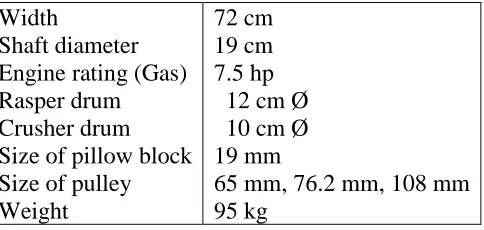
The specification of the model is presented in Table 1. The machine is portable, compact and made from locally available food grade materials. It has a length, width, height and weight of 80 cm, 72 cm, 64 cm and 95 kg; respectively. The rasping assembly consists of rasper drum (12 cm external diameter by 40 cm length) and housing while the crushing assembly consists of screw conveyor type presser (10 cm external diameter by 35 cm length) and extruder. The assembly parts were supported by 19 mm diameter stainless steel shafting. The model is driven by 7.5 hp gasoline engine.
Table 1: Design specification of the model
Specification Size
Height Length
Http://www.ijetmr.com©International Journal of Engineering Technologies and Management Research [24]
Width
Shaft diameter Engine rating (Gas) Rasper drum Crusher drum Size of pillow block Size of pulley Weight
72 cm 19 cm 7.5 hp 12 cm Ø 10 cm Ø 19 mm
65 mm, 76.2 mm, 108 mm 95 kg
Evaluation of the Model
Result of analysis using the factorial experiment revealed that only the simple effects of machine speed and maturity on processing time was significant at 95% level of significance as presented in Table 2. It shows that lower time of processing (7.47 minutes) was attained using 425 rpm as compared to 225 rpm with 8.38 minutes. Higher processing time of 8.54 minutes was accounted from 10 months tuber maturity as compared significantly with 8 and 9 months old. However, analysis indicates that simple effect of tuber size was not significant. Although lower processing time (7.62 minutes) was observed on medium tubers, it is statistically not significant compared with large tubers with 8.38 minutes. This means that the model can accommodate any size of tubers during processing operation.
The simple and interaction effects of speed and tuber size were significant on capacity at 95% level of confidence. This reveals that machine speed and tuber size would vary greatly in terms of machine capacity. Higher speed gave a higher capacity as compared with lower speed as shown in Table 2. Similarly, the effect of tuber size revealed significance with the highest mean capacity at medium size. However, maturity was not statistically significant at 95% level of significance.
Analysis also revealed that the simple and interaction effects of treatments on efficiency (Starch Recovery) were significant at 95% level of significance. It was observed that 225 rpm had higher percentage starch recovery of 17.54% compared with 425 rpm with 14.69%. This might be associated with the length of time for grating and crushing the tubers which effected better extraction of arrowroot juice. Higher efficiency was observed using medium size tubers and statistically significant compared with small and large tubers at 95% level of confidence. Higher efficiency was also noted at 9 months old tubers as compared with 8 and 10 months old.
Table 2: Processing time, machine capacity and efficiency as affected by the change in machine speed, tuber size and maturity
Variables
Speed (rpm) Tuber Size (cm) Maturity (months)
Low (225) High (425) Small (8.5-13.4) Medium (13.5-18.4) Large (18.5-23.4)
8 9 10
Processing Time
(minutes) 8.38
a
7.47b 7.77a 7.62a 8.38a 7.26 a 7.35 a 8.54 b
Capacity (kg/hr) 43.80 a
48.60 b 46.82b 48.10 b 48.00 b 45.49 a 48.63 a 48.25 a Efficiency (%) 17.54 a
14.69 b 15.90a 17.21 b 15.24 a 16.24 a 18.65 b 17.15 a
* Means followed by a common letter(s) are not significantly different at 95% level by DMRT
Http://www.ijetmr.com©International Journal of Engineering Technologies and Management Research [25]
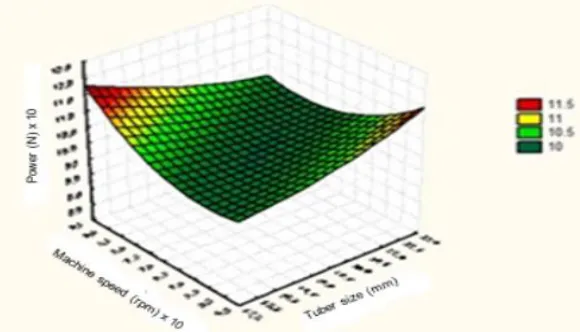
of confidence (Figure 4). However, power was not affected by tuber size which suggests that almost similar load could be applied on whatever sizes of tubers (Figure 5). The data obtained for grinding significantly fit the linear and quadratic models. The total model was also significant with R2 value of 0.8684 (Table 3). This means that about 87% of the variation in the response was accounted by the function (Gomez and Gomez, 1984). The unaccounted variability could be attributed to other factors that were not considered in the study. This shows that alteration in power was affected by the machine speed since higher speed requires lower grinding force. Moreover, power was also accounted for by the variation in tuber maturity. Large and mature tubers required higher force which might be due to the fact that they are harder and with larger surface area being in contact with the grinding blades. However, the lack of fit test for the data was significant at 95% confidence level (Table 3). Data variations generated from sources other than the first-order linear term signifies lack of fit of produced data (Myers and Montgomery, 1995). This indicates that the regression function is non-linear.
Figure 4: Variation on generated power as affected by the change in machine speed and tuber maturity
Http://www.ijetmr.com©International Journal of Engineering Technologies and Management Research [26]
The change in processing time was significantly affected by the variation in machine’s speed (rpm), tuber size, and tuber maturity at 95% confidence levels. The data obtained for processing time also significantly fit the linear, quadratic, and cross product regression models. The total model was also significant and the adequacy of the estimated model had a high R2 value of 0.86 (Table 3). This also means that the total variation in processing time was accounted for by the machine speed (rpm), tuber size (cm) and tuber maturity (months). Further, the lack of fit test was not significant at 95% confidence level. This indicates that the data fit the estimated model since there was little variation in the data obtained as evidenced by a low CV value of 10.62% (Table 4).
The machine capacity was significantly affected by the machine speed, tuber size and tuber maturity at 95% confidence level. Thus more tubers were grinded when the machine was operated at higher speed. Further, higher capacity was also observed using less mature but larger tuber size. The data obtained for machine capacity also significantly fit the linear and quadratic regression models. The total model was significant and the adequacy of estimated model had a R2 value of
0.7401 and with 14.67% CV (Table 3). However, the lack of fit test for the data was found to be insignificant which means that the data obtained fit the estimated model (Table 4).
The change in machine efficiency was significantly affected by the variation in tuber size and tuber maturity. However, efficiency was found to be not affected by machine speed. Thus, more flour can be extracted with mature and larger tuber sizes at whatever operating speed of the machine. The data obtained for machine efficiency significantly fits the linear and quadratic regression models (Table 4). The total model was also significant with R2 value of 0.8968. However, lack of fit test was not significant which indicates that the data fits the estimated model (Table 4).
Table 3: Adequacy of estimated model.
Factor Degrees of Freedom Sum of Squares R2 Fvalue Pr>F
Power
Linear 2 24.065855 0.6857 54.72 0.0001* Quadratic 2 3.272793 0.2080 9.89 0.0001* Cross Product 2 2.513101 0.0724 7.01 0.0020* Total Model 6 31.292336 0.8684 25.53 0.0001* Processing Time
Linear 2 21.499362 0.5071 21.34 0.0001* Quadratic 2 16.551426 0.3965 28.97 0.0001* Cross Product 2 3.250043 0.0546 4.97 0.0045* Total Model 6 43.700831 0.8583 21.75 0.0001* Machine Capacity
Linear 2 5.271355 0.3829 12.33 0.0001* Quadratic 2 7.228754 0.4178 17.95 0.0001* Cross Product 2 0.479409 0.0295 1.53 0.2842 Total Model 6 12.88129 0.7401 11.57 0.0001* Machine Efficiency
Http://www.ijetmr.com©International Journal of Engineering Technologies and Management Research [27]
Total Model 6 16.376689 0.8968 6.77 0.0001* Note: *Significant at 95% confidence level
Table 4: Lack of fit test for the estimated model.
Factor Degrees of Freedom Sum of Squares Mean Square Fvalue Pr>F
Power
Lack of Fit 3 1.358321 0.337113 3.04 0.0352* Pure Error 30 3.735133 0.112359
Total Error 34 4.576581 0.138045 Processing Time
Lack of Fit 3 1.410374 0.252827 1.12 0.3540 Pure Error 30 6.653792 0.213612
Total Error 34 7.573478 0.218094 Machine Capacity
Lack of Fit 3 2.747394 0.064783 0.4 0.8961 Pure Error 30 18.257724 0.136316
Total Error 34 24.374572 0.125390 Machine Efficiency
Lack of Fit 3 6.573267 0.745210 0.8 0.6315 Pure Error 30 19.753267 0.474221
Total Error 30 25.136732 0.150348 * Significant at 90% confidence level
Table 5 shows the significant effects of each individual independent variable and their interactions on each of the response variables (Y1 to Y4). Results showed that processing time (Y2) was the
most affected response variable by the treatment factors and their interactions followed by power (Y1), machine capacity (Y3) and efficiency (Y4). It can be observed that the interactions between
the machine speed and tuber size mostly influenced the power requirements while the interactions between tuber maturity and tuber size mostly affected the power, processing time and efficiency. Further, quadratic parameters were also found to have caused significant effect on the response variables.
Table 5: Regression coefficients of the second order polynomials describing the relationship of the response variables and independent variables
PARAMETERS COEF. Y1 Y2 Y3 Y4
Intercept ß0 27.7350** 87.0130** -32..539*0* -20.5420
X1 ß1 0.0230 -0.4130** 0.2100** -0.1100
X2 ß2 -3.4480** -5.8430** 5.0680** 11.2850
X3 ß3 0.2401** -0.4210** 0.1840 -0.2440
X1 * X1 ß4 0.0012 0.0029** -0.0018** 0.0003
X2* X1 ß5 -0.0089** -0.0048 0.0027 0.0007
X2* X2 ß6 0.2120** 0.1860** -0.1310** -0.2750
X3 * X1 ß7 -0.0002 -0.0012 0.0002 -0.0001
X3 * X2 ß8 -0.0086** 0.0160** -0.0039 -0.0540*
Http://www.ijetmr.com©International Journal of Engineering Technologies and Management Research [28]
Note: X1= “Machine speed”, X2= “Tuber size”, X3= “Tuber maturity”
Y1 = “Power”, Y2 =” Processing time”, Y3=” Capacity”, Y4=” Efficiency”
** Significant at 95% confidence level, * Significant at 90% confidence level
The derived models in predicting the relationships of the different significant response variables with the independent variables are given in Equations 6 to 9. The derived predictor equations were expressed using significant responses at 90% and 95% levels of confidence. However, all coefficients were considered in the models.
Y1 = 5.17 + 0.024X1 – 2.015X2 + 0.134X3 + 0.021X12 – 0.017X2X1 + 0.120X22 – 0.0021X3X1 –
0.0023X3X2 -0.0014 X32 (Equation 6)
Y2 = 68.053 - 0.204X1 – 4.324X2 - 0.305X3 + 0.013X12 – 0.002X2X1 + 0.144X22 – 0.0014X3X1 –
0.028X3X2 + 0.0031 X32 (Equation 7)
Y3 = 64.703 + 0.4201X1 + 7.042X2 + 0.211X3 - 0.032X12 + 0.015X2X1 - 0.116X22 +0.0013X3X1 –
0.0072X3X2 -0.0113 X32 (Equation 8)
Y4 = -38.018 - 0.201X1 + 15.204X2 - 0.137X3 + 0.00145X12 + 0.00012X2X1 - 0.520X22 -
0.0011X3X1 – 0.0530X3X2 + 0.041 X32
(Equation 9)
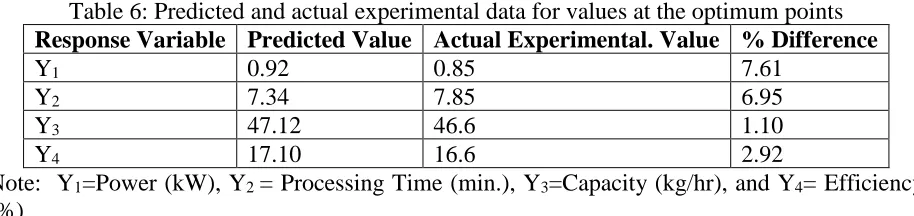
The predicted models of response variables were verified from generated optimum conditions. The verified values obtained from the verification test runs are shown in Table 6. The percent difference between the mean values of the predicted and actual responses was determined. It was found out that the verified values were reasonably close to the predicted values.
Table 6: Predicted and actual experimental data for values at the optimum points
Response Variable Predicted Value Actual Experimental. Value % Difference
Y1 0.92 0.85 7.61
Y2 7.34 7.85 6.95
Y3 47.12 46.6 1.10
Y4 17.10 16.6 2.92
Note: Y1=Power (kW), Y2 = Processing Time (min.), Y3=Capacity (kg/hr), and Y4= Efficiency
(%)
Presented inFigure 6 is the cost and return analysis of the machine. The model costs P65, 000.00 including the 7.5 hp gasoline engine as prime mover based on the cost incurred in the fabrication. However, this cost can be reduced when the machine is mass produced after the recommended modifications shall been made to further improve the functionality of themodel.
Http://www.ijetmr.com©International Journal of Engineering Technologies and Management Research [29]
Figure 6: Break-even analysis using total annual benefits (TAB) and total annual costs (TAC)
4. Conclusions and Recommendations
An arrowroot processing machine is a potential alternative approach of encouraging and motivating arrowroot farmers in increasing their farm size while improving the efficiency of work in the arrowroot production and processing. The model is compact, mobile, easy to operate, low cost and made from locally available food grade materials. Results of evaluation revealed that there were variations on the responses as affected of the machine speed, tuber size and maturity. Higher speed can process lower processing time but had lower starch recovery as compared to lower speed. Nine month old and medium size tubers showed significant increase in the capacity and efficiency of the model. The machine when fabricated and operated had a pay-back period of 4 months and 3 days, break-even point of 350 kg/yr and benefit-cost ratio of 1.96.
With the above results, it is then recommended that the model has to be operated at a higher speed if lower processing time is desired. However, it should to be operated at a speed not exceeding 225 rpm to achieve higher starch recovery with permissible processing time and capacity in processing mature tubers with larger sizes. It is further recommended to test the model by using different varieties of arrowroot tubers in extracting starch content.
References
[1] Box, G. E. P. and D. W. Behnken. 1960. Some New Three Level Designs for the Study of Qualitative Variables. Technometrics. Vol. 2 No. 4.
[2] Capiña, M. V. and Capiña, V. L. (2017). Arrowroot (Maranta Arundinacea): Starch Extraction, Processing, and By-Products Utilization. Proceedings: 4th International Conference on Civil, Environment and Waste Management (CEWM-17) Manila (Philippines). Retrieved from http://uruae.org/siteadmin/upload/2643AE0117711.pdf
[3] Gomez, K. A. and A. A. Gomez, 1984. Statistical Procedures for Agricultural Research, 2nd ed. John Wiley and Sons, Inc. New York, USA.
[4] Malinis, A. P. and Pacardo, C. O. (2012). Adaptation of Arrowroot (Maranta Arundinacea) Processing Technologies in Typhoon Prone Marginal Areas in Bicol. OIDA International Journal of Sustainable Development, Vol. 04, No. 03, pp. 51-62, 2012. Retrieved from
https://www.google.com.ph/?gws_rd=ssl#q=arrowroot+processing
Http://www.ijetmr.com©International Journal of Engineering Technologies and Management Research [30] [6] PAO. (2007). Annual Report of Marinduque Provincial Agriculture Office. Capitol Compound,
Bangbangalon, Boac, Marinduque,
[7] Pascua, A. M. (2015). Benchmark Survey of Existing Arrowroot Processing Machine, Unpublished Article, Marinduque State College, Philippines.
[8] PCIP (2017). Marinduque Provincial Commodity Investment Plan. Retrieved from https://www.google.com.ph/?gws_rd=ssl#q=total+agricultural+land+in+marinduque [9] PSA (2017). Annual Report. Philippine Statistics Authority. Retrieved from
https://www.google.com.ph/?gws_rd=ssl#q=psa+marinduque
[10] Tan, D. L. S. and Gayanilo, V. G. (1993). Technical evaluation of different systems in level processing of arrowroot starch. Philippine Root Crop Research and Training Center. Visayas State College of Agriculture. Baybay, Leyte, Philippines. Retrieved from
http://agris.fao.org/agris-search/search.do?recordID=PH19970084322
[11] Thomas, A. T. (2001). Arrowroot Grinding Machine. National Innovation Foundation, India. Retrieved from http://nif.org.in/innovation/arrowroot_grinding_machine/112
[12] Toquero, Z. F., Catanus, F. J., Ebron L. Z., and Maranan, C. L. (1988). Economic Analysis of IRRI-Designed Farm Machines. pp. 25-30
*Corresponding author.