1
Volume-4, Issue-4, August-2014,
ISSN No.: 2250-0758
International Journal of Engineering and Management Research
Available at:
www.ijemr.net
Page Number: 1-9
Placement Training Framework Development for MBA
Samuel Johnson Israel. K 1, Dr. Anand A Samuel 2 Dr. James Daniel Paul3 1Assistant Professor (SG), Vellore Institute of Technology University, INDIA
2
Pro Vice Chancellor, Vellore Institute of Technology University, INDIA 3
Professor, Vellore Institute of Technology University, INDIA
ABSTRACT
The premier management institutions survive the selectivity bias of the customers namely the students. The post graduate management students consider placement opportunities facilitated by the Institution even while choosing the institution. Hence the institutions also focus on the placement of students in many ways. One of the ways in which the students are placed is by providing placement training either through captive trainers or through the outsourced agencies. The success of the placement training depends on the framework or curriculum of the placement programmes. In this paper, the results of a survey which examines the different features that provides confidence to the students in placement interviews are analyzed the key factors identified are presented.
Keywords— Placement, Training, Framework Employability.
I.
INTRODUCTION
As demand for the management education is diminishing, the surviving management institutions depend on placement of the students. Students use different kinds of reviews to understand the take away of a course of an institution to another before deciding the institution of their study. There are many substandard institutions which are in the closure mode. The value addition is the critical factor in enhancing the demand for the management education. One of the key factors that determine the demand for management education is the placement. So most institutions, adopt different strategies. Few institutions, attempt to recruit working professionals for the course or those who are on a sabbatical for admissions. Few others hire specialized placement training agencies for organizing training programmes. Some have their captive skills to cater to these needs. But which skills are the most critical skills; What should the placement training focus on? In order to understand this, over 102 postgraduate students were surveyed on the various areas of need for the
placement training. The study survey‟s a number of literature in this segment and after the analysis of the data recommends an outline of a course for the placement training for the MBA students.
II.
METHODOLOGY
A sample of about 102 students, from different states of India who are undergoing Management post graduate Programme in one of the Four Major metropolitan cities in India namely, Chennai were surveyed exclusively for this article. A online questionnaire was created using „Qualtrics‟, a online survey tool. The responses were collected from the 102 students during December 2013. The results were subject to Anova, Correlation and Factor Analysis using SPSS. The results attempt to develop the structure for the placement training for Business schools in India. The objective of this study was to identify the training needs of the post graduate MBA students and to transform them into a Pedagogy for Placement Training
III.
PRIOR APPROACH
2
Team Spirit, Interpersonal Skills, Leadership, Co-operative, Initiative and Proactive, Integrity, Tolerance to stress/Emotional Resilience, Core Skills , Technical Skills, Computer Literacy, Hands in Laboratory, Subject Knowledge, Understanding of Concept, Facts, Principles and Theories, Breadth of Knowledge, Application of Knowledge to Practical situation and Updated Knowledge in Subject. She has used statistical tests like„t‟ Test, Anova, Mean, Median, and Standard Deviation. The key finding of the study was that the Gender & Mathematical skills are significant factors that influenced the employability skills.
Mohd Shamsuri Md Saad, et.al., (2013) in their study on Employers‟ perception on engineering, information and communication technology (ICT) students‟ employability skills surveyed 365 organizations. They comprised 34 government agencies, 84 government-linked companies (GLCs), 108 multinational companies (MNCs), 73 small and medium enterprises (SMEs), 54 organizations that listed themselves as other organization and 12 organizations that did not specific their category. They used variables like application of Problem solving ICT tools, Lifelong learning, Entrepreneur skills, Effective written and oral communication, Leadership skills. The study used Mean Standard Deviation (SD). The study found that the top five skills highly regarded by the employers are a combination of three soft skills and two hard skills. They are ability to undertake problem identification, apply problem-solving Use of ICT and ability to execute good and effective presentations as well as leading and working as a team are deemed as important by the employers for the students, or any future employees
Chithra. R (2013) in her study on Employability Skills -A Study on the Perception of the Engineering Students and their Prospective Employers, involved 120 students who participated in the survey identified 25 skill set as skill inventory consisting of variables like Work Experience, Gender, Educational Qualification, Demographic statistics, Medium of Education, Team work, Flexibility, Willingness to learn. She uses Percentage Analysis, Mean, Standard Deviation and ANOVA. The study finds that there is significant difference among the students with work experience and having no work experience, among male and female graduates. Only one attribute which has significant difference is integrity (0.01). Professional skills like Creativity (0.01) the study shows that there is a strong need for awareness among the Indian graduates to know the employability skills required by the global talent market.
Padmini. I (2012) in her article on “Education Vs Employability- the Need to Bridge the Skills Gap among the Engineering and Management Graduates in Andhra Pradesh”, This study uses secondary data which is collected from books and periodicals, journals, literature review and content analysis, Websites of AP State Government and JKC (Jawahar Knowledge Centre) and newspapers. She uses variables like 1.Technical and Academic Skills Specific to the Job like Reading, Written, Oral presentation. Basic mathematics, Process Skills, Personal Qualities, Self Control – Self Confidence - Social
Skills Critical review, Secondary data a favorable demographic structure (with about 50 percent of the population below 25 years of age) adds to this advantage. They conclude “finishing school model” is must for continuing practical learning.
Vijayakumar M & Ramalingam S (2013) in their study Recruiters‟ Perception of Fresh Graduates in Engineering Colleges. The total numbers of companies considered were 15 top companies out of which 5 companies were considered for this study. They used variables like Core skills, Professional skills, Communication skills, and they use statistical tools like T Test, Percentage Analysis. They conclude that Ranking Team work is considered as the most important factor that any employee is expected to possess. Next flexibility is expected in terms of mixing with the team members, shifts al-located to the employees, etc also are certain factors that the employers are expecting from the candidates. Willingness to learn is a very important aspect that drives a person to enrich his knowledge level in order to survive and grow in the organization, emotional - bear with the work pressure of the growing organizations.
Richarde, Boyatzis, Elizabethc Stubbs Scott N. Taylor (2002), in their study, “Learning Cognitive and Emotional Intelligence Competencies through Graduate Management Education” use data collected as part of a 50-year longitudinal study of multiple cohorts of MBA students at the Weather head School of Management (WSOM), Case Western Reserve University (SAQ). They have attempted to map 21 competencies: Efficiency Orientation, Planning, Initiative, Self-Confidence, Empathy, Networking, Group Management, Systems Thinking, and Pattern Recognition. They have used Mann-Whitney U-tests- Matched-pair t-tests, Wilcoxon matched-pairs signed-ranks test. The findings of the study show that 1. Dramatic improvement over the impact of the baseline program in all three clusters, for both the full-time an d the part time students. 2. Differences between the impacts of the program could be the result of different standards, perceptions, or developmental progress; that is, the difference between the behavior others see and what a person senses within may be a function of different processes. 3.strong and consistent improvement on Information Analysis but uneven direct behavioral results with Systems 4. Differential impact on the concentrated aspects of the full-time program 5. Using the Learning Skills Profile, two cohorts showed significant improvement in Helping, Information Gathering, Theory-Building, Use-of-Technology and Goal-Setting skills, as well as Self-Confidence from the total score.
3
(the Factor 2) Score of Engagement Index ANOVA 1) engagement Index is dependent upon level of exposure to 4-Q Model. The study concludes that Realization based involvement is always more effective as per theories of education
Scott G Dacko (2011) in his research work while, developing the top five skills within an MBA programme: implications for Management Educators Written communication, Oral communication. Analytical, Leadership, interpersonal Decision Making, Written communication, Oral communication, Analytical, Leadership and interpersonal Decision Making. They use statistical tools like Mean, Median, Mode and standard deviation. His study concludes that 1) each of the five skills, students‟ perceived ending skill levels were found to be significantly higher than perceptions of their starting skill levels, suggesting that the students perceive they are developing their skills in each of the five areas to a
significant extent
2) desired skill development emphasis needs to be increased by an average of 23.5%, with communication skill, and written communication skill development more specifically
Gillian Maxwell, Bernadette Scott, Dorothy Macfarlane and Elizabeth Williamson (2009) Employers as stakeholders in postgraduate employability skills development empirical study reported here is a continuation of previous work which explored the views with regards to the MSc in HRM, questionnaires and one-to-one interviews were used to collect the data Communication, independent working, problem-solving, personal learning and development, and teamwork, ,strategic skills, leadership and numerical skills 1) collective respondent rankings 2) employer priority 1) it is communication and problem solving which emerge as the most important skills sets for employers 2) employers being concerned with both hard and soft component skills, but mainly with hard, outcome orientated skills
Denise Jackson (2009) An international profile of industry-relevant competencies and skill gaps in modern graduates empirical studies on graduate employability skills programs in HEIs throughout the UK, Australia and USA Competency: Lifelong learning, Disciplinary expertise (DE), Business acumen, Work experience, Numeracy, Professionalism/work ethic, Accountability, Life experience, Oral Communication (OC), Team-working, Organisational skills, Adaptability & change management, They find that 1) Intellectual ability is still highly regarded by graduate employers yet many now acknowledge that degree classification is no longer the principal indicator of graduate intelligence. 2) Critical thinking overlaps significantly with problem solving and decision management 3) Oral and written communication skills ranked as some of the most important in graduates and are suffering wide gaps in required and actual performance levels across many countries 4) The professionalism and work ethic skill set is also complex and incorporates enthusiasm and
Ronald W Q, Annie Green, Mike Danson (2005) in their research work entitled “Introducing Employability
Joint Working group established by the regional studies Association and Regional science association (British and Irish Section) Policies approaches to Employability”, have conducted a survey of literature. They conclude that the Narrow and broad perspectives have a significant impact on the employability rather than spectrum of perspectives
Ayesha Saba , Babak Mahmood, Aroosa Khalid & Sumaira Aslam (2011) in their research report, “Perceived Effects of MBA Degree on Skills Development and Career Advancement: The Case of Pakistan” surveyed 100 professionals ( 75 MBA's and 25 others). Managerial Skills, Time Management, Communication skills, Presentation Skills, Research skills, Team building skill, conflict resolution uses tools like Mean, Standard Deviation, T test, Chi-Square test, MBA degrees develop multi skill personalities. Their key findings indicate that MBA's can have career development through this degree - MBA's have diversified skills and they get better chances of being promoted
Dimitrios M. Mihail and Kristina Antigoni Elefterie (2006) in their article, “Perceived effects of an MBA degree on employability and career advancement The case of Greece” among 94 graduates from a population of 230 individuals analyzed variables like Time management Stress management Interpersonal skills, Self-confidence, Written presentations, Decision making, Working in teams, Oral presentations, Negotiating skills, Financial skills Research skills, Managing others Career management using tools like Percentage Analysis - Mean . While the overall conclusion is that an accredited MBA program in Greece seems to help graduates in pursuing their managerial careers, care should be taken when extrapolating the results to the whole country.
4
IV.
OUR APPROACH
With the background of the reviewed literature, the data which was collected using the questionnaire were analysed. The results are presented in the following sections. In order to present the Data characteristics, are presented below.
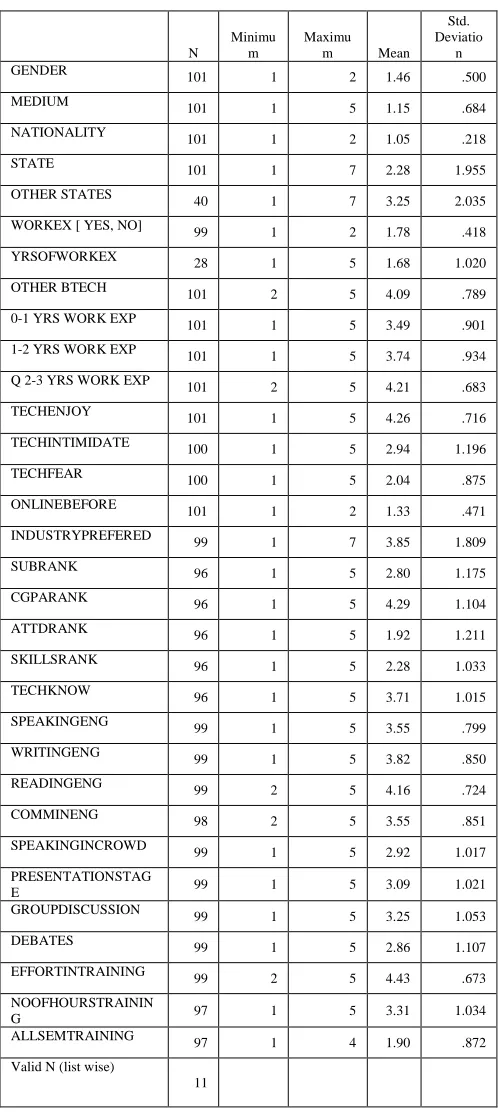
Table I Descriptive statistics of the variables
N
Minimu m
Maximu m Mean
Std. Deviatio
n
GENDER 101 1 2 1.46 .500
MEDIUM 101 1 5 1.15 .684
NATIONALITY 101 1 2 1.05 .218
STATE 101 1 7 2.28 1.955
OTHER STATES
40 1 7 3.25 2.035
WORKEX [ YES, NO] 99 1 2 1.78 .418
YRSOFWORKEX 28 1 5 1.68 1.020
OTHER BTECH 101 2 5 4.09 .789
0-1 YRS WORK EXP
101 1 5 3.49 .901
1-2 YRS WORK EXP 101 1 5 3.74 .934
Q 2-3 YRS WORK EXP 101 2 5 4.21 .683
TECHENJOY 101 1 5 4.26 .716
TECHINTIMIDATE
100 1 5 2.94 1.196
TECHFEAR 100 1 5 2.04 .875
ONLINEBEFORE 101 1 2 1.33 .471
INDUSTRYPREFERED 99 1 7 3.85 1.809
SUBRANK
96 1 5 2.80 1.175
CGPARANK 96 1 5 4.29 1.104
ATTDRANK 96 1 5 1.92 1.211
SKILLSRANK 96 1 5 2.28 1.033
TECHKNOW
96 1 5 3.71 1.015
SPEAKINGENG 99 1 5 3.55 .799
WRITINGENG 99 1 5 3.82 .850
READINGENG 99 2 5 4.16 .724
COMMINENG 98 2 5 3.55 .851
SPEAKINGINCROWD 99 1 5 2.92 1.017
PRESENTATIONSTAG
E 99 1 5 3.09 1.021
GROUPDISCUSSION 99 1 5 3.25 1.053
DEBATES 99 1 5 2.86 1.107
EFFORTINTRAINING 99 2 5 4.43 .673
NOOFHOURSTRAININ
G 97 1 5 3.31 1.034
ALLSEMTRAINING 97 1 4 1.90 .872
Valid N (list wise)
11
In the above table the critical variables had a higher deviation rather than the non-critical variables. Interestingly the sample contains 28 respondents who are students with prior work experience. Through the correlation analysis, 5 pairs of variables which have received highly similar responses have been identified. They indicate that responses relating to stage presentation and group discussion skills are similar. The responses relating to group discussion skills and debating skill are similar. Responses relating to Speaking and writing skills were similar. Most importantly, the responses relating to effort in training and number of hours invested in training are similar. The questions relating to Presentations, debating, discussion skills, speaking and writing skills and the number of hours the placement training is undertaken are highly correlated with each other. It means that they are critical factors of content the placement training framework.
Table III Factor Analysis Total Variance Explained
Comp onent
Initial Eigen values Extra ction Sums of Squar ed Loadi ngs Rota tion Sum s of Squa red Load ings Total % of
Variance Cu mul ativ e %
Total % of Vari ance
Cumu lative %
Total % of Vari ance 1 5.40 0165 20.0006 1 20.0 006 1 5.400 165 20.0 0061 20.00 061 3.70 1041 13.7 0756
2 3.635340165 3.635 34 13.4 6422 33.46 483 2.86 6693 10.6 1738 3 2.96
0846 10.9661 44.4 309 3 2.960 846 10.9 661 44.43 093 2.68 1491 9.93 1447 4 2.59 1972 9.59989 5 54.0 308 3 2.591 972 9.59 9895 54.03 083 2.65 678 9.83 9928
5 2.324352856 2.324 353 8.60 8714 62.63 954 2.56 5655 9.50 2426 6 1.95 6093 7.24 479 69.8843 3 1.956 093 7.24 479 69.88 433 2.35 5865 8.72 5427 7 1.58 1221 5.85 6375 75.7407 1 1.581 221 5.85 6375 75.74 071 2.22 826 8.25 2815 8 1.48 6219 5.50 4514 81.2452 2 1.486 219 5.50 4514 81.24 522 2.14 6846 7.95 1282 9 1.04 9177 3.88 584 85.1310 6 1.049 177 3.88 584 85.13 106 1.78 2755 6.60 2797 10 0.91 242 3.37 9332 88.5103 9 11 0.71 8947 2.66 2767 91.1731 6 12 0.54 9971 2.03 6931 93.2100 9 13 0.49 8245 1.84 5351 95.0554 4 14 0.40 488 1.49
9557 96.555
15 0.23 6107 0.87 4472 97.4294 7 16 0.20 6585 0.76
5128 98.1946
5
200.04 4126
0.16
3428 99.7596
21
0.03 3997
0.12 5915
99.8855 1
22
0.02 1232
0.07 8637
99.9641 5
23
0.00 9679
0.03
5849 100
24
2.93 E-16
1.09
E-15 100
25
1.5E -16
5.56
E-16 100
26
2.8E -17
1.04
E-16 100
27
-5.3E -17
-2E-16 100
Extraction Method: Principal Component Analysis. The factor analysis is usually used to group the variables in a questionnaire. The factor analysis was
applied on un-standardized questionnaire with 29 questions apart from the demographic variables. The Eigen values of 9 items were greater than 1. These questions have been identified as leading factors in the principal component analysis
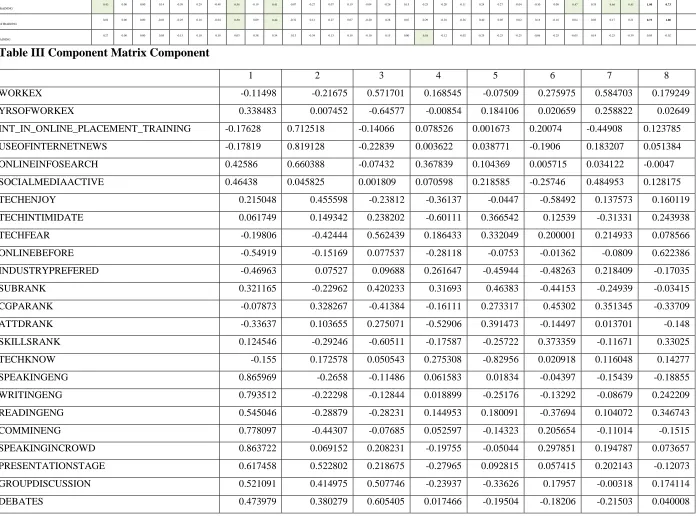
Through the Principal Component Analysis, 9 components were extracted. 7 of the 9 factors could be names with significant variables. They were:
The results of the Factor Analysis indicate that Communication, Technology skills, Training and effort, Business English, Technical Communication, Technological experience, Online training and continuous improvement spread over all semesters are the key factors that have emerged significantly as the dominant factors demanded by students in MBA placement training.
V.
CONCLUSION
While designing a curriculum for placement training for post graduate management students, it is important to have a differentiated curriculum for men and women on the factors like using internet in updating themselves, Technology and vertical in which they would like to focus on and the communication in English.
Further this study indicates that responses relating to stage presentation and group discussion skills are similar. The responses relating to group discussion skills and debating skill are similar. Responses relating to Speaking and writing skills were similar. Most importantly, the responses relating to effort in training and number of hours invested in training are similar. The questions relating to Presentations, debating, discussion skills, speaking and writing skills and the number of hours the placement training is undertaken are highly correlated with each other. It means that they are critical factors of content the placement training framework.
Further the Analysis indicate that Communication, Technology skills, Training and effort, Business English, Technical Communication, Technological experience, Online training and continuous improvement spread over all semesters are the key factors that have emerged significantly as the dominant factors demanded by students in MBA placement training
All the three methods of analysis, Anova, Correlation and Factor analysis indicate that the post graduate management students believe that training on :
Communication,
Technology skills,
Training and effort,
Business English,
Technical Communication,
Technological experience,
Online training and continuous improvement
are the critical factors to enhance the placements for them. Though the MBA placement needs are commonly known, The level of the language requirement was different for the male and female participants. While
the literature equates the mathematical ability to technical skills, the respondents have referred the technical skills in terms of the modern big data analytical skills that are required in different functions.
REFERENCES
[1] Diya Shukla (2012) Employability Skill among Professionals – Charging of HR Executives in Indian Labor Market: A Study on Engineering Graduates of Bhopal City VSRD International journal of Business & MGMT Research Vol.2 (8) , PP 418 – 427 2231-248X [2] Mohd Shamsuri Md Saad, Anidah Robani, Zanariah Jano & Izaidin Ab. Majid (2013) Employers‟ perception on engineering, information and communication technology (ICT) students‟ employability skills, Global Journal of Engineering Education Vol: 15, No 1, Pp : 42 to 47
[3] Chithra. R (2013) Employability Skills -A Study on the Perception of the Engineering Students and their Prospective Employers, Global Journal of management and business studies Vol 3, No 5, PP 525 – 534. 2248-9878
[4] Padmini. I (2012)Education Vs Employability- the Need to Bridge the Skills Gap among the Engineering and Management Graduates in Andhra Pradesh, International Journal of Management & Business Studies Vol 2, Issue 3, July - Sep 2012 , PP 90 to 94 ISSN : 2230-9519 (Online) | ISSN : 2231-2463 (Print)
[5] Vijayakumar M & Ramalingam S (2013) Recruiters‟ Perception of Fresh Graduates in Engineering Colleges, Indian Journal of Applied Research Vol 3, Issue: 3 pp: 259 to 260 ISSN - 2249-555X
[6] Richarde, Boyatzis, Elizabethc Stubbs Scott N. Taylor (2002) “Learning Cognitive and Emotional Intelligence Competencies through Graduate Management Education”, Case Western Reserve University Working paper.
6
[8] Scott G Dacko( ) developing the top five skills within an MBA programme : implications for Management Educators, International Journal of Management Education, Warwick Business School, and The University of Warwick
[9] Gillian Maxwell, Bernadette Scott, Dorothy Macfarlane and Elizabeth Williamson (2009) Employers as stakeholders in postgraduate employability skills development, International Journal of Management Education DOI:10.3794/ijme.82.267
[10] Denise Jackson (2009) an international profile of industry-relevant competencies and skill gaps in modern graduates, International Journal of Management Education DOI:10.3794/ijme.83.288, PP: 29 to 58
[11] Ronald W Q, Annie Green, Mike Danson (2005) Introducing Employability Urban Studies Vol 42, No. 2, pp 191- 195
[12] Ayesha Saba , Babak Mahmood, Aroosa Khalid & Sumaira Aslam (2011) Perceived Effects of MBA Degree on Skills Development and Career Advancement: The Case of Pakistan International Journal of Business and Management Vol. 6, No. 7; pp 207 - 215
[13] Dimitrios M. Mihail and Kristina Antigoni Elefterie (2006) Perceived effects of an MBA degree on employability and career advancement The case of Greece International Journal of Career Development Now Career Development International Vol. 11 No. 4, pp. 352-361
[14] Gallup Organization (2010) “Employers‟ perception of graduate employability” European commission - Report Entire Report PP 1 to 194
7
Table II Proximity Matrix : Correlation between Vectors of Values
GE ND E R M E DI UM NA T ION AL IT Y S T AT E B T E C HB R AN C H W OR KE X YR S OFW OR KE X INT _ IN_ ON L INE _ P L AC E M E N T _ T R AI NI NG USE OFI NT E R NE T N E W S ON L INE INFOS E AR C H S OC IAL M E DI AA C T IVE T E C HE NJ OY T E C HI NT IM IDA T E T E C HFE AR ON L INE B E F OR E IND UST R YPR E F E R E D S UB R AN K C GPAR AN K AT T DR AN K S KI L L S R AN K T E C HK NO W S P E AK ING E NG W R IT ING E NG R E AD ING E NG C OM M INE NG S P E AK ING INC R OW D P R E S E NT AT ION S T AG E GR OU P DI S C USS ION DE B AT E S E F F OR T INT R AI NI NG NO OFHOU R S T R AI NI NG AL L S E M T R AI N ING GENDER
1.00 0.00 0.00 -0.20 -0.15 -0.15 -0.33 -0.29 -0.54 0.34 0.13 -0.43 0.03 0.08 -0.22 -0.41 0.20 -0.10 -0.18 -0.17 0.10 0.43 0.34 0.05 0.39 0.52 0.24 0.46 0.33 0.43 0.02 0.27
MEDIUM
0.00 1.00 0.00 0.00 0.00 0.00 0.00 0.00 0.00 0.00 0.00 0.00 0.00 0.00 0.00 0.00 0.00 0.00 0.00 0.00 0.00 0.00 0.00 0.00 0.00 0.00 0.00 0.00 0.00 0.00 0.00 0.00
NATIONALITY
0.00 0.00 1.00 0.00 0.00 0.00 0.00 0.00 0.00 0.00 0.00 0.00 0.00 0.00 0.00 0.00 0.00 0.00 0.00 0.00 0.00 0.00 0.00 0.00 0.00 0.00 0.00 0.00 0.00 0.00 0.00 0.00
STATE
-0.20 0.00 0.00 1.00 -0.33 0.92 -0.11 0.42 -0.08 -0.37 -0.07 -0.14 -0.02 0.08 0.59 -0.37 -0.30 0.05 0.60 -0.01 -0.20 -0.22 -0.38 -0.34 -0.11 0.04 0.22 0.18 -0.28 0.14 -0.01 0.05
BTECHBRANCH
-0.15 0.00 0.00 -0.33 1.00 -0.24 0.33 -0.29 0.02 -0.28 -0.41 -0.13 -0.34 0.06 0.06 0.32 -0.43 0.31 0.12 -0.05 0.31 -0.43 -0.18 -0.01 -0.35 -0.37 -0.24 -0.37 -0.12 -0.59 -0.25 -0.13
WORKEX
-0.15 0.00 0.00 0.92 -0.24 1.00 -0.22 0.52 -0.06 -0.28 -0.24 -0.29 -0.20 0.06 0.67 -0.28 -0.52 0.18 0.45 0.14 0.07 -0.35 -0.49 -0.36 -0.22 0.03 0.16 0.13 -0.38 0.29 0.16 0.18
YRSOFWORKEX
-0.33 0.00 0.00 -0.11 0.33 -0.22 1.00 -0.11 0.69 0.28 0.34 0.48 -0.15 -0.15 -0.33 0.33 0.23 0.18 0.15 -0.37 -0.35 0.08 0.19 0.43 -0.06 -0.22 -0.11 -0.34 -0.05 -0.48 -0.04 0.18
INT_IN_ONLINE_PLACEMENT_TRAINING
-0.29 0.00 0.00 0.42 -0.29 0.52 -0.11 1.00 0.29 0.12 -0.04 -0.15 0.32 0.51 0.24 -0.24 -0.17 0.35 0.13 -0.06 -0.11 -0.26 -0.48 -0.19 -0.42 0.26 0.54 0.48 0.23 0.56 0.50 0.03
USEOFINTERNETNEWS
-0.54 0.00 0.00 -0.08 0.02 -0.06 0.69 0.29 1.00 0.22 0.23 0.19 0.01 0.03 -0.08 0.44 0.15 0.38 -0.17 0.08 -0.39 -0.19 -0.27 0.02 -0.39 -0.34 -0.11 -0.33 -0.21 -0.19 0.09 0.38
ONLINEINFOSEARCH
0.34 0.00 0.00 -0.37 -0.28 -0.28 0.28 0.12 0.22 1.00 0.55 0.37 -0.08 -0.22 -0.66 -0.02 0.40 0.04 -0.51 -0.24 0.07 0.60 0.52 0.71 0.43 0.57 0.34 0.25 0.42 0.41 0.44 0.34
SOCIALMEDIAACTIVE
0.13 0.00 0.00 -0.07 -0.41 -0.24 0.34 -0.04 0.23 0.55 1.00 0.45 0.44 -0.23 -0.36 -0.48 0.47 0.13 -0.29 0.03 -0.52 0.69 0.55 0.56 0.63 0.64 0.39 0.31 0.34 -0.07 -0.32 0.13
TECHENJOY
-0.43 0.00 0.00 -0.14 -0.13 -0.29 0.48 -0.15 0.19 0.37 0.45 1.00 -0.07 -0.55 -0.43 0.17 0.30 -0.34 -0.02 -0.19 -0.02 0.47 0.66 0.80 0.48 0.08 -0.15 -0.24 0.11 -0.27 0.12 -0.34
TECHINTIMIDATE
0.03 0.00 0.00 -0.02 -0.34 -0.20 -0.15 0.32 0.01 -0.08 0.44 -0.07 1.00 0.60 0.03 -0.58 0.26 0.26 0.14 -0.03 -0.69 0.07 0.03 -0.09 -0.05 0.37 0.46 0.47 0.38 0.07 -0.27 -0.13
TECHFEAR
0.08 0.00 0.00 0.08 0.06 0.06 -0.15 0.51 0.03 -0.22 -0.23 -0.55 0.60 1.00 0.08 -0.19 0.00 0.45 0.39 -0.36 -0.46 -0.52 -0.53 -0.47 -0.69 -0.02 0.51 0.33 0.21 0.19 0.07 0.18
ONLINEBEFORE
-0.22 0.00 0.00 0.59 0.06 0.67 -0.33 0.24 -0.08 -0.66 -0.36 -0.43 0.03 0.08 1.00 -0.30 -0.78 0.27 0.39 0.59 0.10 -0.52 -0.46 -0.54 -0.33 -0.19 -0.29 -0.07 -0.57 -0.04 -0.20 -0.10
INDUSTRYPREFERED
-0.41 0.00 0.00 -0.37 0.32 -0.28 0.33 -0.24 0.44 -0.02 -0.48 0.17 -0.58 -0.19 -0.30 1.00 0.11 -0.19 -0.18 -0.11 0.24 -0.34 -0.21 -0.07 -0.41 -0.80 -0.54 -0.73 -0.35 -0.26 0.28 0.15
SUBRANK
0.20 0.00 0.00 -0.30 -0.43 -0.52 0.23 -0.17 0.15 0.40 0.47 0.30 0.26 0.00 -0.78 0.11 1.00 -0.47 -0.27 -0.49 -0.45 0.61 0.34 0.19 0.34 0.15 0.25 0.26 0.57 0.15 0.07 0.00
CGPARANK
-0.10 0.00 0.00 0.05 0.31 0.18 0.18 0.35 0.38 0.04 0.13 -0.34 0.26 0.45 0.27 -0.19 -0.47 1.00 0.05 0.21 -0.29 -0.52 -0.41 -0.06 -0.47 0.09 0.35 -0.07 -0.26 -0.23 -0.29 0.56
ATTDRANK
-0.18 0.00 0.00 0.60 0.12 0.45 0.15 0.13 -0.17 -0.51 -0.29 -0.02 0.14 0.39 0.39 -0.18 -0.27 0.05 1.00 -0.45 -0.31 -0.42 -0.16 -0.16 -0.35 -0.24 0.01 -0.09 -0.25 -0.20 -0.01 -0.12
SKILLSRANK
-0.17 0.00 0.00 -0.01 -0.05 0.14 -0.37 -0.06 0.08 -0.24 0.03 -0.19 -0.03 -0.36 0.59 -0.11 -0.49 0.21 -0.45 1.00 0.26 -0.11 -0.15 -0.24 0.08 -0.04 -0.39 -0.18 -0.45 -0.11 -0.36 -0.02
TECHKNOW
0.10 0.00 0.00 -0.20 0.31 0.07 -0.35 -0.11 -0.39 0.07 -0.52 -0.02 -0.69 -0.46 0.10 0.24 -0.45 -0.29 -0.31 0.26 1.00 0.02 0.09 0.11 0.15 -0.02 -0.36 -0.09 -0.05 0.24 0.40 -0.29
SPEAKINGENG
0.43 0.00 0.00 -0.22 -0.43 -0.35 0.08 -0.26 -0.19 0.60 0.69 0.47 0.07 -0.52 -0.52 -0.34 0.61 -0.52 -0.42 -0.11 0.02 1.00 0.79 0.59 0.91 0.65 0.15 0.45 0.58 0.27 0.05 -0.23
WRITINGENG
0.34 0.00 0.00 -0.38 -0.18 -0.49 0.19 -0.48 -0.27 0.52 0.55 0.66 0.03 -0.53 -0.46 -0.21 0.34 -0.41 -0.16 -0.15 0.09 0.79 1.00 0.83 0.82 0.45 -0.14 0.05 0.29 -0.04 0.02 -0.25
READINGENG
0.05 0.00 0.00 -0.34 -0.01 -0.36 0.43 -0.19 0.02 0.71 0.56 0.80 -0.09 -0.47 -0.54 -0.07 0.19 -0.06 -0.16 -0.24 0.11 0.59 0.83 1.00 0.60 0.45 0.07 -0.05 0.25 -0.10 0.16 -0.06
COMMINENG
0.39 0.00 0.00 -0.11 -0.35 -0.22 -0.06 -0.42 -0.39 0.43 0.63 0.48 -0.05 -0.69 -0.33 -0.41 0.34 -0.47 -0.35 0.08 0.15 0.91 0.82 0.60 1.00 0.62 0.04 0.29 0.35 0.08 -0.16 -0.25
SPEAKINGINCROWD
0.52 0.00 0.00 0.04 -0.37 0.03 -0.22 0.26 -0.34 0.57 0.64 0.08 0.37 -0.02 -0.19 -0.80 0.15 0.09 -0.24 -0.04 -0.02 0.65 0.45 0.45 0.62 1.00 0.67 0.79 0.63 0.47 0.04 -0.05
PRESENTATIONSTAGE
0.24 0.00 0.00 0.22 -0.24 0.16 -0.11 0.54 -0.11 0.34 0.39 -0.15 0.46 0.51 -0.29 -0.54 0.25 0.35 0.01 -0.39 -0.36 0.15 -0.14 0.07 0.04 0.67 1.00 0.72 0.62 0.35 0.03 0.19
GROUPDISCUSSION
8
DEBATES
0.33 0.00 0.00 -0.28 -0.12 -0.38 -0.05 0.23 -0.21 0.42 0.34 0.11 0.38 0.21 -0.57 -0.35 0.57 -0.26 -0.25 -0.45 -0.05 0.58 0.29 0.25 0.35 0.63 0.62 0.79 1.00 0.41 0.21 -0.39
EFFORTINTRAINING
0.43 0.00 0.00 0.14 -0.59 0.29 -0.48 0.56 -0.19 0.41 -0.07 -0.27 0.07 0.19 -0.04 -0.26 0.15 -0.23 -0.20 -0.11 0.24 0.27 -0.04 -0.10 0.08 0.47 0.35 0.66 0.41 1.00 0.73 0.05
NOOFHOURSTRAINING
0.02 0.00 0.00 -0.01 -0.25 0.16 -0.04 0.50 0.09 0.44 -0.32 0.12 -0.27 0.07 -0.20 0.28 0.07 -0.29 -0.01 -0.36 0.40 0.05 0.02 0.16 -0.16 0.04 0.03 0.17 0.21 0.73 1.00 -0.02
ALLSEMTRAINING
0.27 0.00 0.00 0.05 -0.13 0.18 0.18 0.03 0.38 0.34 0.13 -0.34 -0.13 0.18 -0.10 0.15 0.00 0.56 -0.12 -0.02 -0.29 -0.23 -0.25 -0.06 -0.25 -0.05 0.19 -0.23 -0.39 0.05 -0.02 1.00
Table III Component Matrix Component
1 2 3 4 5 6 7 8
WORKEX -0.11498 -0.21675 0.571701 0.168545 -0.07509 0.275975 0.584703 0.179249
YRSOFWORKEX 0.338483 0.007452 -0.64577 -0.00854 0.184106 0.020659 0.258822 0.02649
INT_IN_ONLINE_PLACEMENT_TRAINING -0.17628 0.712518 -0.14066 0.078526 0.001673 0.20074 -0.44908 0.123785
USEOFINTERNETNEWS -0.17819 0.819128 -0.22839 0.003622 0.038771 -0.1906 0.183207 0.051384
ONLINEINFOSEARCH 0.42586 0.660388 -0.07432 0.367839 0.104369 0.005715 0.034122 -0.0047
SOCIALMEDIAACTIVE 0.46438 0.045825 0.001809 0.070598 0.218585 -0.25746 0.484953 0.128175
TECHENJOY 0.215048 0.455598 -0.23812 -0.36137 -0.0447 -0.58492 0.137573 0.160119
TECHINTIMIDATE 0.061749 0.149342 0.238202 -0.60111 0.366542 0.12539 -0.31331 0.243938
TECHFEAR -0.19806 -0.42444 0.562439 0.186433 0.332049 0.200001 0.214933 0.078566
ONLINEBEFORE -0.54919 -0.15169 0.077537 -0.28118 -0.0753 -0.01362 -0.0809 0.622386
INDUSTRYPREFERED -0.46963 0.07527 0.09688 0.261647 -0.45944 -0.48263 0.218409 -0.17035
SUBRANK 0.321165 -0.22962 0.420233 0.31693 0.46383 -0.44153 -0.24939 -0.03415
CGPARANK -0.07873 0.328267 -0.41384 -0.16111 0.273317 0.45302 0.351345 -0.33709
ATTDRANK -0.33637 0.103655 0.275071 -0.52906 0.391473 -0.14497 0.013701 -0.148
SKILLSRANK 0.124546 -0.29246 -0.60511 -0.17587 -0.25722 0.373359 -0.11671 0.33025
TECHKNOW -0.155 0.172578 0.050543 0.275308 -0.82956 0.020918 0.116048 0.14277
SPEAKINGENG 0.865969 -0.2658 -0.11486 0.061583 0.01834 -0.04397 -0.15439 -0.18855
WRITINGENG 0.793512 -0.22298 -0.12844 0.018899 -0.25176 -0.13292 -0.08679 0.242209
READINGENG 0.545046 -0.28879 -0.28231 0.144953 0.180091 -0.37694 0.104072 0.346743
COMMINENG 0.778097 -0.44307 -0.07685 0.052597 -0.14323 0.205654 -0.11014 -0.1515
SPEAKINGINCROWD 0.863722 0.069152 0.208231 -0.19755 -0.05044 0.297851 0.194787 0.073657
PRESENTATIONSTAGE 0.617458 0.522802 0.218675 -0.27965 0.092815 0.057415 0.202143 -0.12073
GROUPDISCUSSION 0.521091 0.414975 0.507746 -0.23937 -0.33626 0.17957 -0.00318 0.174114
9
EFFORTINTRAINING 0.094968 0.454123 0.192666 0.529123 0.129962 0.424129 -0.02721 0.192101
NOOFHOURSTRAINING 0.031948 0.174651 -0.0685 0.759206 0.19125 0.057057 -0.27706 -0.11148
ALLSEMTRAINING -0.15328 0.12028 -0.17171 0.413118 0.481081 0.005625 0.115959 0.553604