131
Copyright © 2018. IJEMR. All Rights Reserved.
Volume-8, Issue-3, June 2018
International Journal of Engineering and Management Research
Page Number: 131-136
DOI:
doi.org/10.31033/ijemr.8.3.16
An Electrocardiograph based Arrythmia Detection System
Veena.K.N1 and Shobha.S2
1M. Tech in VLSI Design and Embedded Systems, Department of Electronics and Communication Engineering, Sapthagiri
College of Engineering, Bengaluru, INDIA
2Associate Professor, Department of Electronics and Communication Engineering, Sapthagiri College of Engineering,
Bengaluru, INDIA
1
Corresponding Author email: [email protected]
ABSTRACT
Cardiac disorders turn out to be a serious disease if not diagnosed and treated at the earliest. Arrhythmia is a cardiac disorder that exists as a result of irregular heart beat conditions. There are several variants in this type of disorder which can be only diagnosed only when patient is under an intensive care conditions and also the patient with such disorder do not experience and physical symptoms. Such diseases turn out to be deadly if not treated early. A detection system is thus required which is capable of detecting these arrhythmias in real time and aid in the diagnosis. An FPGA based arrhythmia detection system is designed and implemented here which can detect second degree AV block type of arrhythmia. The designed system was simulated and tested with ECG signal from MIT-BH database and the results revealed that a robust arrhythmia detection system was implemented.
Keywords— Cardiac, Arrytmia, Diagnosis, FPGA
I.
INTRODUCTION
Cardiac disorders is one of the major cause of suffering and death today. Early diagnosis of such disorders leads to a timely treatment and recover from such disorders which may turn deadly if ignored. The current diagnosis of heart diseases depend on visual analysis of Electrocardiograph (ECG) signals.
The acquisition of these ECG signals is achieved using ECG device which uses two to three electrodes connected to different human body parts. These electrodes measure the heart’s electrical activity as a function of time. These ECG signals depict an anomaly for a patient suffering from any heart disease. Hence the ECG signals are used for diagnosing the healthy status of the heart.[1]
ECG signals are divided into four important electrical events each representing the phases of a cardiac cycle. The four events are 'P' wave, 'QRS' complex. 'ST' segment and 'T' segment as shown in figure 1 [2].
As each segment in the ECG signal corresponds to a particular physiological state, the analysis of thee segments may be used in diagnosis cardiac disorders. The diagnosis may be detection of presence/absence of heartbeat, calculating the average heart rate, classifying articular or ventricular abnormal beats and so on.
Fig.1. ECG signal
A heart rhythm may be estimated by analyzing the R-R distance in the ECG signal. A normal sinus rhythm will have a consistent R-R interval and within the normal P-R interval range of 0.12-0.20 seconds [3]. Arrhythmia is a condition of a patient whose heart beat rhythm is not being normal or he is suffering from abnormal heart rate. Several arrhythmiatic condition are found to exist such as Sinus Bradycardia, Sinus Tachycardia, Atrial flutter, Atrial Fibrillation, Super Ventricular Tachycardia, First degree AV block, second degree block and third-degree block. The second-degree blocks are a form of arrhythmia where the QRS pulses are found to be dropped in a repeating cycle of every 3rd or 4th P wave of the ECG signal.
132
Copyright © 2018. IJEMR. All Rights Reserved.
proposed to find the presence of such drops in the ECG signal. The heart beats are detected from ECG signal by detecting the QRS complex through suitable filtering and thresholding approaches. The dropped heart beats are then identified as a confirmation of presence of arrhythmia condition.
The organization of paper is followed as: Section II describes the ECG signal processing concepts. Section III describes a general arrhythmia detection procedure. Section IV presents the related works in arrhythmia detection. Section V describes the arrhythmia system implementation VI the obtained results are analyzed and performance analysis is presented with existing work. The conclusion is mentioned in Section VII.
II.
ECG SIGNAL ANALYSIS
An ECG signal analysis for intensive care
monitoring or ambulatory monitoring involves
conditioning the signal against different noise and artifacts that affect the ECG signal, detect the heart beats and extract the ECG signal characteristics such as wave amplitude and duration for derailed analysis. A general block diagram representation of an ECG signal analysis is shown in figure. [4]
Noise filtering
QRS peak detection
ECG measurements ECG
signal
Fig.2. ECG signal Analysis flow
ECG Preprocessing: - ECG signals are generally corrupted due to different types of noise originating from electromagnetic fields or from other physiological body process. Also, the ECG signals get affected due to recording under ambulatory or any other stress conditions. Such kinds of noise and disturbance affect the ECG signal or sometimes even mask the signal of interest. Hence it is important to preprocess the ECG signals for ECG signal analysis. The preprocessing of ECG signal generally involves removal of two predominant noises affecting the ECG signal, one is the baseline wander and the other is the power line interference signal. The removal both types of noise require the use of narrow band filters. A baseline wander signal frequency range is of the order of 0.5 hz and hence can be removed by using a linear, time invariant high pass filter. Other linear filtering approaches may be used which involves the following steps low pass filtering, interpolating, estimation and subtraction steps [4]. Power line Interference noise is caused due to electromagnetic field of a power line which lies in the frequency range of 50-60 hz. Linear filtering and band stop filtering approaches may be used to remove the PLI noise.
QRS Detection: - The detection of occurrence of heartbeats very important in all ECG signals processing application and this can be achieved by identifying the QRS complex peaks in the ECG signal. A QRS detector performance is crucial as a missed detection may affect the overall performance of the ECG processing. A QRS detector should be able to detect the QRS morphologies
even under the influence of several noises such as some unwanted spikes or transients. The basic functions involved in QRS detector is shown in Figure 3.
Fig.3. general QRS detector structure
A QRS detector first enhances the QRS complex suppressing the noise components. These enhancements are achieved using linear filtering and non-linear transformation techniques. A linear filters center frequency should be around 10-25Hz and bandwidth in the range 5 to 10 HZ. A non-linear transformation transforms the QRS complex into single peak to enable decision making. A decision rule is applied using an amplitude threshold procedure to detect the presence of the QRS complex.
ECG Measurements: - After finding the QRS complex the other waves in the ECG signal may be delineated for different types of diagnosis. A wave delineation method separates the boundaries within a PQRST complex so that time instants and wave durations of each wave can be calculated. After delineation, the individual waves such as P wave, T wave etc characteristics such as their amplitudes and morphologies are computed. Such characteristics may act as features in diagnosing some critical cardiac disorders.
III.
ARRYTHMIA DETECTION
Arrhythmias are Cardiac disorders that exhibit abnormal rhythm or irregularity in the human heart rates. The abnormally fast rates are medically termed a tachycardia’s and abnormally slow rate are termed as bradycardias. Arrhythmias may be detected by a manual procedure of continuous monitoring of ECG signal acquired from the subject, which is very tedious and time consuming. Other approaches involve automatic detection of such arrhythmiatic conditions and alerting. Such systems are termed Arrhythmiatic detection systems. One such approach of automatic detection of arrhythmias uses the heart beat estimation from the ECG signals [5] [6] is shown in figure 4.
Noise filtering
Heart rate
Estimation Decision ECG
signal arrythmia
Fig.4. arrhythmia detection system
133
Copyright © 2018. IJEMR. All Rights Reserved.
The other approach is the feature extraction-based approach shown in figure 5 which extracts the essential features from the ECG signal. The characteristics of these features may be used to identify the type of arrhythmias. This approach was discussed in [7].
Noise filtering
Feature
extraction Decision ECG
signal arrythmia
Fig.5. arrhythmia detection system
Suitable transform domain approaches maybe used here for extracting the frequency related information which may be used to detect the arrhythmiatic conditions.
IV.
RELATED WORK
The section presents with some of the related works in literature with respect to arrhythmia detection systems. An algorithm was developed by Rajpurkar et al [8] for identifying the arrhythmias from a massive volume of collected ECGs. A neural network was made sue of in mapping the ECG samples to types of rhythms. A new device was introduced by Lobodzinski and Laks [9] for long term ECG monitoring and detecting arrhythmias. A Genetic algorithm and SVM combination used for arrhythmia disease classification was presented by Nasiri et al [10]. An arrhythmia disorder of type ventricular Fibrillation and Ventricular Tachycardia detected from ECG was presented by Atienza at al [11]. A framework was presented here which uses the Feature Selection (FS) technique and SVM for finding out the ECG parameters which aid in the detection of arrhythmias. the work of Kanhe and Hamde [12] presented a compression approach for ECG signal using discrete Hermite function and 2-D wavelets. A single-lead framework for arrhythmias detection using QRS complexes was presented by Martinez et al [13]. A discussion was made by Meddah et al [14] on the QRS complexity of ECG signal for identifying the arrhythmias. The investigation on the RR interval of ECG signal was done by Tripathi and Ayyub [15] for finding the abnormal ECGs.
V.
PROBLEM STATEMENT
The detection of arrhythmias from ECG signal using an automated system mainly requires the detection of QRS complex. The detection of this QRS complex provides a challenge when the signal is affected by noise and artifacts. Power Line Interference (PLI) and Base Line wander (BLW) are the two major noises that can impact the ECG signal. The filtering of these noises remains a primary step before detecting the QRS complex. The design of these filters is very critical as to not disturb the signal shape and spectral characteristics. The design of suitable filtering technique is required to remove these noises while preserving the ECG signal’s morphology is an important concern. The second problem lies in the use detection algorithm and approach of these QRS signal in a
simple and a robust method so as to provide a cost-effective way of implementation.
VI.
PROPOSED METHOD
An Arrhythmia detection system (ECG_AD) is presented here which can read the ECG signal and detect the presence of arrhythmia in it. The primary input to this arrhythmia detection system is the digitized ECG signal fed as streams of 8- bit data with respect to time. The detection of arrhythmia is indicated through a signal on a single bit line. The block diagram representation of the proposed arrhythmia detection system is depicted in figure 6.
Morphological
filtering Haar DWT Thresholding Comparator ECG
signal
Arrythmia
Fig.6. Proposed system block diagram
The proposed ECG_AD system comprises of the morphological filtering module, the Haar Discrete Wavelet transform module (DWT), the Thresholding module and a comparator module. The digitized ECG signal is initially preprocessed by allowing the signal to pass through morphological filters. The filtered signal is fed into the Haar DWT module for extracting the higher frequency signaling information from the filtered ECG signal. After extracting the significant higher frequency terms, a thresholding operation is performed for identifying the presence of "QRS" peak signals in the significant high frequency signal.
The detailed description of the individual blocks of the proposed ECG_AD system will be described below.
Morphological Filtering: - The ECG signal is corrupted as a result of baseline wander which occur due to varying electrode-skin impedance, patient’s movements and breath.
Such disturbances exist during ambulatory ECG
acquisition or ECG acquisition during a patient’s exercise. An additive 50-60 hz signal called power line Interference (PLI) also corrupts the ECG signal. The PLI signals are caused due to EMI fields caused by a power line. These two noise sources have a combined effect of generating larger amplitude signals that resemble the PQRST wave in an ECG signal which hides important features for diagnosis.
Morphological filters are capable of removing baseline wander signals and hence used here for preprocessing the ECG signal.
134
Copyright © 2018. IJEMR. All Rights Reserved.
If x(t) and y(t) be the subsets of an Euclidean space E, where x(t) is a one-dimensional signal, and y(t) is the predefined structuring element then [1]
dilation (x, y) = max{x(t-u) +y(u)} erosion (x y) = min{x(t-u)-g(u)}
The denoising of the ECG signal is performed based on the following algorithm.
If (dilation > dc level) avg = erode + dilation else
avg= erode-dilation.
The morphed signal is generated by adding the average signal with the original ECG signal.
Haar DWT: - The Haar DWT block is used here to extract the higher and lower frequency content from the ECG signal. A four-level wavelet decomposition was used here for frequency extraction. Here Haar wavelet is used for ECG signal decomposition which is described as
A DWT is a transform that transforms a discrete time signal into a discrete wavelet representation. Here the DWT structure is designed such that using the average and difference from previous levels the approximate and detailed coefficients are calculated for the next level. The Haar DWT decomposition is shown in figure. At each stage the DWT decomposes the ECG signal into Haar wavelet higher and lower coefficients which is extended to four levels as shown in figure 7.
H
L
HH
LL
HHH
LLL
HHHH
LLLL
X
Fig.7. Haar wavelet decompositions
The Haar DWT decompositions is done through lifting process.
Thresholding: - The thresholding module is used to identify the QRS peak signal from the filtered ECG signal. The thresholding module is implemented based on the flow chart as depicted in figure 8.
Start
Define I/O ports ,in_ sig memory , 21-locations each
is 8bit
Rst=1
Count =20
En =1, i<20 In_sig[20] = d_in In_sig[19] = Insig
In_sig[i]> max
Max= max
In_ sig =0 Max = dc_level Threshold = 8'd0 Org=0 ,Count=0
Count=count +1 en =0 In_sig = input
Max= In_sig[i]
Threshold = max Org= In_ sig [0]
Max= dc_ level Yes
No
Yes No
Yes No
Fig.8. Thresholding operation flowchart
VII.
RESULTS AND ANALYSIS
The model of the designed system is verified initially through simulations and then implemented on the FPGA kit. The modeling of the design is performed using Xilinx14.7 ISE, simulations using Modelsim 6.3f. The synthesis of the design is performed and implemented on Artix 7 FPGA Board. The FPGA Device used is 7A100T-3 CSG324.
1. ECG_AD Module
The top module results of the ECG_Arrythmia detection module is shown in figure 9 with 8-bit data input, an 8-bit dc level input, 16- bit data_out signal for indicating the detection of QRS peaks by the system. A 1-bit signal, arrhythmia indicates the presence of arrhythmia or not in the ECG signal.
Fig.9. ECG Arrhythmia Detection Top Module
135
Copyright © 2018. IJEMR. All Rights Reserved.
ECG signal is read from a database named MIT-BIH as shown in figure 10.
Fig.10. Results of ECG Signal read from MIT-BIH Data Base
The simulation results of the ECG_AD top module is shown in figure 11.
Fig.11. ECG Arrhythmia Detection Simulation Results
The waveform shows the detection of arrhythmia signal. The detection is indicated by a transition of low to high on the 1-bit arrhythmia signal.
2. Morphological Filter
The top module design of morphological filter block is shown in figure 12. The module is fed with the streaming 8-bit ECG signal data_in, a constant dc level signal along with the clock and reset signal. the module outputs an 8-bit filtered data_out signal. The output of this module is the result of erosion and dilation filtering operation applied on the ECG signal.
Fig.12. Morphological Filtering Top Module
The simulation results after filtering ECG signal is shown in figure 13.
Fig.13. Morphological Filtering Simulation Results
3. Haar DWT Module
The top-level module results for Haar_DWT module is shown below in figure 14. The ECG signal is passed as input to the top module through the 8-bit data_in signal along with clock and reset.
Fig.14. Haar-DWT Top Module
The DWT module outputs shown in figure 15 are the low and high frequency coefficients are produced through a nine-bit high_out and low_out signal. Figure 10 shows the simulation waveforms of the Haar DWT module separating the higher and lower frequency terms.
Fig.15. Haar-DWT Simulation Results
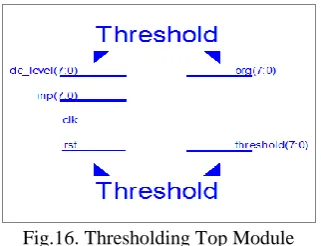
4. Threshold Module
136
Copyright © 2018. IJEMR. All Rights Reserved.
Fig.16. Thresholding Top Module
The simulation results of this thresholding module are shown in figure 17.
Fig.17. Thresholding simulation results
VIII.
COMPARISION RESULTS
A comparison is performed on the previous designs to analyze the utilization of resources in the proposed and the reference designs. The resource utilization in terms of total registers, total pins and total memory bits as shown in table 1.
Table 1 ECG Arrhythmia Detection comparison with [16]
Resource Utilization
Proposed Design
Previous
Design [16] Overhead
Total registers 792 3532 77.57%
Total pins 43 128 NA
Total memory
bits 51177 131072 60.95%
IX.
CONCLUSION
An arrhythmia detection system was designed and implemented on FPGA system. The design of this system provided a simple cost-effective implementation of the detection system. The system performance in detecting the arrhythmias from the ECG signal was found to be appreciable as no false detections were observed. A comparative analysis on the existing arrhythmia detection system on FPGA was made to prove that design presented is an optimized one.
REFERENCES
[1] Sheng Hu, Hongxing Wei, Youdong Chen, & Jindong Tan. (2012). A real-time cardiac arrhythmia classification
system with wearable sensor networks. Sensors, 12, 12844-12869.
[2] Laguna P, Jané R, & Caminal P. (1994). Automatic detection of wave boundaries in multilead ecg signals:
Validation with the CSE database. Computers and
Biomedical Research, 27(1), 45-60.
[3] Melgani, F. & Bazi, Y. (2008). Classification of electrocardiogram signals with support vector machines and particle swarm optimization. IEEE Transactions on Information Technology in Biomedicine, 12(5), 667-677. [4] Aehlert, Barbara J. (2012). ACLS study guide-E-Book. Elsevier: Health Sciences.
[5] K.Chandra Sekhar & Dr. M.Mahesh. (2017). Design of low power tunable OTA-C filter for biomedical applications. International Journal of Engineering and Management Research, 7(6), 98-102. Available at: http://www.ijemr.net/DOC/DesignOfLowPowerTunableO TACFilter.pdf.
[6] Z. Dokur, T. Olmez, E. Yazgan, & O.K.Ersoy. (1997).
Detection of ECG waveforms by neural networks. Medical
Engineering and Physixa, 19(8), 738-741.
[7] B. U. Kohler, C. Hennig, & R. Orglmeister. (2002).
The principles of software QRS detection. IEEE
Engineering in Medicine and Biology Science, 21(1), 42-57.
[8] F. Sufi, Q. Fang, & I. Cosic. (2007), Ecg r-r peak detection on mobile phones. Engineering in Medicine and Biology Society. 29th Annual International Conference of the IEEE, 3697–3700.
[9] S. Ari, K. Sensharma, & G. Saha. (2008). DSP implementation of a heart valve disorder detection system
from a phonocardiogram signal. Journal of Medical
Engineering & Technology, 32(2), 122–132.
[10] P. S. Hamilton & W. J. Tompkins. (1986).
Quantitative investigation of qrs detection rules using the
mit/bih arrhythmia database. Biomedical Engineering,
IEEE Transactions on, BME, 33(12), 1157–1165.
[11] Lobodzinski, S. Suave, & Michael M. Laks. (2012). New devices for very long-term ECG monitoring.
Cardiology Journal, 19(2), 210-214.
[12] Felipe Alonso. (2014). Detection of life threatening arrhythmias using feature selection andsupport vector
machines. IEEE Transactions on Biomedical Engineering,
61(3), 832-840.
[13] Alonso-Atienza, Felipe, et al. (2014). Detection of life-threatening arrhythmias using feature selection and
support vector machines. IEEE Transactions on
Biomedical Engineering, 61(3), 832-840.