Rasheed et al. World Journal of Pharmaceutical and Life Sciences
ANALYTICAL METHOD DEVELOPMENT AND VALIDATION FOR THE
DETERMINATION OF CODEINE IN SYRUP DOSAGE FORM USING UPLC
TECHNOLOGY
Anas Rasheed*1 and Dr. Osman Ahmed2
1
Research Scholar, Faculty of Pharmacy, Pacific Academy of Higher Education and Research University, Udaipur.
2
Research Supervisor, Faculty of Pharmacy, Pacific Academy of Higher Education and Research University, Udaipur.
Article Received on 24/04/2017 Article Revised on 13/05/2017 Article Accepted on 04/06/2017
1. INTRODUCTION
Codeine is an opiate used to treat pain, as a cough medicine. Chemically it is (5α,6α)-7,8-didehydro-4,5-epoxy-3-methoxy-17-methylmorphinan-6-ol. Codeine is use for acute cough suppression in children or adults. [1-5]
Codeine was discovered in 1832 by Pierre Jean Robiquet. In 2013 about 361,000 kilograms of codeine were produced while 249,000 kilograms were used. This makes it the most commonly taken opiate. [6-8] It is on the World Health Organization's List of Essential Medicines, the most effective and safe medicines needed in a health system. The wholesale cost in the developing world is between 0.04 and 0.29 USD per dose as of 2014. In the United States it costs about one dollar a dose. Codeine occurs naturally and makes up about 2% of opium. [9-10]
Analytical methods are commonly used for the quantitative and qualitative analysis of raw materials, drug substances, drug products, and compounds in biological samples in pharmaceutical industry. [11-15] The validation of a specific method must be demonstrated through laboratory experiments by routinely analysing samples.[16-17]
Fig.1: Molecular Structure of Codeine, (5α,6α)-7,8-didehydro-4,5-epoxy-3-methoxy-17- ethylmorphinan-6-ol.
2. EXPERIMENTAL MATERIALS
Codeine (99.60 % purity) used as analytical standard was procured from Active Pharma Labs (Hyderabad).
HPLC grade methanol, Acetonitrile (HPLC grade) was purchased from Qualigens fine chemicals, Mumbai, India. Distilled, 0.45 μm filtered water used for UPLC quantification and preparation of buffer. Buffers and all other chemicals were analytical grade.
World Journal of Pharmaceutical and Life Sciences
WJPLS
www.wjpls.org SJIF Impact Factor: 4.223
*Corresponding Author: Anas Rasheed
Research Scholar, Faculty of Pharmacy, Pacific Academy of Higher Education and Research University, Udaipur.
ABSTRACT
A specific, precise, accurate ultra-pressure liquid chromatography (UPLC) method is developed for estimation of Codeine in bulk drug and syrup dosage form. The method employed, with Hypersil BDS C18 (100 mm x 2.1 mm, 1.7 μm) in a gradient mode, with mobile phase of Acetonitrile, methanol, and 1% triethylamine and Buffer solution in the ratio 70: 15: 15 %v/v/v. The flow rate was 1.5 ml/min and effluent was monitored at 210 nm. Retention time was found to be 3.416±0.020 min. The method was validated in terms of linearity, accuracy, precision, limit of detection (LOD), limit of quantification (LOQ) etc. in accordance with ICH guidelines. Linear regression analysis data for the calibration plot showed that there was good linear relationship between response and concentration in the range of 20- 100 μg/ml respectively. The LOD and LOQ values for were found to be 2.093(μg/ml) and 6.3437(μg/ml) respectively. No chromatographic interference from syrup excipients and degradants were found. The proposed method was successfully used for estimation of Codeine in syrup dosage form.
The syrup - dosage (Codeine Phosphate Syrup) labelled to contain 5 mg per 10mL in 100 mL of container for Codeine. All chemicals used were of pharmaceutical or special analytical grade.
Instrumentation
Acquity, Waters UPLC system consisting of a Water 2695 binary gradient pump, an inbuilt auto sampler, a column oven and Water 2996 wavelength absorbance detector (PDA) was employed throughout the analysis.
The data was collected using Empower 2 software. The column used was Hypersil BDS C18 (100 mm x 2.1 mm, 1.7 μm). A Band line sonerex sonicator was used for enhancing dissolution of the compounds.
Chromatographic Conditions
Table 1: Chromatographic Conditions of the validating method.
Parameter Value
Column Hypersil BDS C18 (100 mm x 2.1 mm, 1.7 μm)
Mobile Phase
Acetonitrile, methanol, and 1% triethylamine and Buffer solution in the ratio 70 : 15 : 15 %v/v/v
Flow rate 1.5mL/min
Run time 8 Min.
Column
Temperature Maintained at 25°C Injection volume 20 μL
Detection
wavelength 210 nm
Diluent Mobile Phase
Preparation of Standard Stock Solution Preparation of Diluent
In order to achieve the separation under the optimized conditions after experimental trials that can be summarized. Stationary phase like Hypersil BDS C18 (100 mm x 2.1 mm, 1.7 μm) column was most suitable one, since it produced symmetrical peaks with high resolution and a very good sensitivity and with good resolution. The flow rate was maintained 1.5 mL min-1 shows good resolution. The PDA detector response of Codeine was studied and the best wavelength was found to be 210 nm showing highest sensitivity.
The mixture of three solutions Acetonitrile, methanol, and 1% triethylamine and Buffer solution in the ratio 70: 15: 15 %v/v/v. The buffer used is 2.35 g of monobasic potassium phosphate were dissolved into 1000 ml of water, and adjusted pH to 2.5 with o-phosphoric acid. with gradient programming was used as mobile phase at 1.5 mL/min was found to be an appropriate mobile phase for separation of Codeine. The column was maintained at 25°C temperature.
Preparation of internal standard solution
Weighed accurately about 10 mg of paracetamol into a clean and dry 100 mL volumetric flask, dissolved with sufficient volume of mobile phase. The volume was then made up to 100 mL with mobile phase to get the concentration of 100 µg/mL of stock solution of working standard. Then it was ultrasonicated for 10 minutes and filtered through 0.20 μ membrane filter.
Preparation of Codeine standard solution
Transfer accurately about 10 mg of Codeine into 100 ml volumetric flask, add 50 ml of mobile phase and sonicate to dissolve it completely dissolved with sufficient volume of mobile phase. The volume was then made up to 100 mL with mobile phase to get the concentration of 100 µg/mL of standard stock solution of working standard. Then it was ultrasonicated for 10 minutes and filtered through 0.20 μ membrane filter. Linearity was determined in the range of 20-100 μg mL-1.
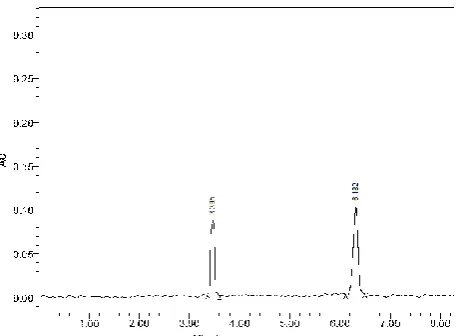
Fig. 2: Optimized chromatogram of Codeine and internal standard using mobile phase of Acetonitrile, methanol, and 1% triethylamine and Buffer solution in the ratio 70: 15: 15 %v/v/v.
3. RESULTS AND DISCUSSIONS
Validation
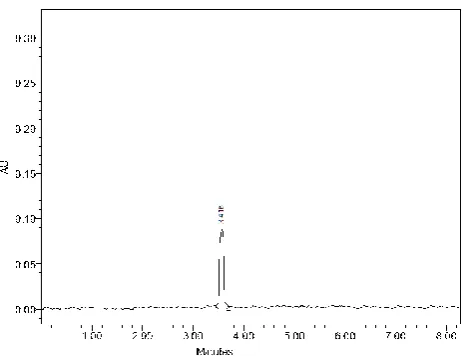
Fig. 3: Standard Chromatogram of Codeine and internal standard using mobile phase of Acetonitrile, methanol, and 1% triethylamine and Buffer solution in the ratio 70 : 15 : 15 %v/v/v.
Linearity and Range
The linearity of an analytical procedure is the ability to obtain test results that are directly proportional to the concentration of an analyte in the sample.
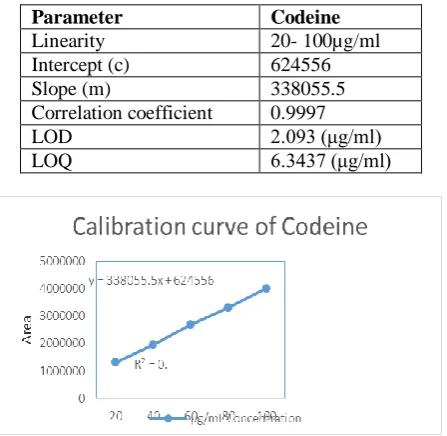
The calibration curve showed good linearity in the range of 20-100 µg/mL, for Codeine (API) with correlation coefficient of 0.9997. A typical calibration curve has the regression equation of y = 338055.5x + 624556 for Codeine. Results are given in Table 2.
Limit of Detection (LOD) and Limit of Quantitation (LOQ)
The LOD and LOQ of Codeine were calculated by mathematical equation. LOD= 3.3×standard deviation ÷ slope and LOQ=10×standard deviation ÷ slope. The LOD of Codeine was found to be 2.093(μg/ml) and the LOQ of Codeine was found to be 6.3437(μg/ml). Results are given in Table 2.
Table 2: Summary of validation parameters for the proposed method.
Parameter Codeine
Linearity 20- 100µg/ml
Intercept (c) 624556
Slope (m) 338055.5
Correlation coefficient 0.9997
LOD 2.093 (μg/ml)
LOQ 6.3437 (μg/ml)
Precision
The Precision of the method was studied in terms of intraday and interday precision of sample injections (20.44 µg/ml). Intraday precision was investigated by injecting six replicate samples of each of the sample on the same day. The % RSD was found to be 0.03%. Interday precision was assessed by analysis of the 6 solutions on three consecutive days. The % RSD obtained was found to be 0.03%. Low % RSD values indicate that the method is precise. The results are given in table 3.
Table 3: Results of Precision Studies.
Replicate Codeine
S.No. Concentration
Taken (μg/ml) Area %LC
1
20.44
1301862 99.99%
2 1302076 99.98%
3 1302242 99.97%
4 1302498 99.95%
5 1302654 99.93%
6 1302839 99.92%
Average 99.95%
Std.Dev 0.0280
% RSD 0.03%
Standard
weight 20.44mcg
Standard
potency 99.60 %
Robustness
Small deliberate changes in chromatographic conditions such as change in temperature (± 2°C), flow rate (± 0.1ml/min) and wavelength of detection (± 2nm) were studied to determine the robustness of the method. The results were in favour of (% RSD < 2%) the developed UPLC method for the analysis of Codeine. The results are given in table 4.
Table 4: Results of Robustness Studies.
Robustness Studies
Parameter Value Peak Area % RSD
Flow Rate
Low 1303979
0.02%
Actual 1304134
Plus 1304382
Temperature
Low 1303268
0.01%
Actual 1303447
Plus 1303462
Wavelength
Low 1303732
0.02%
Actual 1303958
Plus 1304123
Accuracy
determinations were performed. From the data obtained, the method was found to be accurate. The % recovery
and %RSD were calculated and presented in Table 5.
Table 5: Results of accuracy study.
Codeine
Level % Amount added (μg/ml) Amount found (μg/ml) % Recovery Mean recovery (%) Std.Dev % RSD
50 10.29 10.25 99.61
99.66 0.0737 0.07%
100 20.58 20.53 99.75
150 30.87 30.76 99.64
Fig. 4: Chromatogram Showing accuracy results.
Analysis of Formulation
Assay studies for the analysis of spray- dosage formulation of Codeine. Fixed chromatographic conditions were made use for the analysis of formulation and was found to be 100.34%.
Fig. 5: Chromatogram of Assay Studies
4. CONCLUSION
The method provides selective quantification of Codeine without interference from blank affirming precise method. The proposed method is highly sensitive, reproducible, specific and rapid. The method was completely validated showing satisfactory data for all the method validation parameters.
The developed method was robust in the separation and quantification of Codeine in syrup dose. This method can be used for the routine analysis of production samples. The information presented herein could be very useful for quality monitoring of bulk samples and as well employed to check the quality during stability studies. The current method is validated for the assay study of the formulation and was found to be beneficial.
5. REFERENCES
1. British Pharmacopoeia, version, 2007; 11.0.
2. European Pharmacopoeia, sixth edition, 2007; 748-749.
3. Likhar AD, Gupta KR, Wadodkar SG. Spectrophotometric methods for the simultaneous estimation of paracetamol and etoricoxib in tablet dosage forms. International Journal of Pharmacy and Pharmaceutical Sciences, 2010; 2(1): 156-161. 4. Duong TTA, Hoang DV. Simultaneous
Determination of Paracetamol and Codeine Phosphate in Combined Tablets by First-Order Derivative and Ratio Spectra First-Order Derivative UV Spectrophotometry. Asian Journal Research Chemistry, 2009; 2(2): 143-147.
5. Babar SJ, Mane VB, Bhise SB. Development and validation of UV-Spectrophotometric methods for simultaneous estimation of paracetamol and domperidone in bulk and tablet dosage form. International Journal of Pharmacy and Pharmaceutical Sciences, 2012; 4(4): 206-209. 6. Zarapkar SS, Hulkar UP, Bhandari NP. Reverse
phase HPLC determination of ibuprofen, paracetamol and methocarbamol in tablets. Indian Drugs, 1999; 36 (11):710-713.
7. Tsvetkova B, Pencheva I, Peikov P. RP-HPLC Method for Simultaneous Determination of Paracetamol and Aspirin in Tablets. International Journal of Biology, Pharmacy and Allied Sciences, 2012; 1(7): 913-917.
8. Liang YR, Hu J, Wu HL, Le LY, Wang WJ. Determination of paracetamol and amantadine HCl tablets in pharmaceuticals by HPLC, TLC and CRM. Yaowu Fenxi Zazhi (Chinese), 2006; 26 (3):411-414.
Chromatography, modern TLC, 1999; 12(5): 361-364.
10. Deconinck E, Sacre PY, Baudewyns S, Courselle P, Beer Jde. A fast ultra high pressure liquid chromatographic method for qualification and quantification of pharmaceutical combination preparations containing paracetamol, acetyl salicylic acid and/or antihistaminics. Journal of Pharmaceutical and Biomedical Analysis, 2011; 56: 200–209.
11. Nguyen D.T., Guillarme D, Rudaz S, Veuthey J. L., Fast Analysis in Liquid Chromatography Using Small Particle Size and High Pressure. J Sep Sci, 2006; 29(12): 1836-48.
12. Katharina Sterz, Gerhard Scherer, Josef Ecker. A Simple and Robust UPLC-SRM/MS Method To Quantify Urinary Eicosanoids.J Lipid Res, 2013; 1-28.
13. Ashok kumar, UPLC: A preeminent technique in pharmaceutical analysis. Acta poloniae pharmaceutica– drug research, 2012; 69(30): 371-380.
14. Michael E Swartz, Ultra performance liquid chromatography UPLC: an introduction. Separation science redefined, 2005; 1: 8-14.
15. Rasheed A et al., Analytical Method Development and Validation for the Simultaneous Estimation of Aspirin, Clopidogrel Bisulphate and Atorvastatin Calcium in Tablet Dosage Form. American Journal of PharmTech Research, 2014.
16. Anas Rasheed, Dr. Osman Ahmed. UPLC method optimization and validation for the estimation of sodium cromoglycate in pressurized metered dosage form. Int J App Pharm Sci Res, 2017; 2(2): 18-24. http://dx.doi.org/10.21477/ijapsr.v2i2.7774.