PROCEEDINGS
THIRTY-EIGHTH ANNUAL
NORTHWEST
FERTILIZER CONFERENCE
at
PASCO, WASHINGTON
JULY 14-15, 1987
Sponsored by
The Soil Improvement Committee
of the
Northwest Plant Food Association
in cooperation with
The State Universities
7 g
LIME EFFECTS ON P AVAILABILITY 1
D. T. Westermann 2
INTRODUCTION
Nutrient uptake can be predicted by assuming that plant roots absorb nutrients from the soil
solution and that the
rate of absorption is dependent upon the nutrient concentration in the soil solution (2). The root growth rate also affects P uptake since uptake is directly proportional to active root surface area, particularly new root hairs. The three main soil characteristics that describe the P supply to the plant root are: (a) P concentration in the soil solution before growth, (b) the ability of the soil to replenish the P in the soil solution, the buffer power, and (c)the P
diffusion rate through the soil. The diffusion process is the main supply mechanism for P reaching the root surface.There are several factors that directly or indirectly influence soil and fertilizer P availability. These include soil, fertilizer, management, and environmental characteristics. Additional details of the complex reactions and interactions are beyond the scope of this paper, but can be found in recent reviews (4, 7).
A nutrient survey showed that 25 out of 123 potato fields in Idaho had soil test P concentrations (STPC) more than adequate, but petiole PO4-P concentrations considered to be deficient (11). The significance of the petiole PO 4 -P concentration in relation to plant growth needs have been better defined (12) since that report. This paper presents data showing the effects of lime on soil solution P concentrations and P uptake by plants.
METHODS AND MATERIALS
The data in this paper were obtained from a number of different experiments. In 1983, 13 experimental sites (PG83) were established in potato fields across southern Idaho. A preplant soil sample (1 ft) was obtained from each site before any fertilizer was applied. Petiole PO 4 -P concentrations, P uptake, and dry matter and tuber yields were monitored in each experiment during the growing season. The three P fertilization treatments established at each site were dependent upon preplant STPC. The cultural practices at each site were controlled by the individual potato grower.
Two field experiments were conducted at Kimberly on a site that contained plots where the soil was mixed to 5 ft in 1974 (3). Russet Burbank potatoes and Stephens' winter wheat were grown in 1983 and 1984, respectively. This experiment had a comparison of high and low lime
concentrations across
three different residual-P concentrations. Representative soil samples (1 ft) were obtained from each plot in April of the respective cropping year. Each experiment was monitored for P uptake, plant tissue P concentrations, and dry matter yields. -Standard cultural practices were followed in each experiment.1 Proceedings, 38th Annual N.W. Fertilizer Conference, Pasco, Washington, July 14-16, 1987.
so
Data were also obtained from a P incubation study containing eleven soils. These included Shano fine sandy loam, Greenleaf silt loam, Declo silt
loam, Hillville silt loam, and a native Portneuf silt loam surface soil. Four
Portneuf surface soil (1 ft) and 2 subsoil samples from irrigated fields near Kimberly were also included. Their lime concentrations (9) ranged from less than 0.5% to over 47%, and the initial STPC from 3 to 31 mg P kg -1 . Finely ground MCP, < 200 mesh, was added at P rates of 0, 10, 20, 40, 80, 160, and 320 mg P kg -1 , and incubated (70°F) at 25% moisture by weight for 2 months with 3 wetting-drying cycles before sampling and analysis.
Potato petiole samples (30-50, fourth leaf down from growing tip) were obtained at early tuber set. Total P uptake was estimated from whole plants in a 5 ft row section at early tuber set, and at selected intervals during tuber growth. The tubers and roots were washed. Total P uptake in the wheat experiment was estimated from stand counts and 10-20 aboveground plants from each plot. All plant samples were dried at 140°F and ground through a 40 mesh
screen in
preparation for chemical analyses (1, 5, 6).All soil samples were air-dried ( -95°F) and crushed with a soil-pulverizer (flail type) before analysis. The samples were analyzed for NaHCO3 extractable P (10), acid equivalent lime (9), and solution-P. The 0.01 H CaC12 procedure used to estimate solution-P was as follows: 3 g air-dried
soil
added to 30 ml 0.01 H CaC1 2 , and 200 d toluene, continuous shaking for 24 hr at 70°F, centrifuging, filtering, and P determination on filtrate (8). Phosphorous concentrations were also determined on solutions obtained by centrifuging soil samples after 6 days incubation at field capacity moisture condition. The solution-P (0.01 H CaC12) was related to the P concentration in the soil solution obtained by centrifugation: solution-P (0.01 H CaC1 2 ) 0.931 (soil solution-P) - 0.014, r 2 = 0.99.RESULTS AND DISCUSSION
Initial data analysis for the PG83 sites showed a poor relationship between the STPC and the P uptake or petiole 1,04-P concentration at early tuber set (Table 1). Correlation coefficients improved when the lime
equivalent was added to the regression equation, usually after a logarithmic
or square root transformation. The regression coefficient for lime was always negative. Correlations with only solution-P were slightly lower for initial P uptake, but impkoved for petiole PO 4 -P concentration. Final P uptake in mid-September was poorly correlated with solution-P, better with STPC, and by also considering soil lime. Final P uptakes were confounded from P additions during tuber growth on some sites.
Table 1. Correlation coefficients between selected variables in the 1983 potato growers data set.
Independent Variables Dependent
variable STPC STPC, Lime Solution-P
STEPHENS WHEAT
410-84
140
•
120
• F-
0-/
/ 4
STPC Soin.-P
• q Lime (15-17%)
• a Lime (3-5%)
i
tSOLUTION -P, ppm
ILI
80
7-100
60
81
.
Winter wheat yields were curvilinearly related to both initial STPC and
solution-P (Fig. I).
Significant yield differences occurred between
treatments with similar STPC's (7-9 and 22.5-24), while similar yields
occurred in treatments with STPC's of 9 or 22.5 ppm. These differences appear
to be related to the lime equivalent concentrations. The apparent yield-STPC
incongruities disappeared when solution-P concentrations were related to
yields instead of STPC (Fig. 1).
0.05
0.10
0.15
0.20
1 1 1
5
10
15
21
0
25
STPC, ppm
Fig. I. The relationship of STPC and solution-P to winter wheat yields.
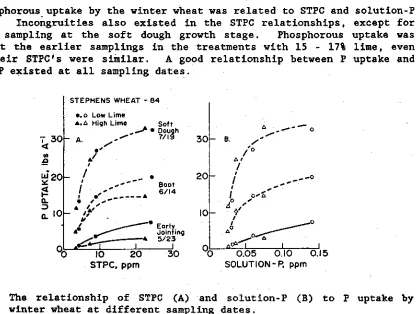
Phosphorous uptake by the winter wheat was related to STPC and
(Fig. 2). Incongruities also existed in the STPC relationships,
the last sampling at the soft dough growth stage. Phosphorous
smaller at the earlier samplings in the treatments with 15 - 17%
though their STPC's were similar. A good relationship between P
solution-P existed at all sampling dates.
solution-P
except for
uptake was
lime, even
uptake and
STEPHENS WHEAT -84
• ,o Low Lime
n,q High Lime Soft
►Dough — A 7/19
_
•
6/14
► op' --- n
• e
.--n t X
–
►
P
II •
• er...„---. Early Jointing
5/23
v
10
20
30
STPC, ppm
q • o
30
B.
a.
I
20
1F.
oa0
10
c4.
0.05
0.10
0.i5
SOLUTION-P. ppm
7
30
1.1
a
20
a
10Boot
/
410 -84 STEPHENS WHEAT
n Lime (15-17%) • Lime (3-5%)
9 • 0.011+ 0.0053X
Y 0.015+0.0027X 82
The final F uptake by potatoes grown on these plots in 1983 was related
to both solution-P and STPC (Fig. 3). Approximately 0.1 ppm solution-P and
15 ppm STPC were necessary for maximum P uptake. Tuber yield relationship was
similar and approached 550 cwt A
-1 ,with 80%, #1 tubers. The two highest STPC
on the low lime equivalent plots (3-5%) had solution-P concentrations greater
than 0.1 ppm, while a 31 ppm STPC and 15
than 0.1 ppm solution-P.
- 17% lime equivalent plot had less
40—
POTATOES, 1983
de. 0 •
q n
30 —
•
cE
1- 20
osi STPC P Lime 0_ •
Aa •
0
q 3-5%15-17%
<
10z
LL SOLUTION -P, ppm
0.1 0.2 0.3 1 I I
10 20 30 40 STPC, ppm
Fig. 3.
The relationship of STPC and solution-P to P uptake by potatoes in
mid-September.
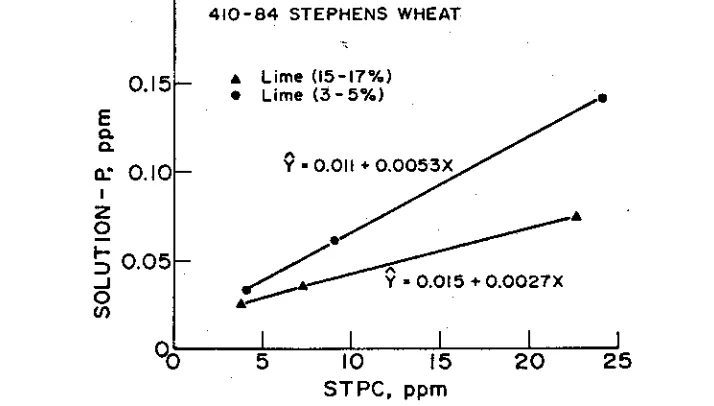
The solution-P concentration in the 1984 winter wheat experiment was
dependent upon the STPC and the lime equivalent (Fig. 4). On this series of
plots there were two separate populations, the 3-5% and 15-17% lime equivalent
plots, respectively. The slope for the 3-5% lime equivalent plots was
approximately two times that for the 15-17% plots. Similar relationships were
found in the 1983 potato plots (data not shown).
0.15
E a.
0.
a: 0.10 0
▪ 0.05 0
I I I l 1
0
5 10 15 20 25STPC, ppm
Fig. 4.
The relationship between STPC and solution-P for two different lime
equivalents in the 1984 winter wheat study.
q
1 I 110 20 30 40 50
85
The relationships between STPC and solution-P for 7 of the 11 soils in the P incubation study are shown in Fig. 5. Some relationships appear to be nearly linear while others are curvilinear. The relationships for the other four soils were similar to those shown. These relationships appear to be
dependent upon soil type (series), lime equivalent, and the physical and chemical characteristics of the lime.
STPC, ppm
Fig. 5. The relationships between STPC and solution-P for six different soils from the P-incubation study. Lime equivalent in parenthesis.
The STPC needed to provide 0.1 ppm solution-P for all 11 incubation soils was estimated from the STPC, solution-P relationship. This STPC was then plotted against the lime equivalent of that soil (Fig. 6). The linear relationship indicates that the STPC should increase 1.4 ppm for each percentage point the lime equivalent increases to have sufficient P available to provide a solution-P concentration of 0.1 ppm. Data from the PG83 sites showed a similar relationship, except for one site where the subsoil was recently exposed with a 19.5% lime equivalent that required an STPC of 50 ppm (Fig. 6). Another anomaly in this study was with the Millville soil. The
1.4 slope was also obtained from greenhouse and growth chamber studies where P
and lime were variables (Unpublished data, D. T. Westermann).
CONCLUSIONS
These data indicate that the soil solution-P concentration is sometimes dependent upon the lime content and its characteristics, as well as the STPC. Higher STPC's were needed to provide the same P concentration in the soil solution as the lime equivalent increased. Attempts to further characterize the in situ lime have not fully identified the mechanisms involved. Recently exposed calcareous subsoils appear to be more reactive than irrigated soils farmed for a number of years. Soils containing other forms of carbonate minerals (e.g., dolomite [in Millville soil]), carbonate minerals
coated with non-reactive materials, or limed acidic soils may not necessarily follow the relationships shown in this paper. Adjustments of P soil tests for
this lime effect may alsO not be necessary for all crops. This consideration
Q.
Z 401
–D
o
0 30
co
a.
X20
C al
°- 1q
co
a.
• MilIville
• (a)-4-(47.9)
• 6.9 +1.4X r 2 -0.82
9_ = 5.8 + I.9X - 0.03X 2
R2 = 0.83
°O 5
10
115
20
X
•
xx
PG83 Sites—wx •
x
•
X X•
•
•
84
ACID EQUIVALENT LIME, %
Fig. 6. The relationship of lime equivalent and STPC needed to have a solution-P concentration of 0.1 ppm.
necessary for plant growth during all the growing season, e.g., potatoes. Crops that complete their life cycle before the end of the climatic growing season, e.g., small grains, may only show a delay in maturity rather than a yield loss.
REFERENCES
1. Baker, A. S. 1971. A simplified method for determining acetic acid soluble phosphorus in plant tissue. Comm. Soil Sci. Plant Anal. 2:195-200.
2. Barber, S. A., and T. L. Kovar. 1985. Review-Principles of applying phosphorus fertilizer for greatest efficiency. J. Pert. Issues 2:91-94.
3. Cary, J. W., and W. W. Rasmussen. 1979. Irrigated response of three crops to deep tillage of a semi-arid silt loam. Soil Sci, Soc. Am. J. 43:574-577.
4. Khasawnek, F. E., E. C. Sample, and E. J. Kamprath (eds). 1980. The Role of Phosphorus in Agriculture. ASA, Inc., Madison, WI.
5. Kitson, R. E., and M. G. Mellon. 1944. Colormetric determination of phosphorus as molydivanado phosphoric acid. Ind. Eng. Chem. Anal. Ed.
16:379.
6. Leggett, G. E., and D. T. Westermann. 1973. Determination of mineral elements in plant tissues using trichloroacetic acid extraction. J. Agric. Food Chem. 21:65-69.