I.
Introduction
T
HE prevention of epidemics is a great issue of public health and problematical phenomena. Geographical location of housing zones subject to contamination contributes in circumscribing and controlling the spread of epidemic through a prevention strategy and thoughtful management. In this context, the role of the decisional information system is essential in the access to information and decision-making support by health institutions and local authorities in charge of this prevention.To identify a good strategy for preventing epidemics and to guarantee a careful management of the spread of epidemics, it is important to design a quality epidemiological surveillance system. Traditionally, decision-making information systems rely heavily on data warehouses offering tools for multidimensional exploration of data and indicators through online analysis or online analytical processing (OLAP).
With regard to phenomena such as the epidemic, the spatial (and temporal) dimensions are eminently important in the analysis and qualification of the propagation of the phenomenon in the neighborhood, as well as its emergence or re-emergence.
The last years have witnessed the development of research works on Spatial OLAP or SOLAP [1][2] integrating spatial data in OLAP and linking exploration and visualization mapping. The natural approach is therefore to apply and experiment these approaches and the resulting system EPISOLAP [3] was proposed and dedicated to epidemiological analysis.
SOLAP method has proven its efficiency in a few years only from its creation. At the beginning of our study, we have chosen to use this
new approach in the monitoring of epidemics. We assume that public health is a perfect field to show the advantages of SOLAP technology and its benefits in processing complex data (spatial data) with a decisional manner and not transactional as the one used in traditional geographic information systems(GISs). SOLAP did not cancel completely the usefulness of GISs but their use becomes limited to the interrogation of geo-spatial data, recording the results of analysis and executing simple queries not exceeding the standards of a relational database such as Insert or Select operations. The big inconvenient of transactional process is that more the query is complicated; the answer to this query is slower because of the tabular structure of a relational database. Contrariwise, in geospatial data warehouse, data is represented as cubes or hyper-cubes. Multidimensional structure facilitates access to information, speeds up the processing of complex queries and the response is given in few seconds only (time of reflection of a human being). Moreover, the reporting service of SOLAP process offers a quality representation by structuring the results of analysis in understandable forms facilitating the process of decision making.
Thereafter, limits have been detected. The objective of the current work is to combine the principles of SOLAP and spatial data mining methods in the same spirit of OLAM (On-Line Analytical Mining) or Multidimensional Mining, proposed in [4], [5]. It is a matter of enriching SOLAP functions not only to be restricted on exploration and visualization of spatial data but also to enrich the aggregation function which is not necessarily a simple average or a sum but which may be based on spatial regression, classification, association or characterization. The integration between SOLAP and SDM leads to the development of a new EPISOLAP-MINING decision-making system based on SOLAM engine (SOLAP Mining) that we are trying to design through this study. The main two objectives of this article are: (1) analyze epidemiological risk factors and rank them in order of relevance, allowing authorities to intervene and eliminate the most influential in priority and (2) apply aggregation function in SOLAP
SOLAM: A Novel Approach of Spatial Aggregation
in SOLAP Systems
Farah Amina Zemri*, Djamila Hamdadou
Computer Science Laboratory of Oran (LIO), University of Oran 1, Oran (Algeria)
Received 10 January 2019 | Accepted 2 August 2019 | Published 30 October 2019
Keywords
Spatial Data Mining, Spatial OLAP, Spatial Generalization, Attribute Oriented Induction, Characterization.Abstract
In the context of a data driven approach aimed to detect the real and responsible factors of the transmission of diseases and explaining its emergence or re-emergence, we suggest SOLAM (Spatial on Line Analytical Mining) system, an extension of Spatial On Line Analytical Processing (SOLAP) with Spatial Data Mining (SDM) techniques. Our approach consists of integrating EPISOLAP system, tailored for epidemiological surveillance, with spatial generalization method allowing the predictive evaluation of health risk in the presence of hazards and awareness of the vulnerability of the exposed population. The proposed architecture is a single integrated decision-making platform of knowledge discovery from spatial databases. Spatial generalization methods allow exploring the data at different semantic and spatial scales while reducing the unnecessary dimensions. The principle of the method is selecting and deleting attributes of low importance in data characterization, thus produces zones of homogeneous characteristics that will be merged.
* Corresponding author.
E-mail address: [email protected]
systems using spatial generalization according to spatial characteristics of administrative zones instead of spatial generalization depending only on the administrative division hierarchy.
To achieve these two objectives, we introduce two key contributions which are respectively: (1) calculate information gain of each attribute in the Attribute Oriented Induction (AOI) algorithm, classify the attributes according to the values of the gains and drop first the attribute corresponding to the lowest gain, then proceed to generalize identical neighboring tuples, (2) Use comparison method which is a type of characterization method often used to distinguish one target class from one or more contrasting classes. Therefore, zones can be aggregated according to their identical characteristics.
In section II we present the related work found in the literature in relation to spatial generalization. Section III presents our proposed approach and SOLAM engine. The description of spatial generalization process is given in section IV. In section V, the generalization process is applied on epidemiological surveillance with some illustrations. At the end, we conclude our discussion in section VI by giving some perspectives.
II.
Related Work
Since the introduction of the SOLAP system by Professor Yvan Bedard, several studies have emerged in order to improve and develop new proposals to make the SOLAP applications more complete. For example, in the study of [6], several SOLAP applications were presented (in different fields: environmental health, transportation, etc.), and gaps were raised and then remedied.
On the other hand, and in the last decade, several efforts have been made to enrich OLAP systems to support complex space objects. We quote here the work of [7] who proposed C 3 model presented as a new
modeling strategy to support complex spatial objects in OLAP cubes. This model is the extension of the “BigCube” model proposed in [8]. The C 3 model includes three constructors: “categorization construct”,
“containment construct” and “combination or cubing construct” allowing all three to structure complex and multi-structured regions and build the multidimensional data cube. The authors also proposed another geographical constructor called “geo-construct” to manipulate and query the spatial hierarchies of geographical objects. These objects are subdivided into two types: Structured Object (SO) and Base Object (BO). On the basis of these two types of geographical objects they proposed the hierarchy of regions called “regH: region hierarchy” organized like this:
<region : SO> :=<regionLabel : BO><face : SO>
In [9] researchers proposed “MuSD” (multigranular spatial data warehouse) which is based on spatial fact, spatial dimension and multilevel spatial measure. “MuSD” manages and supports spatial measures in multiple levels of geometric granularity. In addition to the representation constructs, the model includes a set of SOLAP operators to navigate not only across dimensional levels, but also through the different levels of spatial measure. Recently, the work of [10] focused on the management of qualitative measures in addition to quantitative measures in OLAP systems as well as the proposal of new drilling operators to navigate in the different levels of the multidimensional cube. The objective of the research was the adaptation of drilling operations by introducing the notion of fuzzy to calculate probabilistic measures by aggregating the qualitative dimensions.
Another category of studies have tackled the problematic of non-strict spatial hierarchies in spatial data warehouses and proposed new logical models in [11], by introducing logic schemes with “Bridge Table”. More recently in [12] the authors have proposed another solution for implementation of this special type of hierarchy that exists in some
spatial applications by introducing the bitmap index (Index-NN). As part of the enhancement of spatial data processing capability, researchers in [13] introduced the notion of auxiliary spatial dimensions and adapted SOLAP operations to handle this kind of spatial dimensions. Their role is to facilitate the processing and execution of complex spatial queries and to ensure a better response time. Another study in [14] focused on managing complex levels of details of hierarchy in OLAP systems. They were the first to propose a “multi-model” that uses semantics in data aggregation to avoid the introduction of incorrect queries and nonsense responses. The authors also introduced in this same work, a high level language for multidimensional databases called “SumQL” which was later extended to the “SumQL ++” language to support distributed object databases. In the same vein, recent work in [15] has been the subject of a new approach that defines the constraints of integrity in SOLAP systems in order to improve the accuracy, coherence and completeness of spatial databases. Then, a classification of SOLAP user constraints was applied in constellation schema composed of three fact tables sharing spatial, temporal and thematic dimensions. The approach was applied in the field of agro forestry in the region of Mostaganem in Algeria.
Some open research questions that are currently being investigated are listed as new SOLAP trends, in [16]. These trends include: Continuous SOLAP, Real-Time SOLAP, SOLAP for Emergencies and SOLAP Web Applications.
In the field of web mapping, in [17] researchers have set up the platform “UMapIT” (Unrestricted Mapping Interactive Tool) for an efficient management of spatially referenced data on the web. This web platform was introduced as a new paradigm that integrates the multidimensional approach (datacube) and the occurrence-driven approach to support the demands of users on the web. This approach combines geometry, semantics, and graphical representation as dimension tables in a star schema and is connected to the spatial fact table defined as “Vuel” (Element View). This approach allows a better management of the levels of details in spatial hierarchies on the web. In [18] GeWOLAP, another SOLAP Web-based prototype is presented with some new SOLAP operators adapted to web applications.
Our approach, in the current study, is inspired from the concept of OLAM that was first proposed in [19] where it has been suggested as an OLAP tool coupled with data mining. DBMiner prototype has been developed and generalized for multiple data mining functions like Characterization (Characterizer of DBMiner), Comparison, Classification (Classifier of DBMiner), Association (Associator of DBMiner), Prediction (Predictor of DBMiner) and Clustering. Several manners to perform this integration were proposed: cubing then mining, mining then cubing, cubing while mining, backtracking and comparative mining.
The generalization process is based on attribute oriented induction method (AOI) proposed in [20] and a basic attribute oriented induction algorithm that has been proposed in [21]. More recently, in [22], author has summarized spatial generalization method used in generating characteristic rules and using Attribute Oriented Induction method in eight sequential steps which are ordered as follows: data focusing; attribute removal; attribute generalization; count propagation; attribute generalization control; relation generalization control; rule transformation and finally, handling overlapping tuples. This last step is specified to generate classification/discriminant rules.
by attribute oriented induction in two ways: (1) spatial dominant generalization (SDG) and (2) non-spatial dominant generalization (NSDG). The former is spatial hierarchy directed induction which performs generalization on spatial data first; whereas the later is non-spatial attribute oriented induction which performs the generalization on non-spatial data first [25].
Other kinds of spatial generalization were also indicated as novel alternatives of generalization like interleaved generalization between spatial and non- spatial data and generalization on multiple thematic maps. Several algorithms were proposed to perform spatial data generalization like GenDis algorithm in [26].
According to [24], the client tools currently used to run conventional data warehouses are not suitable for geospatial data warehouses because they do not exploit the geometric structure of the data. In this optic, SOLAP technologies were developed and implemented [27].
III.
Proposed Approach
The approach that we propose here includes an extension of the SOLAP systems with predictive spatial data mining (SDM) techniques to highlight the risk factors in the field of epidemiological surveillance. The purpose is describing and explaining the factors of epidemic phenomenon observed and recorded within “EPISOLAP” data warehouse, in order to better understand them and even avoid them. More precisely, SDM will help in the discovery of the correlations between spatial phenomena and will give a precise description of the epidemiological scenarios which should improve understanding risk factors of epidemic and orient the actions of prevention. In the context of this application, coupling SOLAP and SDM will fulfill the following functions:
• SOLAP tool represents the spatial aspect of the epidemiological study thanks to its ability of detection and location of epidemic outbreaks.
• SDM highlights certain environmental aspects and socio-economic transformations that influence the spatial dynamic of epidemic phenomena and which contribute to various scenarios of the transmission.
However, in the literature, the two approaches have been proposed separately, and were not enough integrated. On the one hand, it is regrettable that SDM is not performed in an online way and only deals with data represented in tabular form (individual-variable table) and on the other hand, conventional SOLAP operators allow only aggregating, visualizing and exploring spatial data without any interpretation efforts. This makes the coupling between these two tools more than necessary to achieve this complementarily. Such coupling is not straightforward and there are several challenges to overcome which we could clarify by responding to the following questions:
• How can SOLAP and data warehouse integrate SDM algorithms? • How to store in a data warehouse the knowledge extracted by an
SDM method?
• How to execute on-line, sometimes large cubes, excavation algorithms of a certain complexity and time consuming?
• How to model in a multidimensional way complex data (geographic data)?
• How to make online analysis on the spatial data?
It is obvious that the implementation of such coupling will not be without difficulties and will have to be carried out under the respect of certain constraints. Indeed, unlike queries on data cubes, the OLAP-based search should take the context into account. At a given time, the user of a cube displays facts with different levels of granularity. This instant photography of the data can be used to perform data mining.
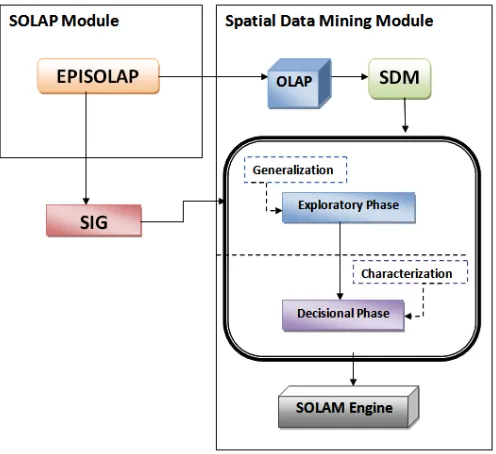
Our approach is inspired from the vision of Jiawei Han who integrated OLAP with data mining in one coherent system which he called OLAM (On Line Analytical Mining) in [4]. In another work [28], we have designed EPISOLAP-MINING by combining a multi criteria spatial decision support system SDSS_MCA_DM (Spatial Decision Support System based on Multi Criteria Analysis and Data Mining) [29] and SOLAM sub-system. The purpose of the present article is precisely presenting this later module. An overview of SOLAM module is illustrated on Fig. 1.
Fig. 1. SOLAM sub-system of EPISOLAP MINING.
The proposed SOLAM sub system follows two fundamental steps (Exploratory step and decisional step) by following the general approach of SDM proposed in [29]:
A. Exploratory Phase
Allows a synthetic description (global auto-correlation index, generalization, density, smoothing), to discover the discrepancies giving the local specificities (local auto-correlation or local factor analysis) or to look for clusters. This first phase guides the decision-making phase. Our choice in this exploratory phase was on the spatial generalization method.
B. Decisional Phase
In this phase, more detailed analysis is made to explain the differences or to characterize the groups (characterization, classification rules or association rules). Our choice in this decisional phase was on characterization method.
IV.
Description of the Spatial Generalization Process
In this study, we have chosen non-spatial dominant
generalization; this one does not use a spatial hierarchy but generates less detailed locations by fusion of spatial objects.
The principle of this process is simple, an attribute oriented induction (AOI) method [30] is performed using thematic hierarchies, but keeping their spatial description. This induction produces values of homogeneous attributes for several objects. These objects are then merged.
finally, the presentation of driven comparison. Fig. 2 illustrates step 1 and 2 and Fig. 3 illustrates step 3 and 4.
Fig. 2. Step 1 and 2 of comparison process.
Fig. 3. Step 3 and 4 of comparison process.
A. Step 1: Data Collection
The relevant data of the database is collected by applying SQL query which partitions the data set into one target class and one or a set of contrasting class(es).
B. Step 2: Dimension Relevance Analysis
Only the relevant dimensions are included in the subsequent analysis after applying dimension relevance analysis on target and contrasting class(es). The method leads on ranking the relevance of the dimensions and only the more relevant dimensions will be included in data comparison process.
C. Step 3: Synchronous Generalization
The basic AOI algorithm used in this step is that proposed in [21]. The AOI algorithm breaks down into two processes, starting with the process of grouping the attributes according to the different concepts hierarchies and then the process of merging identical tuples.
The AOI algorithm is performed by substituting lower level concepts with its corresponding prime level concepts, which leads to a
prime relation, by eliminating duplicated tuples and accumulating the counts in the retained generalized tuples.
The prime target cuboid and the prime contrasting cuboid (s) arise from the generalization process that is performed on the target class to the level controlled by a user/expert specified dimension threshold and on the contrasting class generalized to the same level. Discriminated or comparison rule is an assertion which discriminates (or compares) the concepts of one (target) class from another (contrasting) class [31]. This rule gives a discriminated criterion which can be used to predict the class membership of new data.
Attribute-Oriented Induction is robust and handles noise and/ or exceptional cases elegantly because it incorporates statistical information (using count) and generates disjunctive rules. The association of count with each disjunction leads naturally to mining approximate rules, for which the conditions with negligible weight can be dropped in generalization and rule formation, since a negligible weight implies a minimal influence to the conclusion.
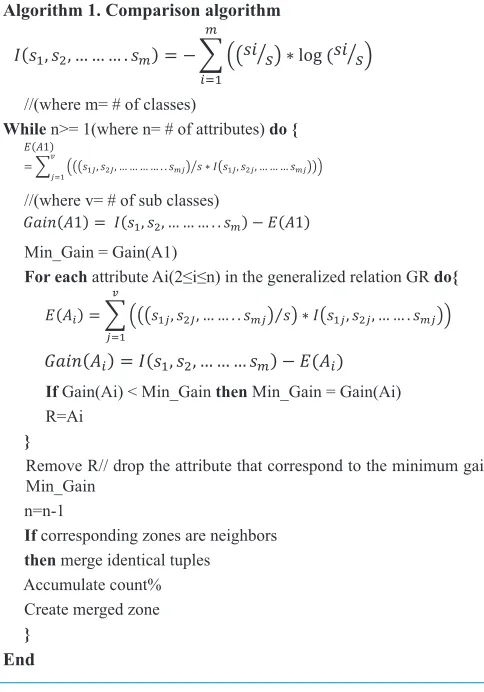
In our proposed approach, an alternative of comparison algorithm could be performed by calculating informational gain using the ID3 formula and taking into account the neighboring relation. This alternative of comparison algorithm is adapted for spatial generalization by integrating the neighborhood matrix as an input in the comparison algorithm (see Algorithm 1).
Algorithm 1. Comparison algorithm
//(where m= # of classes)
While n˃= 1(where n= # of attributes) do{
//(where v= # of sub classes)
Min_Gain = Gain(A1)
For each attribute Ai(2≤i≤n) in the generalized relation GR do{
If Gain(Ai) < Min_Gain then Min_Gain = Gain(Ai) R=Ai
}
Remove R// drop the attribute that correspond to the minimum gain Min_Gain
n=n-1
If corresponding zones are neighbors then merge identical tuples Accumulate count% Create merged zone }
End
D. Step 4: Presentation of Driven Comparison
The final result of the process can be driven in different forms like tables, diagrams or even box plots or logic rules. The information in the two classes is used to generate qualitative or quantitative discriminant rules. The generalized relation is transformed into conjunctive normal form, and multiple tuples are transformed into disjunctive normal form. Interesting rules can often be discovered by following different paths leading to several generalized relations for comparison.
The generalization process can be adjusted to the desired levels by performing roll up or drill down operations on the target and contrasting classes. Concept hierarchies can be created by users or domain experts, but also generated automatically based on value distribution or some clustering algorithms.
The induction process described above can be viewed as a data generalization and compression process, which compresses an initial relation into a usually much smaller prime relation, expressed at high concept levels.
V.
Case Study
A. Delimitating the Study Area
Our study area is composed of 26 communes of the provinces of Oran. They represent the 26 outbreaks of tuberculosis epidemic previously detected by “EPISOLAP” system. Table II shows the level 0 of Generalization: Gen_0 with 26 zones.
B. Formulation of the Addressed Problem
In Table I, we give a list of the factors considered by studies in tuberculosis epidemiological monitoring. These factors will be analyzed and combined as attributes using the non-spatial dominant generalization method to derive a ranking of factors. We consider in our case study the following relevant attributes: name, incidence_rate1, density, prec_const, inact_nbr, humidity.
TABLE I. Considered Attributes
N° CRITERION Type Scale Evaluation Method Source
1 Incidence rate Medical [15,115] Number of infectious
cases D.H.P
2
2 The density Of population Demographic [630,9660] Population mean, surface O.N.S
3
3 Number of precarious
constructions Demographic [0,5125]
Number of
slums O.N.S
4 Number of inactive Demographic [112,9928] education, Level of
age O.N.S
5 Humidity Climatic [1,4] according to Distance the sea O.N.M
4
1 It is calculated by the following formula:
Incidence rate=Number of infectious cases * 100000/(Population Mean) 2 Direction of Health and Population of Oran
3 Office National of Statistics of Oran
4 Office National of Meteorology of Oran
C. Experimentation
The objective of the process is to derive the general characteristics of 26 tuples of epidemic outbreaks using analytical characterization to identify the most influential factors on the spread of tuberculosis in Oran. The methodology leads on the classification of factors (or attributes) based on the calculation of the information gain of each considered attribute. Gen (ai) is the level of concept hierarchy and the initial level of generalization is Gen_0. It is the level of generalization before applying any generalization operation and ai is the removed attribute.
Step 1: Data collection
At the beginning, a DMQL query (Data Mining Query Language) is executed in order to collect the task-relevant data (Fig. 4). The objective of the data mining process is to compare high and low level of epidemiological outbreaks using discriminant rules.
Fig. 4. Collect the task-relevant data.
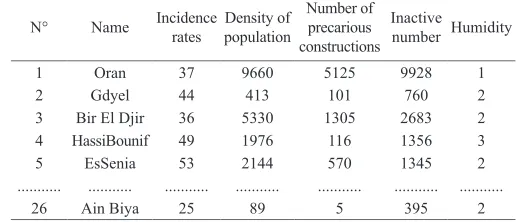
The result of the DMQL query is illustrated on Table II.
TABLE II. Example of 26 Tuples of Epidemic Outbreak
N° Name Incidence rates populationDensity of Number of precarious constructions
Inactive number Humidity
1 Oran 37 9660 5125 9928 1
2 Gdyel 44 413 101 760 2
3 Bir El Djir 36 5330 1305 2683 2
4 HassiBounif 49 1976 116 1356 3
5 EsSenia 53 2144 570 1345 2
... ... ... ... ... ... ...
26 Ain Biya 25 89 5 395 2
After that, we divide our data set into two classes, target class and contrasting class by executing two SQL queries us it is shown on Fig. 5. The target class contains the low level of risk outbreaks and contrasting class contains the high level of risk outbreaks. The results of the two SQL queries are illustrated on Table III.
TABLE III. Candidate Relation for Target and Contrasting Classes
Name Class Inac_rate Density Prec_ Const Inact_Nbr Hum Count A. Turck
Low 31 1005 197 671 1 12
……….. ……….. ……….. ……….. ……….. ……….. ………..
Tafraoui 35 63 5 289 4 5
Ain kerma
High 79 71 0 122 1 6
……….. ……….. ……….. ……….. ……….. ……….. ………..
S.Chami 55 1661 1282 2324 2 64
Step 2: Dimension relevance analysis
In the second step dimension, relevance analysis is applied by using analytical generalization in order to eliminate irrelevant attributes.
Attribute removal: We start by dropping the less relevant attribute, the name of outbreaks does not have any importance. Then we can drop it; after that we generalize some identical tuples.
Attribute generalization: it consists of discretization of continuous attributes into different categories according to the concept hierarchies of Fig. 6 and accumulate counts
• generalize incidence_rate to incidence_rate_C • generalize density in density_C
• generalize prec_const in prec_const_C • generalize inact_nbr in inact_nbr_C • generalize Humudity in Hum_C
Fig. 6. Conceptual hierarchies.
Candidate relation: incid_rate_C, density_C, prec_const_C, inact_nbr_C and Hum_C.
The resulting outbreaks dataset is illustrated in Table III. Hereafter, name outbreaks will be deleted in order to create a new table (see Table IV), the algorithm processes by looking for identical tuples in order to be merged in new created sectors if only the corresponding zones are neighbors. Therefore, only the last ones are neighbors, then they are merged in new sector S6.
TABLE IV. Table of the First Level of Generalization Process
Name Class Incid_rate_C Density _C Const _CPrec_ Nbr_C Hum_C CountInact_ Groupedzones A.Turck
Low
37-56 inf36314 inf570 inf788 1 12 A.Turck
……….. ………. ……….. ……….. ……….. …… …… ……
Tafraoui 37-56 inf36314 inf570 inf788 3 5 Tafraoui
A.kerma
High
sup57 inf36314 inf570 inf788 1 6 A. kerma
……….. ………. ……….. ……….. ……….. …… …… ………..
Bir El Djir Sup57 36314-88398 571-1305 788-2683 2 63 S6
……….. ………. ……….. ……….. ……….. …… …… ………..
S.Chami Sup57 36314 - 88398 571-1305 788-2683 2 64 S6
Step 3 Synchronous Generalization
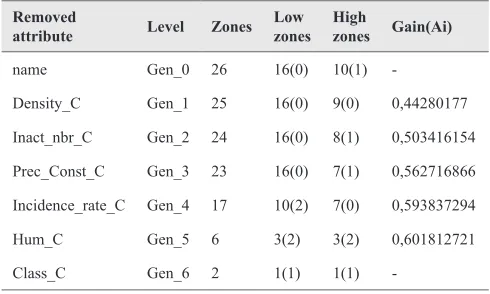
Synchronous Generalization is applied on target and contrasting classes simultaneously by using the comparison algorithm described in section IV (Algorithm 1). The entropy of each attribute is computed and classified in Table V. The number between brackets is the number of generalization operations executed in each level for both low and high zones.
TABLE V. Table of Gain and Number of Merging Zones
Removed
attribute Level Zones Low zones High zones Gain(Ai)
name Gen_0 26 16(0) 10(1)
-Density_C Gen_1 25 16(0) 9(0) 0,44280177
Inact_nbr_C Gen_2 24 16(0) 8(1) 0,503416154
Prec_Const_C Gen_3 23 16(0) 7(1) 0,562716866
Incidence_rate_C Gen_4 17 10(2) 7(0) 0,593837294
Hum_C Gen_5 6 3(2) 3(2) 0,601812721
Class_C Gen_6 2 1(1) 1(1)
-We start by removing irrelevant/weakly relevant attributes from candidate relation having density_C. The iterative process is executed according to different generalization steps. Each step corresponds to one removal attribute dropped by the order given in Table V. The rest of spatial generalization steps is given in the appendix.
Step 4: Presentation of the driven comparison
According to the forth level of spatial generalization, neighboring zones S6, S7 are merged in S8. The generalized area is formed in the center of the study area because of the same characteristics of merged zones, therefore we can extract the following discriminant rule describing the high level of epidemiological risk:
Fig. 7 summarizes the different steps of generalization by giving the removed attribute corresponding to each level of generalization and the geographic representation of the resulting merged zones. The spatial generalization tree is composed of geographic areas which are the administrative divisions grouped in new sectors that are created by the operation of regionalization. The final two sectors are the high sector and the low sector.
Fig. 7. Spatial Generalization tree.
G
en_
0
G
en_
1
G
en_
2
G
en_
3
G
en_
4
G
en_
5
G
en_
6
G
en_
7
Fig. 8. Visualization of spatial generalization process.
VI.
Conclusion
This article presents a new approach SOLAM based on spatial generalization applied according to the general characteristics of locations in lieu of the conventional spatial aggregation in SOLAP systems.
We have adopted the non dominant spatial generalization method based on the attribute-oriented induction method. This method has enriched SOLAP to no longer be limited to a simple aggregation function according to the administrative division of the study area but which may be based on the characteristics of the geographical regions. SOLAM engine helps classifying demographic and socio-environmental factors according to their levels of relevance. Thus, epidemiologists can focus their eradication actions and long-term prevention strategies by eliminating factors in order of relevance. EPISOLAM system has a new feature of sectorization (regionalization) allowing increasing to one level of generalization of geographic areas, whenever an irrelevant attribute is removed from the database.
SOLAM or semantic SOLAP is based on the comparison process performed by AOI algorithm which is tailored in our study by introducing the information gain in the process of identifying the most
relevant attributes. This current research studies the primary kernel of this category of decision support systems, which merits further studies to be more comprehensive. The approach can be generalized to various other cases involving spatial analysis problem of multidimensional information. The application of spatial or non-spatial dominant generalization performed by Attribute-Oriented-Induction approach based on multidimensional information for a particular geographic context can guide the application of confirmatory spatial analysis techniques to data related to this zone.
There are many important issues that should be explored in further research. First, there is a question of identifying other measures and rules that may capture patterns in data not already captured by characterization rules. An efficient test for spatial autocorrelation would fix this lack of information. Global and local autocorrelation analyses seem very useful in analyzing space and/or space-time phenomena. That could be introduced by calculating geo-statistical indexes (e.g. Moran and Lisa indexes respectively) in each level of generalization. The experimental results will be reported in the near future. Secondly, we will try to introduce time in the study of autocorrelation by applying geo-statistics techniques to EPISOLAP-MINING system in view to analyze autocorrelation between locations in different periods of epidemic peak. Also, we would like to extend spatial generalization process to a space-time generalization process which means extending AOI algorithm by introducing the neighborhood matrix extended on time as an input of the algorithm instead of only the spatial neighborhood matrix. We hope to explore this idea in a later paper. Finally, the dataset that we have presented in our case study was very small and it was used only for a validation purpose of our proposal. It might be fruitful to explore the behavior of the suggested algorithm when the dataset is very large in terms of number of recorded zones and for long periods of time.
Appendix
The resulting outbreaks dataset is illustrated in Table VI. Hereafter, density_C attribute will be deleted and identical tuples will be merged in order to create the Table VII. However, there is no new identical tuples for contrasting class in current outbreaks dataset and none of identical tuples are neighbors for the target class, therefore we keep the same table VI in table VII.
TABLE VI. Table of the Second Level of Generalization Process
Name Class Incid_rate_C Density _C Const _CPrec_ Nbr_C Hum_C CountInact_
A.Turck
Low
37-56 inf36314 inf570 inf788 1 12
……….. ……….. ……….. ……….. ……….. …… ……
Tafraoui 37-56 inf36314 inf570 inf788 3 5
Ain kerma
High
sup57 inf36314 inf570 inf788 1 6
……….. ……….. ……….. ……….. ……….. ……. ……..
Gdyel 37-56 inf36314 inf570 inf788 2 17
TABLE VII. Table of the Third Level of Generalization Process
name Class Incid_rate_C Prec_Const _C Nbr_C Hum_C CountInact_ Grouped zones
A.ElTurck
Low
37-56 inf570 inf788 1 12 A.ElTurck
……….. ……….. ……….. ……….. ……….. …… ……
Tafraoui 37-56 inf570 inf788 3 5 Tafraoui
Ain kerma
High
sup57 inf570 inf788 1 6 Ain kerma
……….. ……….. ……….. ……….. ……….. …… ……
El kerma sup57 inf570 Inf788 2 13 S7
Essenia sup57 inf570 788-2683 2 13 S7
Gdyel 37-56 Inf570 Inf788 2 17 Gdyel
The resulting outbreaks dataset is illustrated in Table VIII. Hereafter, Prec_Const_C attribute will be deleted and identical tuples will be merged in order to create the Table IX as follows: There are 2 identical tuples in the contrasting class which are neighbors then they are merged in the new sector S8.
TABLE VIII. Table of the Forth Level of Generalization Process
name Class rate_CIncid_ Prec_Const _C Hum_C Count Grouped zones
A.ElTurck
Low
37-56 inf570 1 12 A.ElTurck
……….. …….. ……….. ……….. …… ………..
Tafraoui 37-56 inf570 3 5 Tafraoui
Ain kerma
High
sup57 inf570 1 6 Ain kerma
……….. ……….. ……….. ……….. …… ………..
S6 sup57 571-1305 2 127 S8
S7 sup57 inf570 2 57 S8
Gdyel 37-56 Inf570 2 17 Gdyel
TABLE IX. Table of the Fifth Level of Generalization Process
name Class Hum_C Incid_rate_C Count Grouped zones ATurck
Low
1 37-56 12 S1
Bethioua 1 37-56 8 S2
Arzew 1 37-56 34 Arzew
Oran 1 37-56 288 S1
El Ancor 1 inf37 2 El Ancor
M Kebir 1 inf37 6 S1
M. Hadjaj 1 inf37 4 S2
…….. …….. …….. …….. ……..
O.Tlelat 3 inf37 3 S3
S.B.yebka 3 inf37 2 S5
Hassi Ben Okba 3 37-56 5 S4
Tafraoui 3 37-56 5 S3
H.Bounif 3 sup57 31 S4
H.Mefsoukh 3 sup57 6 S5
Ain kerma
High
1 sup57 6 Ain kerma
…….. …….. ……… …….. ……..
Gdyel 2 37-56 17 Gdyel
The resulting outbreaks dataset is illustrated in Table IX. Hereafter, Incid_rate_C attribute will be deleted and identical tuples will be merged in order to create the Table X. There are 5 new merged tuples
with two or three identical tuples corresponding to neighbor zones. Therefore, they are merged in new sectors S1, S2, S3, S4 and S5.
TABLE X. Table of the Sixth Level of Generalization Process
name Class Hum_C Count Grouped zones
S1
Low
1 306 S1
S2 1 12 S11
Arzew 1 34 S11
El Ancor 1 2 S12
Ain El Bia 2 8 S11
Boufatis 2 3 S11
Boutlelis 3 6 S12
S3 3 8 S11
S4 3 36 S11
S5 3 8 S11
Ain kerma
High
1 6 Ain kerma
Bousfer 1 8 S10
Benfreha 3 12 S9
El Braya 3 5 S10
Misserguine 3 31 S10
S8 2 195 S10
Gdyel 2 17 S9
The resulting outbreaks dataset is illustrated in Table X. Hereafter, Hum_C attribute will be deleted and identical tuples will be merged in order to create the Table XI. There are 4 new merged tuples containing several identical tuples corresponding to neighbor zones. Therefore, they are merged in new sectors S9, S10, S11 and S12.
The resulting outbreaks dataset is illustrated in Table XI. Hereafter, Class_C attribute will be deleted and identical tuples will be merged in order to create a new table. There are tuples with identical tuples but could not be merged in new sectors because they are not neighbors, then we keep Table XI.
TABLE XI. Table of the Seventh Level of Generalization Process
Name Class Count Grouped zones
S1
Low
306 S1
S11 109 S11
S12 8 S12
Ain kerma
High
6 Ain kerma
S10 239 S10
S9 29 S9
References
[1] Yvan Bédard, Marie-Josée Proulx, Sonia Rivest. Enrichissement de l’OLAP pour l’analyse géographique: exemples de réalisations et différentes possibilités technologiques. Soumis à la première journée francophone sur les entrepôts de données et analyse en ligne, Lyon, 10 juin 2005.
[2] Bimonte,S. A. Tchounikine, M. Miquel, F. Pinet. (2010). When Spatial Analysis Meets OLAP: Multidimensional Model and Operators. International Journal of DataWarehousing and Mining, 6(4), 2010, pp 33 to 60.
Conference on Software Engineering, Databases and Expert Systems (SEDEXS’12). November 13-14, 2013. Settat- Morocco.
[4] Han, J. (1998). Towards on-line analytical mining in large databases. ACM Sigmod Record, 27(1), pp. 97 to107.
[5] Han J., Chee S., Chiang J., (1998) Issues for On-Line Analytical Mining of Data Warehouses, in Proceedings of the 1998 SIGMOD Workshop on Research Issues on Data Mining and Knowledge Discovery (DMKD’1998), pp. 2 :1–2 :5, Seattle, Washington, USA.
[6] Sonia Rivest, Yvan Bedard & Pierre Marchand. Toward better support for spatial decision making: defining the characteristics of spatial on line abalytical processing (SOLAP). GEOMATICA Vol 55. No. 4, 2001, pp. 539 to 555.
[7] Ganesh Viswanathan & Marcus Schneider. OLAP Formulation for Supporting Complex Spatial Objects in Data Warhouses. 13th International Conference, DaWaK 2011, Toulouse, France, August 29-September 2, 2011. Proceedings (pp.39-50)
[8] Ganesh Viswanathan, Marcus Schneider. BigCube: A MetaModel for Managing Multidimensional Data. In: Proceedings of the 19th Int. Conf. on Software Engineering and Data Engineering (SEDE). (2010). pp. 237 to242.
[9] Maria Luisa Damiani & Stefano Spaccapietra. Spatial Data Warehouse Modelling. This paper appears in the publication, Processing and Managing Complex Data for Decision Support edited by Jerome Darmont and Omar Boussaid © 2006, Idea Group Inc.
[10] Fatiha Amenzougarene. Extension du modèle multidimensionnel
aux faitsqualitatifs. Application à l’analyseenligne des gènes des chantiersurbains. Thèse de doctorat de l’université de Versailles Saint Quentin en Yvelines. Présentéetsoutenuepubliquement le 19 septembre 2014.
[11] E. Malinowski & E. Zimanyi. OLAP Hierarchies: A conceptual
Perspective. Conference: Advanced Information Systems Engineering, 16th International Conference, CAiSE 2004, Riga, Latvia, June 7-11, 2004, Proceedings.
[12] Ibtisam Ferrahi, Sandro Bimonte, & Kamel Boukhalfa. Conception
logique et physique des hierarchies spatiales non strictesdans les entrepôts de données spatiales. Dans le proceeding de SAGEO ‘2016 Nice, 6-9 décembre 2016.
[13] ChengZhi Xu & Phillip C-Y Sheu. SOLAP Based on Novel Spatial
Dimentions. Y. Wu(Ed): Software Engineering and Knowledge Engineering, AISC 114, pp.383-391. Springer-Verglag Berlin Heidelberg 2012.
[14] Torben Bach Pedersen, JunminGu, ArieShoshani, Christian S.Jensen.
Object-extended OLAP quessrying. In the journal of Data & Knowledge Engineering, Vol. 68, pp. 453-480, 2009.
[15] Abdallah Bensalloua Charef, Hamdadou Djamila. Users Integrity
Constraints in SOLAP Systems. Application in Agroforestry. International Journal of Interactive Multimedia and Artificial Intelligence, Vol. 5, No. 1, pp. 47-56, 2018.
[16] Taher Omran Ahmed. Spatial On-Line Analytical Processing (SOLAP):
Overview and Current Trends. 2008 International Conference on Advanced Computer Theory and Engineering.
[17] Eveline Bernier, Yvan Bédard, Thierry Badard, Frédiric Hubert. UMapIT
(Unrestricted Mapping Interactive Tool): Merging the datacube paradigm with an occurrence-based approach to support on-demand web mapping. Centre de recherche en geomatiquesnUniversité Laval de Quebec. Canada.
[18] S. Bimonte, A. Tchounikine and M. Miquel “Spatial OLAP: Open Issues
and a Web Based Prototype” In the Proc. of 10th AGILE International Conference on Geographic Information Science, 2007, Aalborg University, Denmark.
[19] Han, J. 1997. OLAP Mining: An Integration of OLAP with Data Mining.
In Proceedings of the 7th IFIP 2.6 Working Conference on Database Semantics (DS-7), pp. 1 to9.
[20] Han, Jiawei. And Yongjian Fu, Y. 1995. Exploration of the power of
attribute-oriented induction in data mining. Simon Fraster University. In U. Fayyad, G. Piatetsky-Shapiro, P. Smyth and R. Uthurusamy, eds. Advances in Knowledge Discovery and Data Mining, pp.399 to421
[21] Jiawei Han, YandongCai and Nick Cercone (1992). Knowledge Discovery
in Databases: An Attribute-Oriented Approach. in proceedings of the 18th VLDB Conference. Vancouver, British Columbia, Canada.
[22] S. Warnars, Measuring Interesting rules in characteristic rule. Proceeding
of the 2nd International Conference on Soft Computing, Intelligent
System and Information Technology (ICSIIT), Bali, Indonesia, (2010) pp. 152 to156.
[23] Han J., Koperski K., and Stefanovic N. : GeoMiner : A system Prototype
for Spatial Data Mining, Proc. 1997 ACM-SIGMOD IntConf on Management of Data (SIGMOD’97), Tucson, Arizona, System prototype demonstration, 1997.
[24] Roddick J.F and Brian G. L. Spatio-Temporal Data Mining Paradigms and
Methodologies in Geographic Data Mining and Knowledge Discovery. Second edition. 2009.
[25] W. Lu, J. Han, and B. C. Ooi. Discovery of general knowledge in large
spatial databases. Proc. Far East Workshop on Geographic Information Systems, pp. 275-289, Singapore, June 1993.
[26] E. M. Knorr and R. Ng. Extraction of spatial proximity patterns by concept
generalization. Proc. 2nd Int. Conf Knowledge Discovery and Data Mining (KDD-96), pp. 347-350, Portland, OR, USA, August 1996.
[27] Y. Bédard, Amélioration des capacités décisionnelles des SIG par l’ajout
d’un module SOLAP. Université de Provence, Centre de Mathématiques et Informatique, LSIS, Marseille, 8 avril.2004.
[28] Zemri et al, 2015. Vers un système d’Aide à la Décision Multicritères et
Spatiotemporel pour la Surveillance Epidémiologique. Accepted paper in the Extraction et Gestion des Connaissances, EGC’2015. Actes de l’atelier GAST – Gestion et Analyse de données Spatiales et Temporelles. January 27 2015. Luxembourg.
[29] Zemri Farah Amina & Hmdadou Djamila. Integration of Data Mining
Techniques in Multi Criteria Spatial Decision Support System for Epidemiological Monitoring. Accepted paper in International Journal of Healthcare Information Systems an Informatics (IJHISI). June 2017.
[30] Han, Jiawei. And Yongjian Fu, Y. 1995. Exploration of the power of
attribute-oriented Induction in data mining. Simon Fraster University. In U. Fayyad, G. Piatetsky-Shapiro, P. Smyth and R. Uthurusamy, eds. Advances in Knowledge Discovery and Data Mining, pp. 399 to421.
[31] Warnars. S. Mining Patterns with Attribute Oriented Induction. In the
Proceedings of the International Conference on Database, Data Warehouse, Data Mining and Big Data (DDDMBD), Jakarta, Indonesia 2015.
Djamila Hamdadou
Specialised in Decision Support Systems, Multicriteria Analysis and Collaborative and spatial decisional Systems. She is professor and leads a research team at the laboratory of computer science of Oran (LIO) at the University of Oran1 in Algeria.
Farah Amina Zemri