Assessing School Students‟ Mathematic Ability
Using DINA and DINO Models
Mohammad Nasim Wafa
Department of Mathematics, Ghor Institute of Higher Education, Firozkoh city, Ghor, Afghanistan
Abstract : Cognitive diagnosis models (CDMs) are restricted latent class models that can be used to analyze response data from educational or psychological tests. This article focuses on evaluating the application of CDM in identifying school students’ mathematic abilities in grade 8 at four different schools in Afghanistan. In addition, this research aims at determining the 8th grade students’ level of mathematics at the school level. Followed by the analysis of a set of data from Trends in International Mathematics and Science Study (TIMSS) 2011 mathematics assessment is used to examine the Mathematical abilities of students in Grade 8, which measures 13 attributes and includes 32 questions. A sample size of 274 includes 129 girls and 145 boys, and the students are selected based on the multistage cluster sampling method from Ghor province. Under the cognitive diagnosis assessment framework, the deterministic, inputs, noisy, “and” gate (DINA) model and the deterministic, inputs, noisy, “or” gate (DINO) model are used.
Keywords: cognitive diagnosis models, item response theory, DINA, DINO, TIMMS 2011
I. Introduction
Cognitive Diagnosis Models (CDMs) are statistical and psychometric models developed to identify the examinees‟ ability to master fine-grained skills based on a pre-specified matrix. Cognitive diagnostic tests can be
used to identify the skill combinations that the examinee is likely to either possess or not possess or have all
attributes or not (Su, 2013). The objective of each of these models is to classify examinees according to their
mastery of skills assumed to be required. The use of CDMs methods has the advantage of not being available in
other methods. First of all, most other models including IRT assumes the statistical one-dimensionality of the dataset
and they need it as a precondition for calibrating queries and estimating parameters. In most models,
one-dimensionality is essential as a prerequisite for determining the location of the subjects along a hypothetical
continuum. One of the important features of CDMs is that it doesn't need to be one-dimensional. One-dimensionality
seems to be somewhat problematic in educational settings because research has shown that academic tools typically
consider sets of traits or sub-skills, each of which can create a separate statistical dimension. (Afzali, 2016).
CDMs are of growing interest in test development and in the measurement of human performances (Huang,
2014). Mathematics is one of the main courses in educational programs. The mastery of mathematics is a
precondition for entering higher academic levels. One way to incorporate the substantive definition into the
modeling process is to introduce specially designed items targeted to measure specific levels of the attributes
(PG-DINA; Chen & de la Torre, 2013). In recent years, educational research was characterized byincreasing demand for complex information on students‟ achievement.
There are many reasons why it is difficult to learn Mathematics for Afghans students. So far, coherent research
in evaluating and determining the strengths and weaknesses of Afghanistan students in attributes and skills in
mathematicshas not been investigated. Hence the main issue in this study is the strengths and weaknesses of
environment was not good in Afghan, actually inferior, but improved over the past decade than in the previous
years, including the presence of girls and boys in schools. Teaching in Afghan schools portrays a very traditional
approach, which promotes the rote learning of the subject, Curriculum problems are the main factor of declining
class size in this study(Mansory, 2010). Consequently, the development and evaluation of CDMs (Rupp, Templin, &
Henson, 2010) for Mathematics in the high schools, to structure knowledge and special skills processed in students. The goal is to provide information about students‟ weaknesses and their strengths to provide credible educational
information that can be used effectively by the teacher (Afshin, 2016).
In this study, we attempt to find the level or surface of the slipping and guessing of the students of Grade 8
using the DINA and DINO models. In particular, the International Mathematics and Science Study )TIMSS(, a
quadrennial assessment administered by the International Association for the Evaluation of Educational
Achievement (IEA) since 1995, evaluates the mathematics and science abilities of fourth and eighth-graders. The
TIMMS has taken an exam every four years in many countries, for example, 1999, 2003, 2007, 2011, 2015 and
2019, Afghanistan is not eligible for this competition.
Thus, in Afghanistan, there is no study about the evaluation of students' Mathematical abilities using cognitive
diagnosis models. There are only a few limited kinds of research on undergraduate Mathematics Education in
Afghanistan. So, this article is addressing the following objectives and questions.
A. Research Objectives
1. To evaluate the application of CDMs in identifying school students‟ mathematic abilities at grade 8
2. To determine the 8th grade students‟ level of mathematics at the school level.
B. Research questions
1. Which cognitive diagnosis model can be used to model students‟ Mathematical abilities?
2. What is Afghan secondary school students‟ level of Mathematical abilities?
InAfghanistan, most students in the Department ofMathematics,who have basic Mathematicalskills, have
distinct disadvantages, and a significant part of students fail to learn higher-level subjects. The academic failure in
this course and the weak results in national and international tests are due to this weakness. So, this study pays more
attention to construct the hierarchy of this course at the time of developing educational programs and follow a
cognitive diagnosis model in the process of learning as well as planning to ensure reciprocity. Prerequisite
knowledge for curriculum concepts and planning before training high-level skills can have a significant impact on
the quality of education and learning of Mathematics in Afghanistan middle schools.
II. The study background
In recent literature, several CDMs have been used to parameterize latent attribute space to model relationships
between attributes and help improve parameter estimation performance. These approaches include log-linear (Xu &
von Davier, 2008), unstructured tetra-choric correlation (Hartz, 2002), and tetra-choric structural correlation (de la
cognitive diagnosis models (or cognitively diagnostic models) (de la Torre, 2009; de la Torre & sun Lee,
2013;Henson & Douglas, 2005; Huebner & Wang, 2011; Tatsuoka, 1995), diagnostic classification models (DCM)
(Rupp & Templin, 2008a; Kunina et al., 2012).
Research on the impact of cognitive theory on test design was very limited as mentioned in (Gierl& Zhou,
2008; Leighton et al., 2004). Most CDMs application examples in the literature are limited to no more than eight
attributes (Hartz, 2002; Rupp & Templin, 2008b) because of the long computing time for models with larger
numbers of attributes and items. If the number of latent classes can be reduced from 2𝐾, the sample size needed to
obtain stable parameter estimates from CDMs calibrations will decrease. This will also result in faster computing
time. One solution to decrease the number of latent classes is to impose hierarchical structures (Leighton et al.,
2004) on skills. The resulting approach is able to assess and analyze more attributes by reducing the number of
possible latent classes and the sample size requirement (de la Torre, 2008, 2009; de la Torre & Lee, 2010). Two
methods to estimate attributes with hierarchical structures could be as de la Torre (2012) suggested: First, keeping
the EM algorithm as is, but without any gain in efficiency, the prior value of attribute patterns not possible under the
hierarchy can be set to 0, and second, for greater efficiency, but requiring minor modifications of the EM algorithm,
attribute patterns not possible under the hierarchy can be dropped.
A. DINA model:The DINA model (de la Torre & Douglas, 2004; Haertel, 1989; Junker &Sijtsma, 2001; Macready
& Dayton, 1977) is a noncompensatory CDM that assumes that lack of one attribute cannot be reimbursed by the
existence of another attribute. DINA works with a conjunctive condensation rule, which means that to have a high
probability of responding an item correctly, an individual need to master all the attributes required by that item. The
main limitation of the DINA model is that it does not make a distinction between respondents who did not master
only one or more than one attribute.
The DINA model estimates the probability of a correct response to item i for all the respondents in latent class c as follows:
𝜋𝑖𝑗 = 𝑃 𝑋𝑖𝑗 = 1 𝜉𝑖𝑗] = (1 − 𝑠𝑗)𝜉𝑖𝑗 ∙ 𝑔𝑗 1−𝜉𝑖𝑗 =
1 − 𝑠𝑗 𝑓𝑜𝑟 𝜉𝑖𝑗 = 1
𝑔𝑗 𝑓𝑜𝑟 𝜉𝑖𝑗 = 0
where 𝜋𝑖𝑗is the probability of correct response, 𝑋𝑖𝑗is the observed response, 𝜉𝑖𝑗is the attribute mastery indicator, and
𝑠𝑗and 𝑔𝑗are, respectively, the slipping and the guessing parameters. The slipping parameter,𝑠𝑗, is defined as the
probability of responding an item incorrectly for a respondent who has mastered all the required attribute:
𝑠𝑗 = 𝑃 𝑋𝑖𝑗 = 0 𝜂𝑖𝑗 = 1 , 𝑗 = 1,2, … . 𝐽
The guessing parameter, 𝑔𝑗, is the probability of responding an item correctly for a respondent who has not mastered
at least one required attribute:
If a respondent masters all the required attributes, 𝜉𝑖𝑗 = 1, the probability of responding the item correctly is equal
to the probability of not slipping for the item, 1 − 𝑠𝑗. On the other hand, if the respondent fails to master at least one
of the required attributes, 𝜉𝑖𝑗 = 0, the probability of responding the item correctly drops to the prob- ability of
guessing for the item, 𝑔𝑗. The DINA model order-constrains the slipping and guessing parameters: 1 − 𝑠𝑗is assumed
to be greater than 𝑔𝑗; thus, the probability of responding an item correctly is guaranteed to be always higher for the
respondents who mastered all the measured attributes than the respondents who lacked at least one of the measured attributes, regardless of the magnitudes of slipping and guessing parameters (Rupp et al., 2010).
The attribute mastery indicator is formulated 𝜉𝑖𝑗 = 𝑘𝑘=1𝛼𝑗𝑘𝑞𝑖𝑘, where A is the total number of attributes
measured, and 𝑞𝑖𝑘indicates whether attribute 𝑘 is measured by item i. The possible values that 𝑞𝑖𝑘takes are 0 or 1.
The other indicator 𝛼𝑗𝑘 identifies whether the respondent in latent class j mastered attribute 𝑘, which takes values of
0 or 1 as well. Since the attribute mastery indicator, 𝜉𝑖𝑗, is created through multiplication of each alpha for every
measured attribute, lack of a single measured attribute would cause the value of 𝜉𝑖𝑗to be 0.
B. DINO model : The DINO models also separate the latent classes into two groups for each item. It is supposing
that an item can be answered correctly if at least one of the required attributes involved in the item has been
mastered. Given the slipping and guessing parameters 𝑠𝑗′and 𝑔𝑗′, its item response function (IRF) is written
as 𝑃 𝑋𝑗 = 1 𝛼𝑗 = 𝑃 𝑋𝑗 = 1 ζ𝑗𝑙 = 𝑔𝑗
′ 1−ζ𝑗𝑙
1 − 𝑠𝑗′ ζ𝑗𝑙
where ζ𝑗𝑙 = 1 − 𝐾𝐾=1(1 −αlk)qjkis the deterministic
component of the model. The slipping parameter 𝑠 ′
𝑗 is the supposition that the examinees in latent class 𝑙 whose 𝜁𝑗𝑙 = 1 will slip and inaccurately answer the item 𝑗, and the guessing parameter 𝑔𝑗
′
is the supposition that the
examinees in furtive class l whose 𝜁𝑗𝑙 = 0 will guess and accurately answer the item. Officially, 𝑠 ′
𝑗and 𝑔𝑗 ′
are
defined as 𝑠′𝑗 = 𝑃(𝑋𝑗 = 0 | 𝜁𝑗𝑙 = 1) and 𝑔𝑗 ′
= 𝑃 𝑋𝑗 = 1 𝜁𝑗𝑙 = 0 .
C. The Duality of the DINA Model and the DINO Model:As Y. Liu et al. (2011) discovered and proved, theDINA model and the DINO model are technically identical under certain transformations of (a) the examinees‟ attribute
profiles, (b) their observed item scores, and (c) the model parameters. This means that one model can be expressed
in terms of the other and both models can be fitted by the same software. (As an aside, note that the characterization
of the special relationship between the DINA model and the DINO model as „„dual‟‟ deviates from the well-defined
meaning of this term in operations research; for details, consult Papadimitriou &Steiglitz, 1998.) Model is two
popular cognitive diagnosis models (CDMs) for educational assessment. They represent different views on how the
mastery of cognitive skills and the probability of a correct item response are related. Recently, however, Liu, Xu, and Ying demonstrated that the DINO model and the DINA model share a “dual” relation and which of the two
D. Q-matrix: The analysis of most CDMs is based on an item-attribute incidence matrix called a Q-matrix
(Tatsuoka, 1983). The diagnostic power of CDMs relies on the construction of a Q-matrix with attributes that are
theoretically appropriate and empirically supported (Lee &Sawaki, 2009). Studies on the Q-matrix can be normally
categorized as exploratory approaches intend to discover the Q-matrix from the data when the whole Q-matrix is
unknown. Confirmatory approaches aim to purify a certain Q-matrix in which some elements of the Q-matrix are
assumed to be known. Although an entirely exploratory approach obtains no information about the number of
attributes in advance, an approach given the number of attributes is still regarded as exploratory here as long as it
estimates the whole Q-matrix (Chung, 2014). After defining, determining and identify the Q-matrix for measuring
the test, the next step is to construct the Q-matrix.
In this study to form a Q-matrix, after translating the protocol or the codebook of the questions, encode a copy
of the Mathematic questions for Grade 8 of the TIMMS 2011 with attributes and the coding protocol and provide it
to 3 Math teachers with bachelor degree, who had 6-year, 8-year and 10-year training experiences, respectively.
They are asked for constructing the Q-matrix separately and independently. In a two-dimensional matrix in which
the columns contained those skills and each question measures attributes in the rows of the question, by specifying
either 1 or 0. Attributes are explained in the analysis section, Table, 3
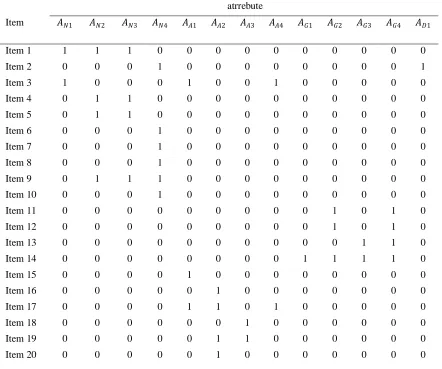
Table 1. Q-Matrix for Each Content Domain.
atrrebute
Item 𝐴𝑁1 𝐴𝑁2 𝐴𝑁3 𝐴𝑁4 𝐴𝐴1 𝐴𝐴2 𝐴𝐴3 𝐴𝐴4 𝐴𝐺1 𝐴𝐺2 𝐴𝐺3 𝐴𝐺4 𝐴𝐷1
Item 1 1 1 1 0 0 0 0 0 0 0 0 0 0
Item 2 0 0 0 1 0 0 0 0 0 0 0 0 1
Item 3 1 0 0 0 1 0 0 1 0 0 0 0 0
Item 4 0 1 1 0 0 0 0 0 0 0 0 0 0
Item 5 0 1 1 0 0 0 0 0 0 0 0 0 0
Item 6 0 0 0 1 0 0 0 0 0 0 0 0 0
Item 7 0 0 0 1 0 0 0 0 0 0 0 0 0
Item 8 0 0 0 1 0 0 0 0 0 0 0 0 0
Item 9 0 1 1 1 0 0 0 0 0 0 0 0 0
Item 10 0 0 0 1 0 0 0 0 0 0 0 0 0
Item 11 0 0 0 0 0 0 0 0 0 1 0 1 0
Item 12 0 0 0 0 0 0 0 0 0 1 0 1 0
Item 13 0 0 0 0 0 0 0 0 0 0 1 1 0
Item 14 0 0 0 0 0 0 0 0 1 1 1 1 0
Item 15 0 0 0 0 1 0 0 0 0 0 0 0 0
Item 16 0 0 0 0 0 1 0 0 0 0 0 0 0
Item 17 0 0 0 0 1 1 0 1 0 0 0 0 0
Item 18 0 0 0 0 0 0 1 0 0 0 0 0 0
Item 19 0 0 0 0 0 1 1 0 0 0 0 0 0
Item 21 0 0 0 0 0 0 1 0 0 0 0 0 0
Item 22 0 0 0 0 1 1 1 1 0 0 0 0 0
Item 23 0 0 0 0 0 1 1 0 0 0 0 0 0
Item 24 0 0 0 0 0 0 0 0 1 1 1 0 0
Item 25 0 0 0 0 0 0 0 0 1 0 1 0 0
Item 26 0 0 0 0 0 0 0 0 0 0 1 0 0
Item 27 0 0 0 0 0 0 0 0 0 0 1 0 0
Item 28 0 0 0 0 0 0 0 0 0 0 0 0 1
Item 29 0 0 0 0 1 0 0 1 0 0 0 0 0
Item 30 0 0 0 0 0 0 0 1 0 0 0 0 0
Item 31 0 0 0 0 0 0 0 1 0 0 0 0 0
Item 32 0 0 0 0 0 0 0 1 0 0 0 0 1
Table 1 presents the original Q-matrix for this example. For the 32 items in this assessment, the vector of skill requirements for each item forms the Q-matrix. 𝐴𝑁1, 𝐴𝑁2 , 𝐴𝑁3𝑎𝑛𝑑 𝐴𝑁4, are the attributes of the Number domain;
𝐴𝐴1, 𝐴𝐴2, 𝐴𝐴3 𝑎𝑛𝑑 𝐴𝐴4are the attributes of the Algebra domain; 𝐴𝐺1, 𝐴𝐺2, 𝐴𝐺3 𝑎𝑛𝑑 𝐴𝐺4are the attributes of the
Geometry domain; and 𝐴𝐷1are the attributes of the Data and Chance domain.
III. Method
A quantitative research approach was used to collect data for the current research. A total of 274 Afghan
students within 4 schools participated. In each classroom, 16 different classes of Afghanistan mathematics tests were
assigned randomly to students.
A. Research participants and research tool:The R package CDMs is used to fit the response data.A simple form in this research we study the mathematical experts‟ opinions, contains 8 linear hierarchical traits, it is given annually at
approximately 4 test centers in Ghor province of Afghanistan high schools, it there was 275 students in different
areas of Firouzkouh city145 boys and 129 girls. the average of examinees is around 11-17 years old.
The same questionnaire was used as in Taiwan, each student was requested to answer only one out of eight
booklets and only Booklets 1, 3, 5, and 7 were used for the current study. These booklets were selected based on the
criterion that each attribute analyzed in the study had to be included in at least three items (Corter&Tatsuoka, 2002).
For the purpose of comparisons across subgroups, these schools were selected into the rural and urban groups.
Schools located in a geographically isolated area and in the village or rural area, and there were also some schools
located in the middle of Firozkoh city.
Table 2. Demographic data of the participants
Age Gender Grade Number of classes
111-17 Male Female 8 16
129 145
B. Research analysis:Mathematical response datasets of the students in Grade 8 in Afghanistan were analyzed in
domains: Data and Chance, Geometry, Algebra, Algebra, and Number. The DINA model and DINO model were
used to fit the response data. The test was composed of 32 items, including 15 multiple-choice and 17 constructed
response items. There were 129 female and 145 male participants in this study.
Quantitative analyses were carried out in the process of test development and Q-matrix construction. the data
was analyzed using TIMSS 2011 with eighth grade mathematics data-sets from the students of Afghanistan who
were compared in this study. Students responded to the multiple-choice and constructed response items, assessing
four content domains: Number, Algebra, Geometry, and Data and Chance. analyzed together with the Q-matrix
using the R. Improving the teaching and learning of Mathematics and Science through providing data on student
progress in relation to different types of curricula, educational practices and educational environments, or schools
(Mullis& Martin 2003). Since the TIMSS mathematics items included multiple-choice and constructed responses, I
dichotomized (0 = wrong answer, 1 = correct answer) those items for the dichotomous DINA model in this study.
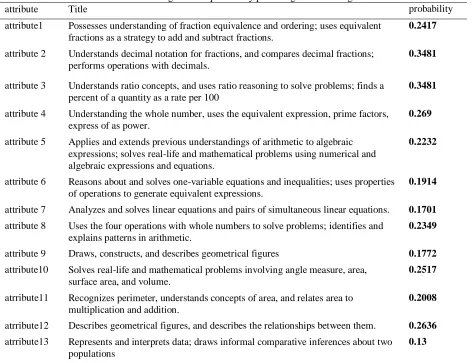
Table 3. Marginal skill probability percentage of mastering
attribute Title probability
attribute1 Possesses understanding of fraction equivalence and ordering; uses equivalent fractions as a strategy to add and subtract fractions.
0.2417
attribute 2 Understands decimal notation for fractions, and compares decimal fractions; performs operations with decimals.
0.3481
attribute 3 Understands ratio concepts, and uses ratio reasoning to solve problems; finds a percent of a quantity as a rate per 100
0.3481
attribute 4 Understanding the whole number, uses the equivalent expression, prime factors, express of as power.
0.269
attribute 5 Applies and extends previous understandings of arithmetic to algebraic expressions; solves real-life and mathematical problems using numerical and algebraic expressions and equations.
0.2232
attribute 6 Reasons about and solves one-variable equations and inequalities; uses properties of operations to generate equivalent expressions.
0.1914
attribute 7 Analyzes and solves linear equations and pairs of simultaneous linear equations. 0.1701
attribute 8 Uses the four operations with whole numbers to solve problems; identifies and explains patterns in arithmetic.
0.2349
attribute 9 Draws, constructs, and describes geometrical figures 0.1772
attribute10 Solves real-life and mathematical problems involving angle measure, area, surface area, and volume.
0.2517
atrribute11 Recognizes perimeter, understands concepts of area, and relates area to multiplication and addition.
0.2008
atrribute12 Describes geometrical figures, and describes the relationships between them. 0.2636
atrribute13 Represents and interprets data; draws informal comparative inferences about two populations
0.13
Table 3 shows the Marginal probability of mastering each of the thirteen attributes. According to the results in
the table, the highest probability of mastery in the attribute belongs to the attribute 4 at (0.4836) and the lowest
Table 4. Marginal skill probability percentage of mastering each Item
Item Probability Item probability
Item1 0.2153 Item17 0.2846
Item2 0.208 Item18 0.2956
Item3 0.2226 Item19 0.1569
Item4 0.489 Item20 0.1167
Item5 0.4014 Item21 0.0875
Item6 0.2372 Item22 0.197
Item7 0.3321 Item23 0.1204
Item8 0.3686 Item24 0.1496
Item9 0.2956 Item25 0.2481
Item10 0.2043 Item26 0.2627
Item11 0.3357 Item27 0.2846
Item12 0.3357 Item28 0.1934
Item13 0.2007 Item29 0.2554
Item14 0.2007 Item30 0.3686
Item15 0.1605 Item31 0.2116
Item16 0.2919 Item32 0.1204
Table 4 shows the marginal probability of the mastering of each item. According to the results in the table, the
highest probability of mastery belongs to item four at (0.489) and the lowest probability belongs to attribute 21
which is (0.0875).
Table 5 shows the guessing and slipping parameters based on the DINA model. According to Table 5, the lowest
guessing parameter of DINA models belongs to Item #32 and the highest guessing coefficient belongs to Item #4,
andthe lowest slipping coefficient belongs to Item #2 and the highest slipping coefficient belongs to Item #14. The
coefficient of lowest indicates the possibility of incorrectly responding to those who possess the skills needed to
answer the question. The smaller the guessing and slipping parameters, the better the fit between the diagnostic
measurement and experimental data in the CDMs (Ravand, Barati, &Widhiarso. 2012)
Table 5. Guessing and Slipping parameters in the DINA and DINA
DINA DINO
iteme Guess est. Guess SE Slip est. Slip SE Guess est.
Guess SE Slip est. Slip SE
Item 1 0.1623 0.0222 0.4182 0.1265 0.1184 0.0208 0.574 0.0662
Item 2 0.0909 0.0144 0 0 0.0117 0.0028 0.3264 0.0543
Item 3 0.1701 0.0242 0.2703 0.0808 0.0868 0.0206 0.579 0.0563
Item 4 0.364 0.0323 0.1761 0.0706 0.3742 0.0338 4.2E-16 1.2E-16
Item 5 0.1903 0.0219 0.0274 0.0104 0.2917 0.0305 0.1088 0.0265
Item 6 0.0846 0.0189 0.2713 0.0455 0.1238 0.0196 0.1724 0.0727
Item 7 0.203 0.0327 0.2541 0.044 0.2324 0.0272 0.1514 0.0671
Item 9 0.2738 0.0287 0.5875 0.1265 0.2639 0.0336 0.6108 0.0653
Item10 0.1836 0.0347 0.7315 0.0623 0.1782 0.0249 0.6628 0.1171
Item11 0.002 0.0002 5.1E-11 1.6E-11 0.2116 0.0268 0.2765 0.0555
Item12 0.3332 0.0341 0.6628 0.0895 0.2638 0.0309 0.4415 0.0745
Item13 0.1749 0.0227 0.4759 0.1374 0.1484 0.0272 0.7211 0.0567
Item14 0.1979 0.0249 0.7533 0.1189 0.0362 0.0131 0.5494 0.0559
Item15 5.5E-12 1.73E-12 0.5017 0.0655 0.0135 0.0025 0.3016 0.0764
Item16 0.2217 0.0372 0.3551 0.0572 0.2308 0.0282 0.3949 0.1027
Item17 0.2412 0.027 0.2611 0.0979 0.2464 0.0361 0.6491 0.0512
Item18 0.1881 0.0326 0.2547 0.0432 0.2716 0.0318 0.4105 0.0864
Item19 0.0815 0.0163 0.0561 0.0186 0.0813 0.0214 0.4923 0.0658
Item20 0.0289 0.013 0.4362 0.063 0.0308 0.0089 0.4365 0.1066
Item21 0.027 0.0118 0.6576 0.0699 0.0164 0.0054 0.001 0.0002
Item22 0.1857 0.0236 0.6375 0.1544 0.1822 0.0319 0.7787 0.0445
Item23 0.0718 0.017 0.373 0.0955 0.0289 0.0112 0.4535 0.0633
Item24 0.0744 0.0137 0 0 0.0751 0.0179 0.624 0.0677
Item25 0.2035 0.0266 0.5505 0.1138 0.2188 0.0294 0.6652 0.0808
Item26 0.2483 0.0412 0.7135 0.0583 0.2298 0.028 0.5368 0.1212
Item27 1.8E-08 4.02E-09 0.197 0.0344 0.17 0.0227 0 0
Item28 0.1694 0.0253 0.6363 0.1109 0.1401 0.0247 0.5903 0.0709
Item29 0.1424 0.0213 0.274 0.0754 0.1329 0.0246 0.4998 0.0646
Item30 0.1865 0.0305 0.0908 0.0178 0.2215 0.027 0 0
Item31 9.10E-16 2.58E-16 0.1567 0.0276 0.0291 0.0059 0 0
Item32 3.2E-110 9.5E-111 0 0 1.08E-145 4.7E-146 0.385 0.0573
Mean 0.1537 0.3462 0.1185 0.3462
The average values of the guessing and slipping parameters in the DINA model are 0.1537 and 0.3462. The mean
guessing parameter indicates that for the students who have not mastered all the required skills for an item, there is
still, on average, a 15.37 percent chance that they will choose the correct response and the average slipping
parameter indicates that for the students who have mastered all the skills required for an item, there is still, on
average, a 34.61 percent chance that they will choose the incorrect response. The most informative items on a test
are the ones whose slipping and guessing probabilities are low (Rupp et al., 2010). Generally speaking, small
guessing and slipping parameters indicate a good fit between the diagnostic assessment design, the response data,
and the postulated DINA model. The table above shows each item guess and slip parameters based on the DINA
model, the information in this table has the lowest guessing coefficients for item 32 and 31 with 3.2E-110 and
9.10E-16 the highest guessing coefficients its belong to the item#4 and 12 with values of0.364 and 0.3332 these
coefficients are likely to answer the question correctly for students demonstrates that they do not have the skills
to the 0 and the highest slip coefficient is related to items#14 and 10 with values of 0.7533 and 0.7315 This
coefficient indicates the probability of students answering the question incorrectly have the skills needed to answer
the question. And also, the item of guess and slip parameters based on the DINO model, the information in this table
has the lowest guessing coefficients for item 32 with 1.08E-145 and the highest guessing coefficients it belongs to
the item#4 with values of 0.3742. Also, the lowest slip value is related to items #27, 30 and 31 with values all are
equal to the 0 and the highest slip coefficient is related to items#22 with values of 0.7787 This coefficient indicates
the probability of students answering the question incorrectly have the skills needed to answer the question.
IV. Discussion
This research aimed at evaluating the application of two popular core Cognitive Diagnosis Models, the Deterministic Input Noisy “And” gate (DINA) and Deterministic Input Noisy “Or” gate (DINO) by identifying school students‟ mathematic abilities at grade 8. The analysis was done to show the level of probability in every
attribute in the questionnaire. The results demonstrated that the highest probability of mastery belonged to attribute 4
at (0.4836). However, the lowest probability belonged to attribute 24 and 32 which is (0.12). Then, another
descriptive analysis was done to show the level of probability in every item in the questionnaire. The results showed
that the highest probability of mastery belonged toitem four at (0.489). However, the lowest probability belonged to
item 21, which is (0.0875). The same analysis was calculated on the DINO model to demonstrate each item‟s guess
and slip parameters. Results show that the lowest guessing coefficients for item 32 with 1.08E-145 and the highest
guessing coefficients belonged to the item#4 with values of 0.3742. in addition, the lowest slip value related to items
#27, 30 and 31 with values all equals to the 0 and the highest slip coefficient is related to items#22 with values of
0.7787. This coefficient indicates the probability of students answering the question incorrectly has the skills needed
to answer the question.
This result is in line with Afzaly. et al. (2016) they found that eight basic attributes explain the mathematical
performance of first- grade high school students. Rahimi, et al. (2018) also found that most of the attribute was not
mastered in each skill, but the status of the individuals in the SUM skill. In addition, de la Torre and Sun Lee (2010)
focused on one CDM, the deterministic inputs, noisy “and” gate (DINA) model, and the invariance property of its
parameters. Using simulated data involving different attribute distributions, they found that the DINA model
parameters are absolutely invariant when the model perfectly fits the data. Another related study was conducted by
Ravand (2016) which demonstrated the application of the G-DINA to the reading comprehension data of a
high-stakes test. The study showed Syntax was the easiest and Inference was the most difficult attribute. The second most
difficult attribute was the Main Idea, followed by Detail and Vocab. The same results were also found by (Grabe&
Stoller, 2002; Lumley, 1993). Moreover, the findings of this study are in line with those of Baghaei and Ravand
(2015) who applied the linear logistic test model to these data . Further, Yi Chiuand Ko ̈ hn (2015) prove that the
ACTCD also found that an extension to the statistical framework of the ACTCD, originally developed for test data
conforming to the Reduced Reparameterized Unified Model or the General Diagnostic Model is valid also for both
indicate that the proposed models provide adequate convergence and correct classification rates. Finally, Yamaguchi
and Okada (2018) examined which CDMs better fit the actual data by comparatively fitting representative CDMs to
(TIMSS, 2007) assessment data across seven countries. First, CDMs were shown to have a better fit than did the
item response theory models. Second, the main effects models generally had a better fit than other parsimonious or
saturated models. Related to the second finding, the fit of the traditional parsimonious models such as the DINA and
DINO models were not optimal.
Thus, related studies show that CDM has been applied in different contexts such as mathematics and language
contexts. However, studies also show that there are not enough studies conducted in the mathematic context.
V. Conclusion
This research aimed at evaluating the application of two popular core Cognitive Diagnosis Models, the Deterministic Input Noisy “And” gate (DINA) and Deterministic Input Noisy “Or” gate (DINO) by identifying school students‟ mathematic abilities at grade 8. This research also tried to determine the 8th
grade students‟ level of
mathematics at the school level. The research applied Trends in International Mathematics and Science Study
(TIMSS) 2011 mathematics assessment in order to evaluate DINA and DINO models by examining the
Mathematical abilities of students in Grade 8. It measured 13 attributes which included 32 questions.
First, a descriptive analysis was done on the DINA model to show the level of probability in every attribute in the
questionnaire. The results demonstrated that the highest probability of mastery belonged to attribute 4 at (0.4836).
However, the lowest probability belonged to attribute 24 and 32 which is (0.12). Then, another descriptive analysis
was done to show the level of probability in every item in the questionnaire. The results showed that the highest
probability of mastery belonged to item four at (0.489). However, the lowest probability belonged to item 21, which
is (0.0875). Secondly, the same analysis was calculated on the DINO model to demonstrate each item's guess and
slip parameters. Results show that the lowest guessing coefficients for item 32 with 1.08E-145 and the highest
guessing coefficients belonged to the item#4 with values of 0.3742. in addition, the lowest slip value related to items
#27, 30 and 31 with values all equals to the 0 and the highest slip coefficient is related to items#22 with values of
0.7787. This coefficient indicates the probability of students answering the question incorrectly has the skills needed
to answer the question.
On the other hand, the R software analyses were done to show the levels of Guess and Slip in the DINA and
DINO models. The results on average values of the guessing and slipping parameters are 0.1537 and 0.3461. The
mean guessing parameter shows that the participants who did not master all the required skills for an item chose the
correct response. However, the participants who mastered all the required skills for an item chose the incorrect
response.
In addition, a calculation was done to show values related to each item in Guess and Slip parameters based on the
DINA model. Findings on Guess showed that the lowest guessing coefficients belonged to item #32 with 3.19E-110
these coefficients might answer the question correctly for students who tended not to have the skills needed to
answer the question.
Findings on Slip on the other hand showed that the lowest slip value was related to items #2, 24 and 32 with values
all equal to the 0 while the highest slip coefficient is related to items#14 with values of 0.7533. So, this coefficient
specifies the probability of students answering the question incorrectly, who had the skills needed to answer the
question.
VI. REFERENCES
[1] Baghaei, P., &Ravand, H. (2015). A cognitive processing model of reading comprehension in English as a foreign language using the linear logistic test model. Learning and Individual Differences, 43, 100-105.
[2] Birenbaum, M., Tatsuoka, C., & Yamada, T. (2004). Diagnostic assessment in TIMSS-R: Between-countries and within-country comparisons of eighth graders‟ mathematics performance. Studies in Educational Evaluation, 30(2), 151–173.
[3] Chen, J., & de la Torre, J. (2013). A general cognitive diagnosis model for expert-definedpolytomousattributes. Applied Psychological Measurement, 37(6), 419-437.
[4] Chung, M. (2014). Estimating the Q-matrix for cognitive diagnosis models in a Bayesian framework. Teachers College.
[5] Corter, J. E., &Tatsuoka, K. K. (2002). Cognitive and measurement foundations of diagnostic assessments in mathematics. The College Board: Technical Report.
[6] Corter, J. E., &Tatsuoka, K. K. (2002). Diagnostic Assessments for Mathematics Tests Grades 6-12.
[7] De La Torre, J. (2008). An empirically based method of Q-matrix validation for the DINA model: Development and applications. Journal of Educational Measurement, 45(4), 343–362.
[8] De La Torre, J. (2009). A cognitive diagnosis model for cognitively based multiple-choice options. Applied Psychological Measurement, 33(3), 163–183.
[9] De La Torre, J. (2009). DINA model and parameter estimation: A didactic. Journal of Educational and Behavioral Statistics, 34(1), 115–130.
[10] De La Torre, J. (2011). The generalized DINA model framework. Psychometrika, 76(2), 179–199.
[11] De La Torre, J., & Douglas, J. A. (2004). Higher-order latent trait models for cognitive diagnosis. Psychometrika, 69(3), 333–353. [12] De la Torre, J., & Lee, Y.-S. (2013). Evaluating the Wald test for item-level comparison of saturated and reduced models in cognitive
diagnosis. Journal of Educational Measurement, 50(4), 355–373.
[13] Dempster, A. P., Laird, N. M., & Rubin, D. B. (1977). Maximum likelihood from incomplete data via the EM algorithm. Journal of the Royal Statistical Society: Series B (Methodological), 39(1), 1–22.
[14] George, A. C., Robitzsch, A., Kiefer, T., Groß, J., &Ünlü, A. (2016). The R package CDM for cognitive diagnosis models. Journal of Statistical Software, 74(2), 1–24.
[15] Gierl, M. J., Zhou, J., & Alves, C. (2008). Developing a taxonomy of item model types to promote assessment engineering. The Journal of Technology, Learning and Assessment, 7(2).
[16] Grabe, W., & Stoller, F. (2002). Teaching and research reading. Harlow, UK: Longman.
[17] Haertel, E. H. (1989). Using restricted latent class models to map the skill structure of achievement items. Journal of Educational Measurement, 26(4), 301–321.
[18] Halimi, N. (2013). Mathematics Education in Secondary School in Afghanistan: Teachers‟ View and Practices on Teaching Problem Solving.
[19] Hartz, S. M. (2002). A Bayesian framework for the unified model for assessing cognitive abilities: Blending theory with practicality. ProQuest Information & Learning.
[20] Henson, R., & Douglas, J. (2005). Test construction for cognitive diagnosis. Applied Psychological Measurement, 29(4), 262-277. [21] Huebner, A., & Wang, C. (2011). A note on comparing examinee classification methods for cognitive diagnosis models. Educational
and Psychological Measurement, 71(2), 407–419.
[22] Junker, B. W., &Sijtsma, K. (2001). Cognitive assessment models with few assumptions, and connections with nonparametric item response theory. Applied Psychological Measurement, 25(3), 258–272.
[23] Kaya, Y., &Leite, W. L. (2017). Assessing change in latent skills across time with longitudinal cognitive diagnosis modeling: An evaluation of model performance. Educational and psychological measurement, 77(3), 369-388.
[24] Kunina‐Habenicht, O., Rupp, A. A., & Wilhelm, O. (2012). The impact of model misspecification on parameter estimation and item‐fit assessment in log‐linear diagnostic classification models. Journal of Educational Measurement, 49(1), 59-81.
[25] Lee, Y.-W., &Sawaki, Y. (2009). Application of three cognitive diagnosis models to ESL reading and listening assessments. Language Assessment Quarterly, 6(3), 239–263
[26] Lee, Y.-W., &Sawaki, Y. (2009). Cognitive diagnosis and Q-matrices in language assessment. Taylor & Francis.
[27] Lee, Y.-W., &Sawaki, Y. (2009). Cognitive diagnosis approaches to language assessment: An overview. Language Assessment Quarterly, 6(3), 172–189.
[28] Leighton, J. P., Gierl, M. J., &Hunka, S. M. (2004). The attribute hierarchy method for cognitive assessment: A variation o n Tatsuoka‟s rule-space approach. Journal of Educational Measurement, 41(3), 205–237.
[29] Leighton, J., &Gierl, M. (2007). Cognitive diagnostic assessment for education: Theory and applications. Cambridge University Press. [30] Mansory, A. M. (2010). Do Children Learn in Afghan Schools? Assessment of Math and Language Achievements of Students at the
[31] Mullis, I. V. S., Martin, M. O., Smith, T. A., & for the Evaluation of Educational Achievement, I. A. (2003). TIMSS: Assessment frameworks and specifications 2003. International Study Center, Lynch School of Education, Boston College~….
[32] Ravand, H. (2016). Application of a cognitive diagnostic model to a high-stakes reading comprehension test. Journal of Psychoeducational Assessment, 34(8), 782-799.
[33] Ravand, H., Barati, H., &Widhiarso, W. (2012). Exploring diagnostic capacity of a high stakes reading comprehension test: A pedagogical demonstration. Iranian Journal of Language Testing, 3(1), 12-37.
[34] Rupp, A. A., & Templin, J. (2008a). The effects of Q-matrix misspecification on parameter estimates and classification accuracy in the DINA model. Educational and Psychological Measurement, 68(1), 78–96.
[35] Rupp, A. A., & Templin, J. L. (2008b). Unique characteristics of diagnostic classification models: A comprehensive review of the current state-of-the-art. Measurement, 6(4), 219–262.
[36] Rupp, A. A., Templin, J., & Henson, R. A. (2010). Diagnostic assessment: Theory, methods, and applications. New York: Guilford. [37] Tatsuoka, K. K. (1983). Rule space: An approach for dealing with misconceptions based on item response theory. Journal of
Educational Measurement, 20(4), 345–354.
[38] Tatsuoka, K. K. (1995). Architecture of knowledge structures and cognitive diagnosis: A statistical pattern recognition and classification approach. Cognitively Diagnostic Assessment, 327–359
[39] Templin, J., & Henson, R. A. (2010). Diagnostic measurement: Theory, methods, and applications. Guilford Press.