E
missions
T
rading and
T
echnological
C
hange
Raphael Calel
——————————————————————–
A thesis submitted to the Department of Geography & Environment of the London School of Economics for the degree of Doctor of Philosophy,
Declaration
I certify that the thesis I have presented for examination for the PhD degree of the London School of Economics and Political Science is solely my own work other than where I have clearly indicated that it is the work of others (in which case the extent of any work carried out jointly by me and any other person is clearly identified in it).
The copyright of this thesis rests with the author. Quotation from it is permitted, provided that full acknowledgement is made. This thesis may not be reproduced without the prior written consent of the author.
I warrant that this authorisation does not, to the best of my belief, infringe the rights of any third party.
I declare that my thesis consists of 48,627 words.
Statement of conjoint work
I confirm that Chapter 5 was jointly co-authored with Dr. Antoine Dechezleprêtre and I con-tributed 75% of this work. In order to make the published version of Chapter 5 self-contained, it incorporates sections that appear in Chapter 4 in this thesis. Chapter 4 is single authored by the candidate.
Statement of prior publication
A version of Chapter 2 has been published in Wiley’s Interdisciplinary Reviews: Climate Change (Calel, 2013). Earlier versions of Chapters 3 and 5 have appeared as working papers, as Calel (2011) and Calel & Dechezleprêtre (2012) respectively.
Statement of use of third party for editorial help
I confirm that my thesis was copy edited for conventions of language, spelling and grammar by Jeremy Grove of Grove Proofreading & Editorial Services.
Disclaimers
for Scotland. The UK Data Service agrees that the attached outputs are non-disclosive, and cannot be used to identify a person or organisation. The original data creators, depositors or copyright holders, the funders of the Data Collections (if different) and the UK Data Service at the UK Data Archive bear no responsibility for the further analysis or interpretation of the data. This work uses research datasets which may not exactly reproduce National Statistics aggregates.
Abstract
Emissions trading programmes have grown in number and scope over the last forty years, and in the last decade they have become a centerpiece of global climate change policy. Emis-sions trading can in principle offer policy makers a flexible mechanism to reduce harmful emissions—polluters can choose their own emissions abatement strategy, and the trading mechanism can reduce the overall abatement cost by flexibly redistributing emissions per-mits to those polluters that find abatement costliest. In the context of climate policy, though, it is the potential to stimulate innovation and technological change that is most alluring. With-out transforming production, the quantity of emissions abatement will be insufficient; withWith-out technological change, the cost will be prohibitive. Emissions trading programmes are clearly not the only policy that affect technological change, but the extent to which these programmes encourage low-carbon technological change is perhaps still the most important criterion on which to judge their success or failure.
Advances in monitoring, greater data availability, and improvements in statistical and com-putational techniques have only recently made it possible to systematically study the impacts of emissions trading programmes on a large scale. In recent years, researchers have studied the impact of emissions trading programmes on company profitability, on employment, and on capital investment. This thesis aims to advance this research programme by contributing a systematic analysis of how emissions trading affects technological change.
Acknowledgements
The thanking of friends and colleagues and co-conspirators is the most enjoyable part of the completion of any work. To give proper due to all whom I owe, however, would be quite im-possible. I must therefore preemptively extend my thanks to all of you whom I have neglected to mention here, and beg your forgiveness.
I am grateful for the time and counsel of my supervisors Sam Fankhauser and Carmen Mar-chiori. I would also like to give special thanks to Antoine Dechezleprêtre and Antony Millner, two collaborators from whom I have learnt a great deal. Conversations with Devin Caughey, Denny Ellerman, Christian Johansson, George MacKerron, Ralf Martin, Blas Pérez Henríques, James Rydge, and Luca Tascini have also provided ideas and inspiration, and I am fortunate to have had the opportunity to draw upon their knowledge and experience. Haydn Jones of the Environment Agency has generously shared his unparalleled knowledge of the many in-tricacies of UK climate change policy. Richard Welpton and his dedicated colleagues at the UK Data Service have provided invaluable data access and assistance. They provide a genuine public service.
I owe great thanks to the Grantham Foundation, the Economic and Social Sciences Research Council, and the Jan Wallander and Tom Hedelius Foundation, whose generous financial sup-port has allowed me to devote my full energies to research. I am also grateful for further finan-cial support from the London School of Economics and Political Science, which has allowed me to attend additional conferences. The Grantham Research Institute on Climate Change and the Environment has offered an edifying environment in which to work, and I am grateful to the staff whose dedication has made it possible for me to conduct my research without distraction.
I would be remiss not to thank Phil Faulkner, Sriya Iyer, Melvyn Weeks, and Malcolm Pember-ton. While their influence on this thesis may be more remote, their past mentoring has been no less instrumental in turning me into the researcher I am today. I also owe an intellectual debt to Paul Rosenbaum, whose writings have been especially influential in shaping my thinking as an empirical researcher. I can only hope that this work is a credit to all of their names.
My PhD thesis would not have been possible without two pieces of open-source software— LATEX andR. I would like to acknowledge the thousands of people who have given their time and effort to make these available to the public free of charge.
Contents
1 Introduction 11
1.1 Emissions trading and technological change . . . 11
1.2 Thesis outline . . . 15
2 Carbon Markets: A historical overview 19 2.1 Introduction . . . 19
2.2 The early history of emissions trading . . . 20
2.3 The rise of carbon markets . . . 25
2.3.1 The road to Kyoto . . . 25
2.3.2 Emissions Trading in Europe . . . 27
2.3.3 Carbon markets around the world . . . 29
2.4 Carbon markets in action . . . 30
2.4.1 The EU Emissions Trading Scheme . . . 31
2.4.2 The Kyoto mechanisms . . . 34
2.4.3 Preliminary assessment of New Zealand Emissions Trading Scheme and RGGI . . . 35
2.5 Lessons . . . 36
2.5.1 Participation . . . 36
2.5.2 Over-allocation . . . 37
2.5.3 Investment and innovation . . . 39
3 Do market-based instruments encourage ‘green’ innovation?
A theoretical synthesis 43
3.1 Introduction . . . 43
3.2 Market-based instruments and technology choices . . . 45
3.2.1 The model . . . 45
3.2.2 Incentives to invest in ‘green’ technologies . . . 50
3.2.3 Market-based instruments and technology choices . . . 57
3.3 Extensions of the model . . . 60
3.3.1 Innovation and investment in equilibrium . . . 60
3.3.2 Market power . . . 62
3.3.3 Imperfect competition . . . 64
3.3.4 Heterogeneous firms . . . 65
3.3.5 Patents . . . 67
3.3.6 Optimal policy adjustment . . . 69
3.4 Conclusion . . . 74
4 Emissions Trading and Innovation: A study of UK firms 77 4.1 Introduction . . . 77
4.2 Emissions trading and innovation . . . 80
4.2.1 Empirical background . . . 80
4.2.2 The EU ETS and innovation . . . 82
4.3 Measuring innovation . . . 85
4.4 Matching with pre- and post-EU ETS attrition . . . 90
4.5 Impact of the EU ETS . . . 93
4.5.1 Changes in CO2 intensity . . . 93
4.5.2 Changes in patenting . . . 97
4.5.3 R&D expenditure . . . 101
5 Emissions Trading and Directed Technological Change: Evidence from the European
carbon market 110
5.1 Introduction . . . 110
5.2 Unpacking low-carbon technological change . . . 114
5.3 The direct impact of the EU ETS . . . 121
5.3.1 Matching . . . 121
5.3.2 Results . . . 123
5.3.3 Robustness tests . . . 127
5.4 The indirect impact of the EU ETS . . . 135
5.5 Discussion . . . 138
6 Conclusion 142 6.1 Summary of findings . . . 142
6.2 Discussion . . . 146
6.3 Future research . . . 147
Appendices
A Implementation of matching 151
B Details of low-carbon patent classification 154
C Details on data set used in Chapter 4 158
D Details on data set used in Chapter 5 159
E Details of other robustness tests in Chapter 5 160
List of Figures
2.1 A timeline of significant events . . . 21
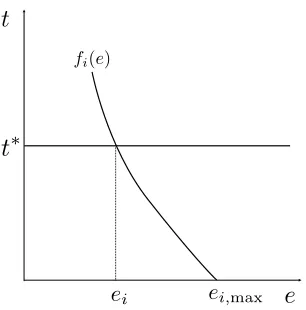
3.1 ‘Demand for emissions’ with technologyi . . . 48
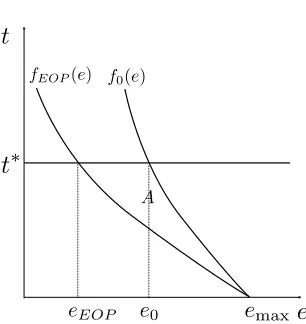
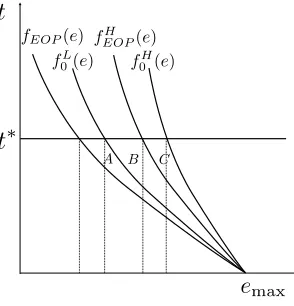
3.2 End-of-pipe innovations . . . 51
3.3 ‘Discrete’ and ‘proportional’ end-of-pipe innovations . . . 52
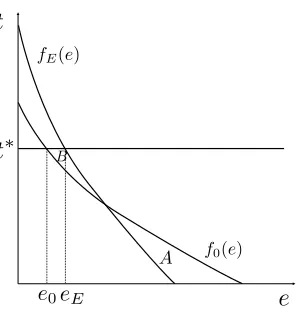
3.4 Efficiency-enhancing innovations . . . 53
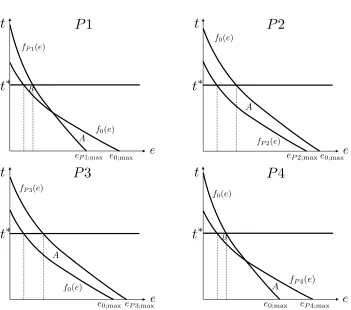
3.5 Process innovations . . . 55
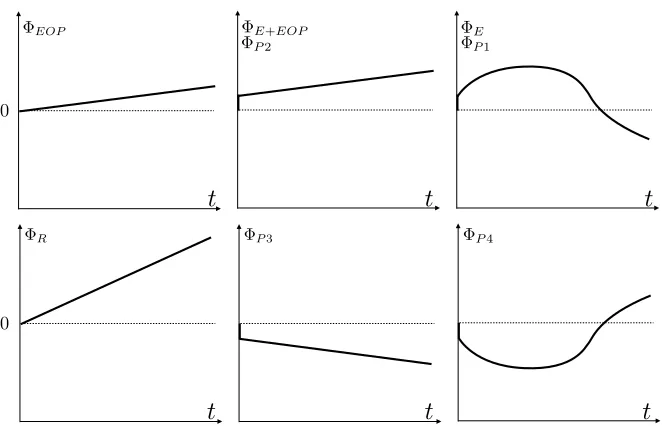
3.6 Incentives for investment . . . 57
3.7 Incentives in equilibrium . . . 61
3.8 Market power and initial emissions allocation . . . 63
3.9 Incentives with patents . . . 68
3.10 Incentives for innovation for ‘regulation-takers’ and ‘regulation-setters’ . . . 71
4.1 Comparison of matched EU ETS and non-EU ETS firms . . . 94
4.2 Comparison of matched EU ETS and non-EU ETS firms . . . 98
4.3 Comparison of matched EU ETS and non-EU ETS firms . . . 103
5.1 Share of low-carbon patents (1978–2009) . . . 116
5.2 Share of low-carbon patents and Crude oil price(1978–2009) . . . 117
5.3 Comparing the share of low-carbon patents (1978–2009) . . . 119
5.4 Comparison of matched EU ETS and non-EU ETS firms . . . 122
List of Tables
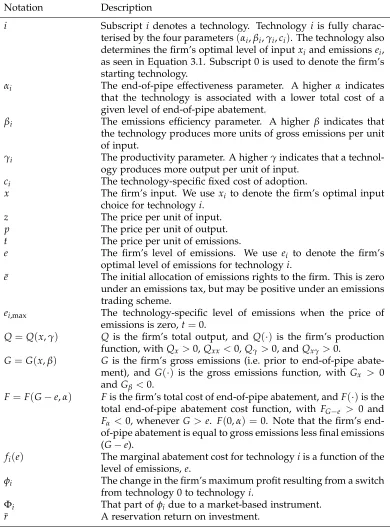
3.1 Summary of notation . . . 49
3.2 The effect of optimal policy adjustment on the incentives of ‘regulation-takers’ and ‘regulation-setters’ . . . 72
4.1 EU ETS implementation in the UK . . . 92
4.2 Equivalence tests for matched EU ETS and non-EU ETS firms . . . 95
4.3 Equivalence tests for matched EU ETS and non-EU ETS firms . . . 99
4.4 Equivalence tests for matched EU ETS and non-EU ETS firms . . . 102
5.1 Coverage of the EU ETS . . . 118
5.2 Equivalence tests for matched EU ETS and non-EU ETS firms . . . 123
5.3 Summary of results . . . 126
5.4 Equivalence test for matched EU ETS and non-EU ETS firms on ‘unobserved’ variable . . . 128
5.5 Equivalence tests for matched co-patenters and non-co-patenting firms . . . 137
B.1 Climate change mitigation patent categories (EPO’s Y02 class) . . . 154
E.1 Treatment effect estimates using ‘distant’ matches . . . 161
E.2 Estimates with different definitions of “low-carbon technologies” . . . 162
Chapter 1
Introduction
1.1
Emissions trading and technological change
Over the long haul, perhaps the most important single criterion on which to judge
envi-ronmental policies is the extent to which they spur new technology toward the efficient
conservation of the environment.
—Kneese & Schultze (1975, p. 38)
Technological change is at once the most important and least understood feature driving the
future cost of climate change mitigation. . . Yet, in many ways, we are no closer to
under-standing the answer of how policies will affect the overall rate and direction of technological
change.
—Pizer & Popp (2008, p. 2768)
Emissions trading programmes have assumed an increasingly prominent role in
environmen-tal policy over the last few decades. In the US, the Acid Rain Program, the Regional
Green-house Gas Initiative (RGGI), and California’s cap-and-trade programme are all examples of
this trend. The EU Emissions Trading Scheme (EU ETS) has been the centerpiece of European
of Quebec have all recently created their own emissions trading programmes to regulate
green-house gas emissions. China, Japan, South Korea, and several others are individually making
moves toward launching their own programmes as well. In terms of its traded value the
in-ternational carbon trade is today worth over $175 billion a year (Kossoy & Guigon, 2012), and
with so many new initiatives in the pipeline, this number is expected to grow much larger in
years to come.
The principal objective of emissions trading programmes is to reduce harmful emissions. This
can in principle be achieved by reducing output among heavily polluting firms and industries,
but in practice the aim is to encourage these firms to produce their output with less emissions.
In comparison with more conventional regulatory approaches such as technology-based
stan-dards, emissions trading programmes give firms much greater flexibility to choose their
com-pliance strategy. It is this flexibility that has made emissions trading attractive to economists,
policy makers, and industry alike. In the short term, the cost of abatement is lower because
the price mechanism reallocates emissions permits to the firms that find abatement costliest.
In the longer term, one hopes that this flexibility will encourage firms to undertake innovation
that reduces the cost of emissions abatement.
In the context of climate change, the hope that emissions trading programmes will encourage
technological change reigns supreme (Stavins, 2007).1 Without transforming existing capital stocks, abatement strategies such as fuel switching in the power sector will likely achieve no
more than 3% of the emissions reductions needed by 2050 (International Energy Agency, 2012).
In Europe, fuel switching has the potential to reduce carbon dioxide emission by only about
300 million tonnes per year (Delarue et al., 2008), less than 10% of what is needed to meet the
EU target to cut emissions by 80% by 2050 against 1990-levels.2
If expense was no object, it might be feasible to meet the world’s needs in the next half-century
while simultaneously avoiding potentially dangerous increases of atmospheric carbon dioxide
1From page 32: “Given the long-term nature of climate change, it is exceptionally important that the
cap-and-trade approach provide incentives for long-term technological change. Technologies yet to be developed may significantly reduce the long-run cost of achieving climate policy objectives. It is critical that climate policies en-courage innovations in technologies and in how fossil fuels are used. By rewarding emissions reductions, however they are accomplished, the cap-and-trade system provides broad incentives for innovations that lower the cost of achieving emissions targets.”
2The EU target amounts to reducing annual emissions by roughly 4,500 million tonnes compared to 1990, or
concentrations using only existing technologies (Pacala & Socolow, 2004). In practice, though,
cost is perhaps the chief obstacle to major mitigation action, and technological change may
be the single most important determinant of the future cost of emissions abatement (Pizer &
Popp, 2008, quoted above). Without transforming production, the quantity of abatement will
be insufficient; without technological change, the cost will be prohibitive. In this sense,
tech-nological innovation is a necessary precursor to achieving longer term emissions abatement
targets at a manageable cost. Consequently, the ability of new emissions trading programmes
to influence the rate and direction of technological change is a key criterion on which to judge
their success or failure.
The often articulated hope that emissions trading will stimulate low-carbon innovation (see,
for instance, European Commission, 2005) springs in large part from an application of the
“induced innovation” hypothesis (Hicks, 1932; Porter, 1991). It posits that when regulated
firms come to face (or expect to face) a higher price on emissions relative to other costs of
production, they innovate to reduce the emissions intensity of their output.3 This would in principle apply to any regulatory regime that makes emissions costlier, but one hopes that by
giving firms the flexibility to choose their own compliance strategy, a market-based instrument
like emissions trading affords polluters greater opportunities and incentives to innovate and
develop new cheaper ways to reduce emissions.
It is important to note that, although low-carbon innovation is provided, the
under-pricing of carbon emissions may not be the only cause. A number of other market failures
in early research, in demonstration and in commercialisation would similarly contribute to
under-investment (Garnaut, 2011). The inability of investors to write long-term contracts with
consumers (Neuhoff & De Vries, 2004), and the failure of the market to adequately price
ex-ternal knowledge economies also contribute to the problem (Jaffe et al., 2005). When these
market failures are taken into account, a picture emerges in which emissions trading is
consid-ered only one element of the set of policies needed to induce low-carbon innovation (Fischer
& Newell, 2008; Hanemann, 2009, 2010; Newell, 2010; Acemoglu et al., 2012). Even with this
more modest view as to what level of low-carbon innovation an emissions trading programme
3It follows from this hypothesis that if carbon emissions are priced, low-carbon innovation is
might accomplish, however, it remains a hypothesis with empirical content. The purpose of
this thesis is to investigate how emissions trading affects technological change.
Before outlining the structure of the thesis, it is perhaps worth to try disposing of a common
source of terminological confusion. Terms likeinnovationandtechnological changehave already
cropped up in the opening paragraphs, and will be used throughout this thesis, but how does
one define them? A literature spanning the works of Joseph Schumpeter and W. Brian Arthur
has not yet agreed upon an unambiguous definition, and I would not presume here to have
a good answer to this question either. Firms make operational improvements, acquire more
fuel-efficient equipment and machinery, develop entirely new technologies, etc.. These
strate-gies differ in many dimensions; they are associated with different costs, different potential
emissions reductions, different probabilities that future emissions reductions will be realised,
different time-scales on which such emissions reductions might be realised, and with different
opportunities to monetize and appropriate the return on investment. While acknowledging
these differences, the terminnovationis perhaps most useful as a shorthand for this collection
of strategies. A term like technological change places greater emphasis on a subset of these
strategies, namely those with a greater emphasis on enlarging the set of technologically
fea-sible abatement opportunities. This does not resolve all of the terminological ambiguities, of
course, but it will be mostly safe to set them aside for present purposes. It will be enough to
acknowledge that these terms evoke useful sets of ideas that facilitate discussion.
When in later chapters I study particular variables—like the number of patents, R&D
expen-ditures, and carbon intensity of output—the intention is first and foremost to describe the
behaviour of quantities that decision makers are likely to find of interest, or quantities that
are at least thought to be closely related to some set of strategies of interest (e.g. patents are
believed to be closely related to the creation of technological knowledge and products). They
are inevitably imperfect measures of innovation, and I shall always discuss the advantages and
limitations of any indicator before it is used. While recognising the limitations, I will
never-theless often use terms likeinnovationandtechnological changewhen discussing the behaviour
of these quantities. When employed in this context, these terms serve chiefly as devices for
1.2
Thesis outline
The remainder of the thesis comprises four essays, each addressing questions about the
im-pact of emissions trading on technological change. Chapter 2 undertakes the first crucial task
of trying to acquire an understanding of the historical context in which emissions trading
programmes, and carbon markets in particular, have developed. This provides essential
back-ground for questions about the purpose and likely success of emissions trading programmes
for greenhouse gases. It is also a starting point for interpreting the limited evidence we already
have on the real-world consequences of emissions trading programmes. To this end, Chapter
2 presents a historical overview of the rise of emissions trading as an instrument of climate
change policy, and an assessment of the early empirical evidence on the impacts of carbon
markets. This historical perspective highlights that emissions trading programmes have often
been adopted because of it offers an attractive compromise in many different political contexts.
The ultimate success of these programmes, however, has been determined by other factors,
such as the technological opportunities for pollution control. Although the political process
of conflict and compromise that has given rise to carbon markets is familiar from historical
experience, this process has not guaranteed the same preconditions that have allowed some
earlier programmes to succeed. In particular, the technological opportunities for controlling
carbon emissions today are very different from the technological capacity to produce unleaded
petrol in the late 1970s, to substitute for chlorofluorocarbons in the late 1980s, and to
desul-phurize coal-fired power plants in the 1990s. This limits our ability to extrapolate the likely
impact of carbon markets on technological change from past emissions trading programmes,
and highlights the value of gathering new evidence.4
Stepping back from the historical overview of Chapter 2, Chapter 3 asks what economic theory
would lead us to believe about the relationship between carbon markets and innovation. In this
chapter I propose a simple but general algebraic model of a firm’s innovation decision, which
incorporates many strands of the theoretical literature on induced innovation in
environmen-tally sound technologies. The objective is to integrate into one analytical framework the large
4An abridged version of Chapter 2 has already been published inWiley Interdisciplinary Reviews: Climate Change
number of potential settings in which an emissions trading might be introduced—with market
power, with firm heterogeneity, with dynamic inconsistency, etc.—and to try to discover the
extent to which economic theory can help delineate the relationship between emissions trading
and innovation in a way that may be of use for empirical study. Economic theory, it turns out,
accommodates a great many possibilities, including the possibility that a higher price on
emis-sions reduces the incentive to innovate. A general economic framework can serve to highlight
some surprising, and potentially perverse, impacts of emissions trading programmes, and to
help explain why one might observe such effects, but it provides few predictions about the
impacts of emissions trading on innovation that can be easily tested in practice.
To learn about how emissions trading actually impact upon technological change, then, it is
necessary to systematically probe incoming observations. This is what I do in Chapters 4 and
5, which investigate the effects of the European Union Emissions Trading Scheme (EU ETS)
on technological change. The EU ETS is the largest carbon market anywhere in the world,
accounting for over 85% of the international carbon trade (Kossoy & Guigon, 2012). It would
be very difficult to detect the effect of the EU ETS on the pattern of innovation without first
linking that innovation data to other company data and to regulatory data. When this research
was started, then, the lack of such data sets posed a special challenge. The analyses presented
in Chapters 4 and 5 were only made possible by considerable efforts to collect and link together
information from a large number of data sources.
Another challenge was to develop empirical strategies fit for the purpose of identifying the
causal impact of the EU ETS on innovation. The growing empirical literature employs a
vari-ety of strategies, often based on expert or manager interviews, but few studies make adequate
attempts to link descriptive statements to causal ones. I use regulatory variation arising from
installation-level inclusion criteria—thresholds used by regulators to determine which
instal-lations are big enough to regulate—to hone in on sets of firms for which the introduction of
the EU ETS parallels the conditions of a randomised trial. With a combination of matching
and nonparametric estimators modified to take account of the special properties of innovation
data (e.g. patenting is censored from below at zero), I estimate the impact of the EU ETS on
Chapter 4 presents a detailed study of the impact of the EU ETS on the innovation activities of
UK firms. I exploit installations-level inclusion criteria to estimate the impact of the EU ETS
on carbon intensity of output at the firm-level, on low-carbon patenting, and on low-carbon
research and development (R&D) expenditure. These measures respectively serve as indicators
of changes in efficiency, of the development and marketing of new low-carbon technologies,
and of future technological advances. Together, these three indices also speak more broadly
to the question of whether the EU ETS has substantively altered the incentives for low-carbon
innovation. The evidence suggests that the principal impact of the EU ETS has been an increase
in low-carbon R&D and patenting. Sizeable responses among firms indirectly covered by the
EU ETS, however, translate into increases in low-carbon R&D and patenting roughly in the
order of 2% in the context of the wider UK economy. There are, though, also indications that
these gains in low-carbon innovation may have crowded out other innovative activities. An
important finding in its own right, though, is that there are important data restrictions that
limit our ability to draw confident conclusions about the EU ETS’s impact on innovation. In
practice, sample size becomes an important limiting factor when studying firms in a single
country, comparing within that country only subsets of similar firms, and being concerned
with activities like patenting and R&D that are observed for relatively small samples and that,
in any case, many firms do not take part in. The empirical estimates therefore provide an
informed sketch of the EU ETS’s impact on innovation, which can serve as a basis for further
investigation. Additional evidence must be brought to bear on individual elements of this
story in order that we may either revise or reinforce our preliminary conclusions.
With this objective in mind, Chapter 5 presents the first comprehensive EU-wide empirical
assessment of the impact of the EU ETS on technological change. Exploiting the programme’s
installations-level inclusion criteria once again, we estimate the impact of the EU ETS on
patenting for low-carbon technologies. Studying the EU ETS as a whole overcomes the sample
size concerns of Chapter 4 and allows us to estimate the impact with greater precision. We
find that the EU ETS has increased low-carbon patenting among regulated firms by as much
as 10%, while not crowding out patenting for other technologies. We also find evidence to
com-panies. These results imply that the EU ETS accounts for nearly a 1% increase in European
low-carbon patenting compared to a counterfactual scenario without the EU ETS. The results
speak to the impact of emissions trading on the rate, the direction, as well as the distribution,
of technological change. The estimates reflect a roughly comparable effect, although
some-what more modest, on low-carbon patenting to that observed in Chapter 4, but reverses the
conclusion that the EU ETS has crowded out patenting for other technologies. On the central
question, the results in Chapter 5 broadly reinforce the conclusion that the EU ETS has had
an impact on the rate and direction of technological change in a way that favours low-carbon
technologies, but also emphasise the limited reach of this effect.
The essays can, in principle, be read independently—each reviews relevant background
liter-ature, discusses methods and data, and draws conclusions from the analysis in that essay—
though there are recurring questions and themes throughout (and, unavoidably, some
repeti-tion, which I hope the reader will forgive). Chapter 6 concludes the thesis by pulling together
the key findings from the four essays. I consider whether any overarching conclusions can be
Chapter 2
Carbon Markets: A historical overview
2.1
Introduction
One of the core recommendations from environmental economics is that when the market fails
to exact an adequate price for environmental damages, governments must instead demand that
this price is paid. As theStern Reviewfamously put it, climate change “must be regarded as
market failure on the greatest scale the world has seen” (Stern, 2007, p. 25), and the carbon
market is one of the chief instruments with which governments all over the globe have chosen
to redress this failure.
International carbon markets have a traded value of over $175 billion a year (Kossoy & Guigon,
2012), and affect businesses in all sectors of the economy. Despite uncertainty surrounding
what kind of an international framework might succeed the Kyoto Protocol, carbon markets
remain a central component of world climate policy. Carbon market programmes have
al-ready been implemented in the European Union, New Zealand, the US (at state level), Canada
(province level), and Kazakhstan, and further initiatives are underway in US (also state level),
Australia (currently a fixed price scheme), Canada (again at province level), China (province
level), Japan, and South Korea.
The history of carbon markets is, on the one hand, a great political success story. Where
dis-agreements between businesses and environmentalists, the US and the EU, developing and
proposals ultimately gained support from both sides. On the other hand, the more recent
his-tory of carbon markets is characterised by criticism: criticism for not delivering real emissions
reductions, for providing financial windfalls to emitters, and for failing to provide incentives
for private sector investment in low-carbon technologies.
This chapter reviews this history of conflict, compromise, and criticism, from the 1960s
on-wards, as a prism through which we can better understand what is happening now. Viewing
these markets in a historical light teaches us both about bad habits we must work harder
to break (e.g. over-allocating permits), and about good fortunes that we perhaps cannot take
for granted (e.g. technological change). Many of the current problems have precedent, and
we are perhaps not learning enough from past experiences. If carbon market policies were
more geared toward systematic evaluation, and more open to incorporating past lessons into
new policy, carbon markets may stand a greater chance of helping achieve the transition to a
low-carbon economy.
Section 2.2 recounts the early history of emissions trading, before it was considered a way to
control greenhouse gas (GHG) emissions. Section 2.3 then reviews the events of the 1990s and
2000s that gave rise to carbon markets. Section 2.4 surveys the most recent history of carbon
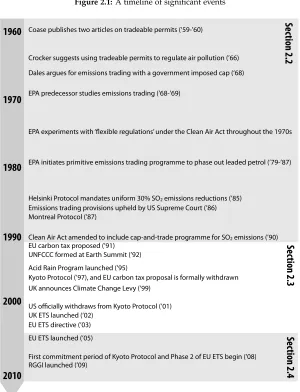
markets, since their implementation. Figure 2.1 provides a timeline of significant events, and
indicates the section in which each event is discussed. Section 2.5 tries to understand the recent
performance of carbon markets in light of the political processes that created them, and what
lessons we might learn. Section 2.6 offers a few concluding observations.
2.2
The early history of emissions trading
Before the 1960s, the discipline of economics could mainly offer Pigou’s suggested method
of controlling excessive pollution to policy makers: levy a tax on polluters for each unit of
emissions. Then Coase (1959, 1960) proposed a new form of intervention. First establish the
property rights of the parties, he argued, and then “it can be left to market transactions to
bring an optimum utilization of rights” (Coase, 1960, p. 27).
Figure 2.1:A timeline of significant events
Emissions trading provisions upheld by US Supreme Court (’86)
1960
1970
1980
1990
2000
2010
Coase publishes two articles on tradeable permits (‘59-’60)
Crocker suggests using tradeable permits to regulate air pollution (’66)
Dales argues for emissions trading with a government imposed cap (‘68)
EPA predecessor studies emissions trading (’68-’69)
EPA experiments with ‘flexible regulations’ under the Clean Air Act throughout the 1970s
EPA initiates primitive emissions trading programme to phase out leaded petrol (’79-’87)
Montreal Protocol (’87)
Helsinki Protocol mandates uniform 30% SO2 emissions reductions (’85)
UNFCCC formed at Earth Summit (’92)
UK announces Climate Change Levy (’99)
UK ETS launched (’02)
RGGI launched (’09) EU carbon tax proposed (’91)
Kyoto Protocol (’97), and EU carbon tax proposal is formally withdrawn
US officially withdraws from Kyoto Protocol (’01)
Clean Air Act amended to include cap-and-trade programme for SO2 emissions (’90)
Acid Rain Program launched (’95)
EU ETS directive (’03) EU ETS launched (’05)
First commitment period of Kyoto Protocol and Phase 2 of EU ETS begin (’08)
Sec
tion 2.2
Sec
tion 2.3
Sec
tion 2.4
Coase, 1959, p. 29), but Crocker (1966) argued that a system of tradeable pollution permits
offered important advantages. Chiefly, it allowed the regulator to learn from the price signal
whether or not the regulations were effective. Dales (1968a,b), writing independently, argued
that although pollution taxes could in principle achieve the same outcome, it would be
incred-ibly difficult to set and continually adjust the tax to achieve the desired environmental quality.
A better alternative was to:
Let [the government]. . . issue x pollution rights and put them up for sale, simultaneously
passing a law that everyone who discharges one equivalent ton of waste. . . during a year
are that no person, or agency, has tosetthe price—it is set by the competition among buyers
and sellers of rights. . .
—Dales (1968a, p. 801)
Meanwhile, the growing modern environmental movement in the US was demanding stronger
environmental protections. The business community pushed back, arguing that environmental
regulations would inhibit economic growth (Voß, 2007). The work of Coase, Crocker, and Dales
could potentially offer an innovative solution that might appease both environmentalists and
businesses: caps on pollution would satisfy environmentalists, but trading provisions would
give industry flexibility to determine how to achieve the targets. This influence was apparent
when the US National Air Pollution Control Administration began studying emissions trading
in the late 1960s (Burton & Sanjour, 1968, 1969a,b).
When the Clean Air Act was adopted in 1970, the National Air Pollution Control
Adminis-tration, along with its curiosity about emissions trading, was absorbed into the new
Environ-mental Protection Agency (EPA), which was charged with monitoring and enforcing the new
National Ambient Air Quality Standards established by the Act. To enable construction of new
industrial facilities in areas where emissions were already high, the EPA created a new rule
that the firm would have to ‘offset’ the additional emissions with an even greater emissions
reduction elsewhere within the airshed (Gorman & Solomon, 2002). Offsetting was
eventu-ally codified in the 1977 amendments to the Clean Air Act. Of course, proving that you are
reducing emissions compared to what would have happened otherwise is not always an easy
task, as we will see again in later offsetting schemes, so in practice firms would generally close
down an old plant in order to build a new one.
The EPA continued to experiment with, and expand the use of, market-like pollution control
mechanisms under the Carter administration (Cook, 1988). Hoping to secure business
sup-port for emissions trading, new mechanisms were added to increase flexibility, assure market
liquidity, and reduce price volatility (Voß, 2007). These mechanisms saved some businesses
millions of dollars, and many of these mechanisms were used again when the EPA helped
phase-in new refining equipment and phase-out leaded petrol in the late 1970s and early
Environmental groups were not always pleased with the new flexible mechanisms,
how-ever. The EPA trading provisions faced repeated legal challenges from environmental interest
groups (Voß, 2007), but were ultimately upheld by the US Supreme Court in 1986 (Gorman &
Solomon, 2002).
With pollution regulation receiving more attention from policy makers, academic study of
market-based instruments intensified in the 1970s. Important contributions from Baumol &
Oates (1971, 1979), Montgomery (1972), Weitzman (1974), Roberts & Spence (1976), Adar &
Griffin (1976), and Yohe (1977) built up the theoretical foundations of emissions trading. When
Tietenberg (1985) later published a study evaluating the EPA’sde factoemissions trading
sys-tem, he helped highlight it as “a first instance of a new policy instrument in practice, a proof
of the principle that emission reduction obligations could be traded" (Voß, 2007, p. 334).
Tietenberg’s study was of further significance because it advanced the argument that emissions
trading provided efficient incentives for innovation and investment in new pollution control
technologies. This was quickly adopted as an argument in favour of emissions trading
(Down-ing & White, 1986), and within a few years it was considered one of the three key strengths of
emissions trading, alongside minimising short-term abatement costs and placing a relatively
low informational burden on the regulator (Malueg, 1989).
The EPA released a report in 1986 consolidating their new practices, already reviewed by
Ti-etenberg, and support for emissions trading soon spread beyond the EPA to groups like the
Environmental Defense Fund, an environmental advocacy group, and Project 88, a
nonparti-san initiative convened by US Senators Timothy Wirth and John Heinz to explore new
environ-mental policy solutions. The shift in attitude in the 1980s towards more flexible environenviron-mental
regulations was also greatly facilitated by the broader push for pro-market economic policies
under the Reagan administration (Bernstein, 2001). The EPA’s new emissions trading
mech-anisms were estimated to have saved a few big companies (Armco, DuPont, USX, and 3M)
between $5 billion and $12 billion (Stavins, 2003), but most businesses never took active part
and did not experience any notable cost reductions. At the time, this later failure was excused
by the fact the theoretical recommendations had not yet been systematically implemented
Throughout the 1970s and 1980s, evidence was accumulating that (1) sulphur dioxide
sions from the burning of coal and oil was causing water and soil acidification, and (2)
emis-sions of chlorofluorocarbons (CFCs) were depleting the ozone layer (Bolin, 2007). The
interna-tional community made “desulphurization of fossil fuels” one of the chief objectives of future
co-operation (see the Final Act of the Conference on Security and Co-operation of 1975), and
negotiated a voluntary international agreement in 1978 to reduce CFC emissions, followed by
the Vienna Convention in 1985 and the 1987 Montreal Protocol. The Montreal Protocol
es-tablished legally-binding CFC quotas, and a mechanism that permitted international trade of
these quotas.
European countries and the US responded very differently to these events. Though CFC
emissions quotas were very occasionally traded in Europe (Stavins, 2003), European nations
mostly directly regulated what technologies could and could not be used. Most of the trading
under the Montreal Protocol was carried out between US and Canadian plants of two major US
companies, DuPont and Dow Chemicals (Gorman & Solomon, 2002). Moreover, the Protocol
motivated the EPA to create a programme for the Protection of Stratospheric Ozone in 1988,
capping CFC emissions through a tradeable permit system (Tripp & Dudek, 1989).
The same pattern was visible in Europe’s and the US’ handling of sulphur emissions.
Eu-ropean nations agreed to uniformly reduce sulphur emissions by 30%. This was a prime
opportunity for letting countries trade their emissions quotas (Mäler, 1991), but such
provi-sions were conspicuously absent from the European approach. In the US, however, emisprovi-sions
trading had gained steam throughout the 1970s and 1980s. California passed their own
emis-sions trading legislation for nitrogen and sulphur dioxides in 1983, and various state level
trading programmes were operating in Colorado, Georgia, Illinois, Louisiana, and New York
(Stavins, 2003). This gradual change, combined with the apparent success of the ozone
protec-tion scheme, allowed President George H.W. Bush to amend the Clean Air Act in 1990, creating
2.3
The rise of carbon markets
2.3.1 The road to Kyoto
Throughout the 1970s and 1980s scientists repeatedly warned about global warming induced
by anthropogenic GHG emissions, and economists began warning of the potential economic
consequences (Nordhaus, 1974, 1977a,b, 1979). In 1988, a hot summer and crop failure in
the US sparked a wider political discussions about global warming. NASA scientist James
Hansen’s testimony before the US Congress echoed around the world: “Global warming has
begun" (Fleming, 1998; Bolin, 2007). The World Conference on the Changing Atmosphere
held that same year called for a 20% reduction in carbon dioxide emissions by 2005. The
Intergovernmental Panel on Climate Change (IPCC) was created and charged with conducting
a comprehensive scientific assessment of the causes and consequences of global warming.
Putting the problem of climate change together with the theory of emissions trading, Stavins
(1988), writing for Project 88, recommended creating a global carbon market to manage GHG
emissions. An increasing number of economists now favoured a global carbon market (Swisher
& Masters, 1989; Dudek & LeBanc, 1990), saying that it was actually feasible to implement
(Victor, 1991), and moreover, that it was the only proposal that could realistically bring the
international community together to successfully curb GHG emissions (Grubb, 1989).
The 1992 UN Earth Summit in Rio de Janeiro resulted in the Framework Convention on
Cli-mate Change (UNFCCC). It declared a “concern that human activities have been substantially
increasing the atmospheric concentrations of greenhouse gases. . . and may adversely affect
natural ecosystems and humankind", but strong US fossil fuel interests persuaded the US to
oppose mandatory abatement targets (Meckling, 2011). No binding targets made it into the
agreement. Still, the Convention demanded that “policies and measures to deal with climate
change should be cost-effective so as to ensure global benefits at the lowest possible cost". This
was a clarion call for economists.
Many economists turned their attention to the questions of formulating an international treaty
and designing an international carbon market.1 The IPCC concluded that “for a global treaty,
a tradeable quota system is the only potentially cost-effective arrangement where an agreed
level of emissions is attained with certainty" (IPCC, 1996, p. 401).
The US had pioneered emissions trading, but US industry now stood united in opposition
to any form of carbon controls. However, at the first Conference of the Parties (COP 1) to
the UNFCCC in Berlin in 1995, the two European oil giants BP and Shell began to soften
their stance for fear of damaging their public image (Meckling, 2011). Perhaps because of
this, COP 1 managed to set a two-year deadline before countries had to agree on mandatory
GHG emissions targets, something industry had prevented at the Earth Summit. A pilot
programme was also launched—Activities Implemented Jointly (AIJ)—to learn more about
how an international carbon offset market might work in practice. Unfortunately, it seems the
AIJ did not result in any emissions reductions that would not have happened anyway, and
moreover, the verification process was prohibitively difficult (Schwarze, 2000).
But the US Acid Rain Program, signed into law in 1990, came at a pivotal time. It was launched
in 1995, and its widely publicised success overshadowed the smaller AIJ. Sulphur emissions
were substantially reduced (Schmalensee et al., 1998), and these emissions reductions were
es-timated to have cost businesses $1 billion less per year than they would have under
command-and-control regulations (Stavins, 2003). The benefits of the Program appeared to have far
outweighed the costs (Burtraw et al., 1998).
The Acid Rain Program launched to great acclaim, and a few major US companies now
de-fected from the anti-regulation camp to join the cause of the pro-market Environmental
De-fense Fund. These businesses wanted to ensure that emissions trading would be the policy of
choice, should governments ultimately agree to binding carbon reduction commitments. Their
message fell on receptive ears in the Clinton administration, and the new business-NGO
coali-tion sidelined both the old opposicoali-tion to carbon controls from business and the opposicoali-tion
to emissions trading from environmental groups (Meckling, 2011). At COP 2 in 1996, the US
announced it now favoured binding commitments as long as a new international agreement
included provisions for global carbon trading.
The US was one of the few countries with practical experience of emissions trading, and led
an alliance of nations supporting the proposal for an international carbon market (Stowell,
2005). The EU favoured uniform binding commitments of 15% emissions reductions but
op-posed a market, a position reminiscent of the European sulphur emissions treaty. The new
business-NGO coalition lobbied for carbon trading, with BP even announcing in May of 1997
a partnership with the Environmental Defense Fund to set up its own internal carbon trading
scheme. In June 1997 the EU conceded that its opposition to a carbon market should not be
allowed to undermine the objective of achieving binding emissions targets, and at COP 3 held
in Kyoto in that December, BP and the Environmental Defense Fund lobbied the European
delegates to accept the US proposal. The US and EU eventually reached an agreement in the
form of the Kyoto Protocol, which included both binding commitments and a carbon market,
though the details of the market would be left for COP 4 to determine. The US also demanded
targets for developing countries, but the G-77 and China opposed this proposal. A
compro-mise was finally reached in the form of the Clean Development Mechanism (CDM), a carbon
crediting mechanism similar to the AIJ (Meckling, 2011). The carbon market provisions in the
Kyoto Protocol would go into effect in 2008.
2.3.2 Emissions Trading in Europe
In Europe, the years leading up to the Kyoto Protocol had seen the failure of a proposal to
establish an EU-wide carbon tax. The European Commission had proposed such a tax in the
early 1990s, but was forced to withdraw the proposal in the face of overwhelming opposition
from business and from several member states. The EU had also failed to keep emissions
trading out of the Kyoto Protocol.
COP 4 did not finalise rules for the international carbon market after all, but instead agreed
that this should be accomplished by the year 2000. The carbon market lobby took this
op-portunity to coalesce and intensify their efforts. BP launched its internal trading scheme in
September 1998, with the self-imposed target of reducing its GHG emissions by 10% by 2010
(a target they expected to achieve by reducing waste, at virtually no cost). A trade association
for the carbon industry, the International Emissions Trading Association (IETA), was formed
aca-demics, practitioners, and policy makers to discuss carbon markets (Ellerman et al., 2010).
Shell launched its own trading scheme in January 2000, and Alcoa, Motorola, and Waste
Man-agement followed suit (Hoffman, 2005).
When the UK government announced its Climate Change Levy in March 1999, a group of
thirty organisations (mostly large businesses) formed the UK Emissions Trading Group. Their
immediate objective was to persuade the government to adopt an emissions trading scheme
instead of the new tax, and their broader aim was to influence future EU regulations in favour
of carbon trading. The message was well-received by the new Labour government, which
wanted to make London the financial hub of the new market should the EU be swayed toward
emissions trading (Meckling, 2011). The UK Emissions Trading Scheme was finally launched
in 2002 as a supplementary policy to the Levy, but few firms participated, most easily met
or even overshot their emissions abatement targets, and ultimately the scheme appears rather
to have subsidised a handful of firms to undertake voluntary emissions reductions (Smith &
Swierzbinski, 2007). By way of contrast, the Climate Change Levy does appear to have induced
firms paying the full rate to reduce energy use by 10% and increase patenting for low-carbon
technologies without compromising firms’ economic performance (Martin et al., 2009; Martin
& Wagner, 2009), while simultaneously raising more than £800 million of revenue a year for
the British government (Cambridge Econometrics et al., 2005). Yet somehow seeing a
real-life carbon market in the UK seems to have had a greater impact on the rest of Europe than
seeing the market’s actual performance. The apparent success of the US Acid Rain Program,
moreover, seemed to offer compelling evidence that emissions trading could work in practice,
even if the small-scale carbon market experiments so far had had less success.
No agreement was reached on the rules for the international carbon market until COP 7 in
2001. The Japanese delegation in particular opposed giving the UN the power to take action
against a country that did not meet its emissions targets (Convery, 2009). It was becoming
clear that, since the EU wanted strong enforcement, they would need to create a European
scheme with the European Court of Justice as its enforcer. An EU carbon market might also
have helped convince the US to ratify the Protocol. The US officially abandoned the Kyoto
(Meckling, 2011).
The EU had been dealt one blow after another: the failure of an EU carbon tax, the failure to
first keep emissions trading out of the Kyoto Protocol, the failure to underpin the international
carbon market with credible enforcement mechanisms, and finally the US withdrawal from
the Kyoto Protocol. The European Commission had first announced its support for emissions
trading in 1998, but only after this series of events, played out against a backdrop of sustained
lobbying, could the most ardent opponents of a European carbon market finally be persuaded.
Germany only declared its support for emissions trading in December 2002 (Meckling, 2011).
The directive to establish the EU Emissions Trading Scheme (EU ETS) was adopted in July
2003, and the new European carbon market launched in January 2005. Early movers like BP
and Shell had acquired substantial experience of carbon trading, and they had considerable
influence on the design of the EU ETS (Hoffman, 2005).
2.3.3 Carbon markets around the world
Ever since the US withdrawal from the Kyoto Protocol in 2001, US companies and states have
been working to get emissions trading back on the agenda. The Chicago Climate Exchange
(CCX) ran from 2003 to 2010, a trading platform that encouraged businesses to voluntarily
make legally binding commitments to cut their emissions. The Regional Greenhouse Gas
Initiative (RGGI) launched in 2009, capping electricity sector emissions in 10 Northeastern US
states.2 California launched its long anticipated carbon market in 2013. Elsewhere in North America, the Canadian province of Quebec has recently launched a new cap-and-trade scheme
as well.
In 2008 New Zealand launched its own emissions trading scheme (NZ ETS). The programme
expanded in 2010 to cover additional economic sectors, and is scheduled to expand further to
become a nearly economy-wide programme by 2015.
There are several more carbon markets just coming over the horizon. The initial voluntary
phase of the Swiss programme has recently ended, and as of January 2013 it has been
tory for Swiss energy-intensive industries to participate in the country’s carbon market.
Aus-tralia’s Carbon Pricing Mechanism, currently operating with a fixed price, is due to become
a fully flexible emissions trading programme in 2015. In January 2013 Kazakhstan officially
initiated a one-year pilot phase of its new national carbon market. Japan, South Korea, Brazil,
Mexico, and Turkey have all adopted legislation laying the foundation for their own carbon
markets as well, and efforts to develop emissions trading schemes are under way in most of
these countries. Perhaps most significantly, two of China’s seven planned provincial carbon
markets are due to launch later in 2013. The planned market will be the world’s second largest
after the EU ETS, and is expected to expand into a national programme by 2015-2016 (Scotney
et al., 2012).
The future of a strong international environmental agreement may look bleak at present—COP
17 in December 2011 resulted in an agreement to renew the Kyoto Protocol for a second
com-mitment period, but there remains a substantial gap between pledged emissions reductions
and how much is needed to avoid temperature increases in excess of 2◦C. It is still possible
that a global carbon market will emerge by joining together national and regional markets.
Quebec and California have announced their intentions to link their markets. The EU and
Australia have also announced plans to establish a link between their carbon markets from
2015. Though the economic and legal issues involved in linking markets are complex (Jaffe
et al., 2009), pro-market lobbying efforts now appear to see this as a more credible route to a
global market (Meckling, 2011).
2.4
Carbon markets in action
International carbon markets have been operating in earnest since 2005, when the EU ETS
launched and the CDM rules came into force. There are a growing number of carbon market
initiatives around the globe, but only EU ETS and the Kyoto mechanisms have been subjected
to systematic scrutiny so far (see, for instance, Hepburn, 2007, for an early review). This
section considers these experiences, and in particular I try (both in this section and the next) to
discuss preliminary assessments of RGGI and NZ ETS.
2.4.1 The EU Emissions Trading Scheme
The EU ETS covers roughly 12,000 industrial and power installations and nearly half of the
EU’s GHG emissions. It launched in 2005 and now accounts for nearly 85% of world carbon
trading (Kossoy & Guigon, 2012).
Nearly 6.5 billion tonnes-worth of allowances were allocated in Phase 1 (2005–2007). In 2006
it became apparent that there was a surplus of allowances, however, and their price collapsed.
It seems the emissions cap was too generous, and the price collapse has consequently been
widely interpreted as evidence that no emissions reductions took place. However, thee10–
e30 allowance price through 2006 and the continued positive price of 2008 futures could have
induced firms to cut emissions. Indeed, official numbers show that EU ETS installations in
aggregate have cut emissions by roughly 8% in absolute terms between 2005–2010 (European
Commission, 2011), though this does not account for factors like rising fuel prices and the
recession. When these things are accounted for, Phase 1 emissions are estimated to have been
only about 3% lower than they would have been without the EU ETS (Ellerman & Buchner,
2008; Ellerman et al., 2010; Anderson & Di Maria, 2011). Nevertheless, it is a real challenge
to predict what EU ETS installations would have done in the absence of the EU ETS so there
is considerable uncertainty around these estimates, and they should be interpreted knowing
that total emissions often jumped±5% year-on-year in 1990–2004. When EU ETS installations
are instead compared directly to similar installations that were not covered by the EU ETS,
although this has so far only been done for a very limited number of installations, even the
modest 3% reduction vanishes (Jaraite & Maria, 2011). Most of the 8% reduction identified
by the European Commission came during Phase 2 rather than Phase 1, but perhaps as much
as a third of these reductions appear to be due to the 2008 recession (New Energy Finance,
2009). Estimates that account for macroeconomic conditions in Phase 2 attribute emissions
reductions of about 3% to the EU ETS (Zachmann et al., 2011; Egenhofer et al., 2011), though
alternative estimates suggest this number may be on the high side (Cooper, 2010; Kettner et al.,
installations have cut emissions, perhaps even in part because of the EU ETS.
A key objective in Phase 1 was to “establish the infrastructure and institutions and to gain
the experience to make the subsequent, ‘real’, period a success” (Ellerman et al., 2010, p. 36).
Indeed, there are some signs of institutional learning. For instance, the historical emissions
data needed to set caps for each installation often was not available before the start of Phase
1, and regulators were forced to rely on largely unverified voluntary submissions from
instal-lation owners (Ellerman, 2007). Naturally, firms had an incentive to exaggerate their historical
emissions in order to receive more generous allocations. Moreover, disagreements between the
European Commission and member states meant that the total number of allowances was not
finalised until well into Phase 1. In contrast, the data collection and the process for allocating
Phase 2 and 3 allowances was much more orderly (Ellerman et al., 2010). Having said that,
since Phase 2 and 3 have now been found to be over-allocated as well, European policy makers
are trying to intervene and modify the emissions cap. At the time of writing, a contentious
plan to temporarily withhold some of the previously authorised allowances for Phase 3 has
just been rejected, and the price of allowances has crashed to historic lows.
Practically all of the allowances so far have been given to companies for free in accordance
with historical emissions (‘grandfathering’), rather than sold at auction. Consultations with
business had convinced the European Commission that grandfathering was necessary to gain
industry support (Skjaerseth & Wettestad, 2008), despite some arguing that this would
ad-versely affect private-sector investment (Neuhoff et al., 2006a,c) and though economic analyses
of the EU ETS have shown that greater auctioning need not have had the harmful competitive
effects feared by industry (Hepburn et al., 2006). Although firms have been given allowances
for free, they have raised their prices (and profits) in some countries. It was estimated that
UK power companies would earn an additional £800 million (e930 billion) per year in Phase
1 (IPA Energy Consulting, 2005), and power companies in Belgium, France, Germany, and the
Netherlands earned betweene4.5 billion ande13.5 billion in windfall profits in a
‘representa-tive’ year (Sijm et al., 2006). Several studies also show that even industrial sectors of the
econ-omy are marking up their prices and earning windfall profits (Bruyn et al., 2010; Oberndorfer
steel, and cement companies) are making e4.1 billion in profits from the EU ETS in Phase 2
(Sandbag, 2011). It is worth noting that this effect of grandfathering was understood before the
EU ETS directive was adopted (Burtraw et al., 2002), and was expected (Martinez & Neuhoff,
2005; Smale et al., 2006). It is by no means unprecedented, however, that a few big firms make
profits from emissions trading schemes (as with the EPA’s early trading provisions and the
UK ETS). Not only is it questionable whether the free allocation of permits conforms to the
EU’s commitment that polluters should bear the cost of their emissions, as well as EU and
international rules about state aid, but to the extent that shareholders are wealthier than the
average citizen, windfall profits may also have a regressive redistributive impact. A greater
share of allowances will be auctioned in Phase 3—perhaps a sign of learning among policy
makers—though compelling evidence suggests that a far greater share still could be auctioned
without adversely affecting competitiveness (Martin et al., 2012a).
Industry is learning as well. The institutional awareness of firms is growing, especially among
large polluters (Hervé-Mignucci, 2011), and allowances have tended to flow from installations
with surplus to those with deficits (Ellerman et al., 2010). There are clear limits nevertheless.
Despite a surplus of 267 million allowances and a near-zero allowance price at the end of Phase
1 (Ellerman et al., 2010), a number of installations still operated without sufficient allowances,
resulting in overe3 million in fines (over 75,000 tonnes of emissions at e40 per tonne)
(Eu-ropean Environment Agency, 2008). It also appears that, as with preceding emissions trading
schemes, most regulated firms are passive participants (Martin et al., 2011).
The EU ETS has also aimed to encourage low-carbon innovation and investment. Many have
expressed scepticism (Schleich & Betz, 2005; Grubb et al., 2005; Schleich et al., 2009), and the
price collapse in Phase 1, as well as the low current price, could very well have undermined
the signal to investors. Claims in the literature range from the EU ETS having a strong impact
on innovation (Petsonk & Cozijnsen, 2007) to it having no impact at all (Aghion et al., 2009).
More systematic studies detect a small positive impact of the EU ETS on innovation
(Mar-tin et al., 2011; Anderson & Di Maria, 2011), primarily operational and process innovations.
When it comes to investment, anecdotal evidence suggests that the EU ETS is having a small
evidence that takes greater pains to establish a credible counterfactual throws some doubt on
these conclusions (Löfgren et al., 2013). One should also consider the fact that a large part of
abatement thus far appears to have come from switching between coal and gas in the power
sector (Ellerman & Buchner, 2008; Delarue et al., 2008, 2010), a cheap way to reduce emissions
that requires neither innovation nor investment.
In sum, the evidence suggests the EU ETS is responsible for a small reduction in emissions.
The evidence is weaker on its impact on investment and innovation, but provides reasons to
be conservative. On the basic question of whether the EU ETS has managed to “establish the
infrastructure” and “gain the experience” to make carbon trading a success, one can point
to such things as the gradual movement toward more auctioning of allowances. On the other
hand, revelations of crime, regulatory incompetence, and outright corruption in the EU ETS do
call into question whether to this day such an infrastructure exists (Transparency International,
2011). It is perhaps safest to conclude that, while European policy makers are slowly learning
about the potential and pitfalls of emissions trading, the lessons of the EU ETS are hard won.
2.4.2 The Kyoto mechanisms
The first commitment period of the Kyoto Protocol coincided with Phase 2 of the EU ETS (2008–
2012). The Kyoto mechanisms include Emissions Trading (ET), a government-to-government
cap-and-trade mechanism based on the same ideas as the quota trading provisions of the
Montreal Protocol, as well as Joint Implementation (JI) and the Clean Development Mechanism
(CDM), two offset mechanisms that allows emissions reductions from projects in uncapped
counties to be converted into new allowances that can be sold to help to capped countries
achieve their targets. The lion’s share of activity under the Protocol comes from the CDM, and
for the most part the new carbon credits are sold to help European firms comply with the EU
ETS.
As with the AIJ before it, it has been difficult and costly to verify that individual projects
ac-tually lead to emissions reductions compared to what would have happened otherwise. Many
have questioned whether the CDM actually reduces emissions (Michaelowa & Purohit, 2007),
some activities (Schneider, 2011). In some instances, the CDM has furnished emitters with
large financial windfalls (Wara, 2007a,b; Elsworth & Worthington, 2010; Sandbag, 2011). These
concerns are compounded by reports showing undeclared conflicts of interest among members
of the Executive Board (Transparency International, 2011), and revelations that project
devel-opers routinely prepare a separate balance sheet showing the non-viability of a project without
CDM benefits to obtain credits, despite having already submitted a balance sheet showing the
viability of the project without CDM credits when securing funding from the bank (Consulate
Mumbai, 2008).
The CDM was also meant to encourage development of low-carbon technology and
infras-tructure in developing countries, but most of the credits issued historically are actually for the
destruction of industrial gases (chiefly HFC-23), which have high global warming potential
(so they are worth a lot of credits) but are cheap and easy to destroy with existing
technolo-gies. The CDM’s contribution to sustainable development appears to have been modest at best
(Olsen, 2007).
Like in the EU ETS and earlier programmes, emissions reductions in the CDM are largely
coming from cheap and easy fixes that require neither innovation nor much investment, but
ultimately have very limited potential for greater emissions reductions in the longer term.
Since the specific problem concerning HFC-23 came to light, no new projects of this kind have
been approved, and other abatement projects now form a growing part of the CDM portfolio.
2.4.3 Preliminary assessment of New Zealand Emissions Trading Scheme and RGGI
The NZ ETS was launched in 2008. Though it is still in its transitional phase, an
indepen-dent review published in September 2011 noted that the programme so far “had not had a
significant impact on investment decisions and competitiveness. . . had not yet incentivised
be-havioural changes nor had it resulted in significant reductions in domestic emissions. . . [and]
is unlikely to have had such a marked effect on costs that [businesses] have had to reduce their
energy consumption or emissions" (Emissions Trading Scheme Review Panel, 2011, pp. 17–18).
RGGI launched in 2009. One important feature of RGGI is that all allowances are sold at
eager to highlight that over $600 million of the revenues raised (roughly 75%) have been
in-vested in improving energy efficiency, deploying renewable energy technologies, and assisting
low-income households with paying high energy bills (RGGI Inc., 2011). RGGI does appear to
have had, on balance, a positive economic impact so far (Hibbard et al., 2011), but it is still
un-clear whether or not it has reduced GHG emissions. The statutory programme review recently
confirmed initial suspicions (Daley, 2008) that there has been “a significant excess supply of
allowances relative to actual emission levels” (RGGI Inc., 2013a), which was soon followed by
a proposal to slash the emissions cap by 45% (RGGI Inc., 2013b).
2.5
Lessons
The history of carbon markets is a great political success story. Early emissions trading
schemes in the US provided compromise solutions that created internal divisions within
in-terest groups, and thereby helped pacify opposition from both business and environmental
groups. Emissions trading fractured business opposition to an international climate change
treaty with binding emissions targets, helping to bridge the gap between European and US
demands at the negotiations in Kyoto, as well as between developed and developing
coun-tries. Emissions trading allowed the EU to forge a unified climate policy after attempts to
implement a carbon tax had failed. However, the same history also reveals precedents for
many of the current problems with carbon markets. Let us consider here a few of the key
lessons one might learn from piecing together this history.
2.5.1 Participation
Early evaluations of the US emissions trading provisions noted that the benefits from trading
were heavily c