Response of STEM Students to Academic Writing Sessions: A Case Study
Chinny Nzekwe-Excel
1Ellen Pope
1Abstract
Despite the many advantages associated with academic writing, there are, traditionally, limited opportunities to develop academic writing at undergraduate level within STEM subjects such as mathematics. Thus, it has become necessary to deliver academic writing sessions in such a way that STEM students constantly see the relevance of academic writing sessions to their learning and career prospects. This paper, through a case study explores a compulsory academic writing module within the first-year of an undergraduate degree programme for mathematics students, which was delivered collaboratively by a learning developer and an academic lecturer. The case provides insights on how first-year mathematics students respond to academic writing sessions, and the association between their attendances to the writing sessions delivered using different teaching methods and their achievement.
Key Words:
Academic Writing, Lecture, Student achievement, Tutorial1. Introduction
Academic writing is an essential component of higher level study, especially as many disciplines still place great emphasis on writing as a primary medium for assessment. Learning to write well requires appropriate guidance and providing students with the time, space, and opportunity to develop their confidence and abilities. However, within STEM2 subjects, for example mathematics, there are limited opportunities to develop academic writing at undergraduate level (Vivaldi, 2011), despite the many advantages that good writing offers for learning, such as developing critical thinking, improving problem solving, and deepening learning to move beyond memorisation (Johnson, 1983; Southwell, 1993, cited in Taylor & McDonald, 2007; Author, 2011).
Furthermore, developing the academic writing ability of mathematics students has not attracted as much interest as enhancing their mathematical ability in institutions of higher learning (see Marr & Grove, 2010; Author, 2010). This is probably because some mathematicians do not see the relevance of excellence in writing (Vivaldi, 2003) and mathematics students are not usually encouraged to engage in meaningful writing tasks (Johnson, 1983; Author, 2010).
However, there has been a growing focus on student preparedness for Higher Education study, with particular emphasis on supporting student transition and the importance of integrated and embedded academic writing development (Hartley, Hilsdon, Keenan, Sinfield, & Verity, 2011; Author 2013). In the last five years there has been increasing interest on writing for STEM students shown by recent events focussed on this subject area (example HEA STEM, 2012).
1
Learning Development, Centre for Learning Innovation and Professional Practice, Aston University, Aston Triangle, Birmingham, B4 7ET, United Kingdom
2
2. Study Context and Structure
This case study is based on an academic writing module in Aston University, UK. The module, titled Communications Skills and Academic Writing (CSAW) is focused on enabling collaboration between academic lecturers and learning development advisors in its design and delivery. The module also entails enabling undergraduate mathematics students to express ideas in writing rather than memorisation. Thus, the module was designed to improve the students’ self-awareness and confidence in writing, their critical thinking ability as well as enable progression in their learning process.
The teaching structure of the module involved a combination of two teaching methods (lectures and tutorials). Each lecture and tutorial lasted 60mins. In addition, the format of the module involved two written assignments and an exam.
3. Implementation and Delivery
The module delivery was carried out over an eleven-week teaching period. A total of 75 students were originally enrolled onto the module; however for the purpose of this study, 71 students were used because three students withdrew from the university while 1 student had the CSAW module removed from their list of modules. The 71 students were expected to attend a total of 15 lectures and 9 tutorials. The lectures, which covered topics around features of academic writing (table 2), were delivered over the eleven-week period and were delivered by an academic lecturer; the tutorials were managed & facilitated by the academic lecturer and a learning developer. The tutorials were designed to buttress the lectures, to provide a more interactive atmosphere for the students, and to promote student engagement. The tutorials required the 71 students to be split into two groups: 36 in Group 1 and 35 in Group 2. Thus, while the academic lecturer taught Group 1 at a given time, the learning developer taught Group 2 at the same time. Consequently, in the following week, while the lecturer taught Group 2, the learning developer taught Group 1. Table 1 shows details of topics covered for the tutorials and how they were delivered over ten weeks, which fell within the eleven-week lecture teaching period.
Table 1: Topics Vovered for the Academic Writing Tutorials
Tutorial Session No
Title of Tutorial Session Tutorial Groups/ Week session was delivered Group 1 Group 2
1 Orientation to Learning in Higher Education Week 1 Week 2
2 Learning Process at University Week 2 Week 1
3 Approaches to Learning: Place of Memorisation and becoming a Critical Learner
Week 3 Week 4
4 Referencing and Plagiarism Week 4 Week 3
5 Critical Reading & Note-making Strategies Week 5 Week 6
6 Dos and Don’ts of Presentation Week 6 Week 5
7 Working effectively in a group Week 7 Week 8
8 Review & Preparation for assessed individual presentations Week 8 Week 7
9 Revision & Exams Strategies Week 9 Week 10
3.1 Method of Assessment
3.1.1 Assessment 1
The first assignment required the students to submit an essay on the nature of plagiarism and collusion and to evaluate ways in which both can be avoided and detected. The students were given the essay assignment at the start of the module and were expected to submit it in the sixth teaching week.
3.1.2 Assessment 2
Assessment2 was a report writing assignment to analyse different career possibilities, and to subsequently provide recommendations on the most attractive career option. The students were expected to submit the report after the module teaching sessions.
3.1.3 Assessment 3
Assessment3 was an oral presentation exam, which took place at the end of the teaching sessions.
4. Evaluations and Discussions
The evaluation process used in this case was carried out from three perspectives:
students’ response or attendance to the lectures and tutorials
students’ achievement (percentage grade achieved) in the three assessment modes students’ achievement with respect to attendance to the lectures and tutorials
4.1 Students’ Attendance to Lectures
Table 2 provides details on the number of students who attended the 15 lectures delivered by the academic lecturer.
Table 2: Frequency of Student Attendance to Lecture Teaching Sessions
Session number
Focus of session Frequency of Attendance
Percentage Attendance(%)
1 Introduction to Module and assessment at university 63 89
2 Stages in the writing process and interpreting assignments
58 82
3 Planning paragraphs 54 76
4 Referencing and selecting suitable sources of information
60 85
5 Plagiarism and its consequences 42 59
6 Use of quotations (direct and indirect) 51 72
7 How to cite sources 48 68
8 Formality and caution of academic style 36 51
9 Drop-in sessions for essay assignment 50 70
10 Structure of paragraph and Topic sentences 41 58
11 Introductory and concluding paragraphs 40 56
12 Use of graphics in academic writing 39 55
13 Difference between essays and reports 42 59
14 Key features and sections of report 46 65
An exploration of students’ attendance to the lectures (table 2) shows that the ‘introduction to module and assessment at university’ lecture recorded the highest number in student attendance (63students), probably because it was the first lecture and it discussed assessment. The students had an average attendance rate of 77% for the first 6 lectures. However, the students recorded low attendances for the last 6 lectures (average attendance rate of 56%). This may have been as a result of commitments from other modules and assignments. The ninth lecture designed as a drop-in session for the essay assignment recorded a reasonable and high attendance rate (70%). It is not clear as to whether the students were selective in attending the 15 different lectures.
4.2 Students’ Response to Tutorials
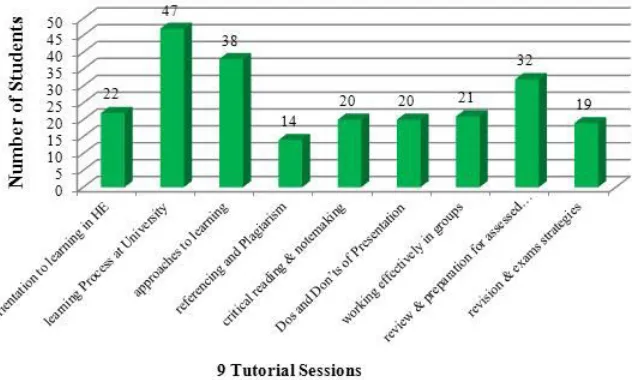
The students’ response and attendance to the tutorials was sporadic as shown in figure 1. This suggests that the attendance rate did not show a steady increase or decrease over the ten-week period.
Figure 1: Frequency of Attendance to Tutorials
Figure 1 indicates ‘learning process at university’ as the most attended tutorial indicated by the highest attendance (47 students) while ‘referencing & plagiarism’ was the least attended tutorial (14 students). It is not surprising that the highest percentage of students (66%) attended the tutorial on ‘learning process at university’ considering that this category of students (first-year students) may still be managing the transition to learning in a University environment. It is also not surprising that a reasonable number of students attended the tutorials on ‘approaches to learning: place of a critical learner’ and ‘review & preparation of assessed...’(38 and 32 students respectively). Students tend to show interest on sessions that discuss learning approaches and assessment (Kuh, 2003; Race & Pickford, 2007). This can also be seen in the student high attendance to the first lecture on ‘….assessment’ (table2).
Very few students (20students) attended the tutorials on ‘critical reading & note-making strategies’ and ‘dos and don’ts of presentation’. The reasons for this are unclear, but could be because these two tutorials were conducted in the week when the students had tests for other modules.
4.3 Students’ Attendance and Achievement
Exploring the students’ achievement (percentage grade achieved) show some measure of increase in the students’ achievement on the first assessment (essay) making reference to the total number of lectures or tutorials attended (tables 3 and 4) by the students irrespective of the specific lecture or tutorial. All the lectures/ tutorials were focussed on different approaches to learning and academic writing conventions within Higher Education. At the time of submission of the essay, the students had attended a total of 10 lectures and 5 tutorials.
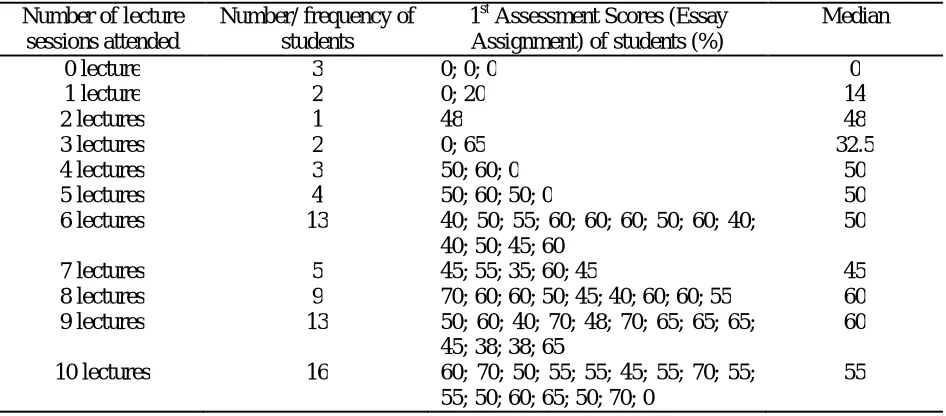
The statistics on tables 3a and 3b show the number of students who attended certain numbers of lectures and tutorials respectively.
Table 3: Students’ Achievement and Number of Lectures and Tutorials Attended
Table 3a: Students’ Achievement and Number of Lectures Attended
Number of lecture sessions attended
Number/ frequency of students
1st Assessment Scores (Essay Assignment) of students (%)
Median
0 lecture 3 0; 0; 0 0
1 lecture 2 0; 20 14
2 lectures 1 48 48
3 lectures 2 0; 65 32.5
4 lectures 3 50; 60; 0 50
5 lectures 4 50; 60; 50; 0 50
6 lectures 13 40; 50; 55; 60; 60; 60; 50; 60; 40; 40; 50; 45; 60
50
7 lectures 5 45; 55; 35; 60; 45 45
8 lectures 9 70; 60; 60; 50; 45; 40; 60; 60; 55 60 9 lectures 13 50; 60; 40; 70; 48; 70; 65; 65; 65;
45; 38; 38; 65
60
10 lectures 16 60; 70; 50; 55; 55; 45; 55; 70; 55; 55; 50; 60; 65; 50; 70; 0
55
Table 3b: Students’ Achievement and Number of Tutorials Attended
Number of tutorials attended
Number/ frequency of students
1st Assessment Scores (Essay Assignment) of students (%)
Median
0 tutorial 12 0; 0; 48; 0; 0; 38; 65; 0; 0; 40; 45; 20
10
1 tutorial 23 50; 40; 40; 45; 50; 50; 55; 45; 60; 60; 35; 60; 60; 55; 45; 45; 50; 40; 40; 60; 45; 0; 0
45
2 tutorials 10 60; 60; 65; 65; 38; 50; 60; 50; 60; 65
60
3 tutorials 13 70; 48; 70; 55; 60; 60; 55; 55; 55; 50; 55; 60; 70
55
4 tutorials 7 60; 50; 55; 70; 50; 70; 50 55 5 tutorials 6 50; 60; 70; 65; 65; 65 55
Mean achievement are not computed for number of tutorials attended because 7 students did not submit the essay so were given an essay score of 0%
On average and in general the students’ achievement with respect to their attendances to lectures (table 3a) and tutorials (table 3b) show a better performance or achievement for more attendances to lectures/ tutorials in comparison to lesser attendances to lectures/ tutorials. For example there were better performances for students who attended a total of 3-5tutorials in comparison to the students who attended a total of 2tutorials or less. Specifically all the students who attended a total of 3-5tutorials achieved a pass (40% and above).
The findings show that several students (8) achieved 0% in the essay assessment. However, 7 out of the 8 students who achieved 0% failed to submit the essay assessment so were given a 0% score. Therefore, as can be seen on tables 3a and 3b, the Mean achievements are not computed for lecture and tutorial-attendance categories as doing so may not provide genuine mean values. Consequently, the median values are computed for each lecture and tutorial attendance category. On average, higher-attendance categories show higher median values in comparison to lower-higher-attendance categories with respect to the lectures and tutorials. Example, the results show higher median values for total lecture-attendances of 8, 9, 10 in comparison to total lecture-lecture-attendances of 1, 2, 3. It is not surprising that the eight students who achieved 0% (either rightfully or as a result of non-submission) had corresponding low tutorial attendances (six had zero attendance while two attended only 1 tutorial). The one student who rightfully achieved 0% in the essay attended 1 lecture and no (zero) tutorial. In addition, all three students who did not attend any lecture (zero lecture-attendance) failed to submit the essay (and were given a zero score).
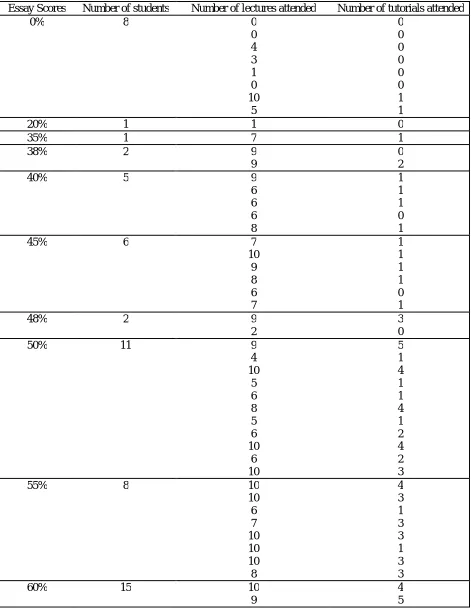
Table 4: Comparison between Students’ Attendances to Lectures and Tutorials
Essay Scores Number of students Number of lectures attended Number of tutorials attended
0% 8 0
0 4 3 1 0 10 5 0 0 0 0 0 0 1 1
20% 1 1 0
35% 1 7 1
38% 2 9
9
0 2
40% 5 9
6 6 6 8 1 1 1 0 1
45% 6 7
10 9 8 6 7 1 1 1 1 0 1
48% 2 9
2
3 0
50% 11 9
4 10 5 6 8 5 6 10 6 10 5 1 4 1 1 4 1 2 4 2 3
55% 8 10
10 6 7 10 10 10 8 4 3 1 3 3 1 3 3
60% 15 10
9
5 8 8 6 4 6 6 7 6 8 10
8 6
2 3 2 3 1 1 1 1 2 2 5 1 3
65% 6 9
9 9 3 9 10
5 2 2 0 5 2
70% 6 10
9 9 8 10 10
3 5 4 3 4 3
Data in Table 4 is based on Essay Assessment when students should have attended a total of 10 lectures and 5 tutorials
4.4 Measure of Significance
In view of the above analyses and findings on the students’ achievement and number of lectures & tutorials attended, a measurement of significance was carried out to identify whether there is an association between lecture attendance, tutorial attendance and student achievement using chi-square statistic. Chi-square is a statistical procedure used to measure whether a relationship or association exists between two or more categorical variables. Therefore, chi-square is employed to evaluate the hypothesis of an association between students’ achievement and their attendance to lectures and tutorials. The chi-square analysis is carried out on the students’ achievement in the report assessment and final grade in the module (exam). The total number of lectures and tutorials delivered at the time of submission of report assignment and exam assessment were 15 and 9 respectively.
Table 5: Cross Tabulation between Student Achievement and Lecture & Tutorial Attendances
Lecture and Tutorial Attendance Low
attendance (lecture)
High attendance
(lecture)
Low attendance
(tutorial)
High attendance
(tutorial)
Total
S
tude
nt
A
chi
eve
m
ent
Below 50% achievement (Report
Assessment)
9 16 20 5 50
50% & Above achievement (Report
Assessment)
9 32 22 19 82
Below 50% achievement (Exam)
11 14 21 4 50
50% & Above achievement (Exam)
8 33 21 20 82
Total 37 95 84 48 264
The data in table 5 indicate that on average students with ‘high’ attendance for both lecture and tutorial had more of an achievement of ‘50% & above’ in both report assessment and exams. Similarly, students with ‘low’ attendance for lecture had more of an achievement of ‘below 50%’ in the exams. For instance, with respect to the report assessment, out of the 48 students with ‘high’ lecture attendance, 32 had ‘50% & above’ achievement. Similarly, out of the 24 students with ‘high’ tutorial attendance, 19 achieved ‘50% & above’ in the report assessment. With respect to exams, out of the 47 students who attended 8 or more lectures, 33 had an achievement of ‘50% & above’. Similarly, out of the 24 students who attended 5 or more tutorials, 20 had an achievement of ‘50% & above’ in exams.
On the other hand and still with respect to exams, out of the 19 students who attended less than 8 lectures, 11 had ‘below 50%’ achievement.
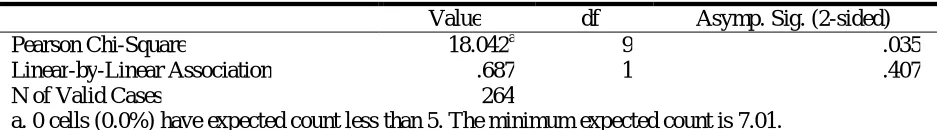
The chi-square results (table 6) show that there is a significant association between student achievement and attendance to academic writing sessions (lectures and tutorials), indicated by chi-square, 2, value of 18.042 (N=264, df =9, p=0.035)
Table 6: Chi-square Analysis of Students’ Achievement and Attendances to Lectures & Tutorials
Value df Asymp. Sig. (2-sided)
Pearson Chi-Square 18.042a 9 .035
Linear-by-Linear Association .687 1 .407
N of Valid Cases 264
a. 0 cells (0.0%) have expected count less than 5. The minimum expected count is 7.01.
5. Future Directions
This suggests the need for the activities used in the academic writing sessions for STEM students to be designed to encourage students into incorporating the features of academic writing in their mathematical expressions (Appendix 1). In doing this, it is necessary to ensure that activities used during the tutorials are subject-specific so as to enable student engagement. An evaluation of some of the activities that were used during the tutorials (for the above case) show the activities as being very generic, thus making the students (particularly STEM students) wonder about the purpose of attending the tutorials. For instance, if running a tutorial session on ‘revision and exams’ for mathematics students it is recommended that the activities incorporate the pattern of questions that this category of students are assessed on and not generic activities designed for a wide range of students.
Furthermore, the intention of the above case is to re-highlight the need for mathematics tutors to measure STEM students’ response and attendance to writing sessions. This can be done by encouraging the students to embrace writing as being an integral entity of the mathematics curriculum. Therefore, it becomes essential that embedding the writing module into core modules for STEM students be also focussed on assessing the students’ writing ability all through their study at university. For instance, mathematics students need to be shown and encouraged on how excellent writing skills contribute to their other modules in subsequent years (example link between the CSAW module in the first-year and their dissertation project in the final-year) and to employability.
6. References
Adu-Gwamfi, K., Bosse, M.J. & Faulconer, J. (2010). Assessing understanding through reading and writing in mathematics. International Journal of Mathematics Teaching & Learning. [Online] Available: http://www.cimt.plymouth.ac.uk/journal/adugyamfi.pdf (July 22, 2013)
Hartley, P., Hilsdon, J., Keenan, C. Sinfield, S. & Verity, M (Eds.) (2011). Learning Development in Higher Education. Basingstoke: Palgrave Macmillan (Universities into the 21st Century)
Higher Education Academy STEM (2012). Plagiarism in STEM subjects. University of Bath, Bath, 29th February 2012
Johnson, M.L. (1983). Writing in mathematics classes: A valuable tool for learning, Mathematics Teacher, 76(2), 117-119.
Kuh, G.D. (2003). What we're learning about student engagement from NSSE [National Survey of Student Engagement]: benchmarks for effective educational practices, Change, 35(2), 24-32.
[Online] Available:
http://cpr.iub.edu/uploads/Kuh%20%282003%29%20What%20We%27re%20Learning%20Abo ut%20Student%20Engagement%20From%20NSSE.pdf (May 10, 2013)
Marr, C.M. & Grove, M.J. (Eds.) (2010). Response to the Mathematics problem: The implementation of institutional support mechanisms, May 2010. Birmingham: Maths, Stats & OR Network
Author(2010). The Role of Mathematics Learning Development Centres in HEIs. International Journal for Mathematics Teaching and Learning, Oct 2010. [Online] Available: http://www.cimt.plymouth.ac.uk/journal/nzekwe.pdf (July 22, 2013)
Author (2011).Impact of Academic Writing Sessions on the Performance of Mathematics Students. 6th European First Year Students Conference, Manchester, 19-20 June 2011
Author (2013). Alleviating the Negative Learning Experience of Work-based Learners. Flexible Learning Conference: Can we do it? Yes we can! Recognising, Promoting and Developing Flexible Learning in HE, University of West Minister, London, 22-23 July 2013.
Race, P. & Pickford, R. (2007). Making teaching work: ‘teaching smarter’ in post-compulsory education. London: Sage Publications.
Student A
The mean, is a measure of central tendency while standard deviation is a measure of variability. This is to say that the mean is the measure of the average value of a sample. Statistically, it is represented as:
=
n x x
x1 2 ... n
=
n
x
n
i i
1
While standard deviation is represented as:
S =
1
)
(
)
(
2 2
N
N
x
x
For example, assuming, five students scored 20%, 50%, 60%, 40% and 80% in a maths test, using the above equations:
The mean is:
=
5
80
40
60
50
20
= 50
The standard deviation is computed as:
S =
1
5
5
/
)
80
40
60
50
20
(
)
80
40
60
50
20
(
2 2 2 2 2 2
= 22.36
Taylor, J.A. & McDonald, C. (2007). Writing in groups as a tool for non-routine problem solving in first year university mathematics, International Journal of Mathematical Education in Science and Technology 38(5), 639-655.
Vivaldi, F. (2003). Writing to learn mathematics, MSOR Connections, 3(4), 29-30.
Vivaldi, F. (2011) Mathematical writing: An undergraduate course. [Online] Available: http://www.maths.qmul.ac.uk/~fv/books/mw/mwbook.pdf (April 2, 2012)
Appendix 1: Activities in writing sessions for STEM students
Question: How can a student ensure adequate expression (academic writing and mathematical formulae) in exams?
‘In a Statistics Exams, the student was asked to “discuss the relationship between sample mean and standard deviation using relevant examples or illustrations”; which of the following two answers is the better one and why?’
Student B
In statistics, a sample population refers to a defined collection of objects, which is being observed or measured. For instance, in a given study, sample may refer to all the Maths students that are enrolled in the Statistics module. In order to measure a given sample, a number of parameters such as mean and standard deviation are required. The mean, known as a measure of central tendency, is the measure of the average value of the sample. Statistically, it is represented as:
=
n x x
x1 2 ... n
(1) =
n
x
n i i
1Where is the mean, xi represent the data sets, and n is the number of data sets.
Though the mean gives a measure of the centre of a data set or distribution, it does not give information about the extent of spread of the centre or information about the shape of the distribution. In view of this, standard deviation, known as a measure of variability, is the measure of dispersion in terms of how far values lie from the mean. Statistically, standard deviation is represented as:
S =
1
)
(
)
(
2 2
N
N
x
x
(2)Where S is the standard deviation, x represents the data sets and N represent the number of data sets.
For example, assuming five students scored 20%, 50%, 60%, 40% and 80% in a maths test, using eqns 1 and 2 above:
The mean score for the above data set (20%, 50%, 60%, 40% and 80% ) where n = 5, is:
=
n
x
n i i
1 =5
80
40
60
50
20
=
5
250
= 50
Therefore the mean score for the maths test is 50%
In order to verify how the students’ scores varied for the test, the standard deviation is computed:
S =
1 ) ( ) ( 2 2
N N x x = 1 5 5 / ) 80 40 60 50 20 ( ) 80 40 60 50 20( 2 2 2 2 2 2
= 4 5 / ) 250 ( ) 6400 1600 3600 2500 400
( 2
Chinny Nzekwe-Excel (PhD) is an Academic and Research Expert in the broad areas of Information Management and Learning Development, Highly Commended Outstanding Award Winner: the Emeralds Literati Network Awards for Excellence 2013, a Fellow of the Higher Education Academy, and an Editor/ Reviewer for several International Journals. She devotes her intellectual competence to continuous development of innovative structures and models in collaboration with recognised bodies and institutions that are aimed at focussing on the requirements of users, students and concerned workers. She has managed and led projects, which are focussed on identifying the needs of different individuals (within Commercial and Education sectors).