Publisher: Centre of Excellence for Scientific & Research Journalism, COES&RJ LLC Online Publication Date: 1st July 2015
Online Issue: Volume 4, Number 3, July 2015
http://www.centreofexcellence.net/J/JSS/JSS Mainpage.htm
© Author(s) 2015. Licensed under the Creative Commons License - Attribution 4.0
Application of Remote Sensing Technologies to detect the vegetation
changes during past two decades in Islamabad, Pakistan
Nusrat Shaheena, Dr. Muhammad Anwar Baiga, Muhammad Ahsan Mahbooba,
Saeed Akbarb, Dr. Muhammad Fahim Khokara
a National University of Sciences and Technology (NUST), H-12, Islamabad, Pakistan 44000
b WWF-Pakistan, G5-2, Islamabad, Pakistan 44000
Abstract:
Islamabad was built in 1960 as a capital of Pakistan. It is a city famous for its beauty, greenery, and beautiful trees. The total area of Islamabad is 906 km2.With increasing population, a lot of development projects have been initiated within the city, which had a huge impact on the vegetation. Awareness of urban vegetation, environmental quality and knowledge is really important for conservation of natural resource, management and improvement of ecosystem of urban resources. The impact of these development activities on vegetation was assessed for the last twenty years within Islamabad using remote sensing techniques. For this purpose, satellite images of Landsat were acquired for 1992, 2000, and 2013. Supervised classification and NDVI analysis were done to calculate the area under vegetation and other classes of all the images. Analysis of these satellite images revealed that vegetation was very dense in the past, but with the passage of time the vegetation loss became significantly prominent. Sector wise analysis was done to find out the most vulnerable area with respect to vegetation loss. The included H-10, G-13, G-5, and D-13. Although, some initiatives are being introduced to control vegetation area, but they do not match the pace of vegetation loss. Necessary measures need to be taken to maintain and improve vegetation to the desired level.
Keywords:
Remote sensing, Normalized Difference Vegetation index (NDVI), Islamabad, Satellite images, Development activities
Citation:
Shaheen, Nusrat; Baig, Dr. Muhammad Anwar; Mahboob, Muhammad Ahsan; Akbar, Saeed; Khokar, Dr. Muhammad Fahim (2015); Application of Remote Sensing Technologies to detect the vegetation changes during past two decades in Islamabad, Pakistan; Journal of Social Sciences (COES&RJ-JSS), Vol. 4, No. 3, pp:886-885.
887
1Introduction 1.1 Background
As a component of the environment and climate, vegetation plays an important role in terrestrial biosphere 1 and terrestrial biosphere is affected greatly by global warming2. For assessing the agricultural and natural land production, the status of vegetation is mainly used3,4,5. The browning or declining of vegetation is an indication of degradation of land6,7. Vegetative productivity is always correlated with Normalized Difference Vegetation Index (NDVI)8 and for browning or greening the NDVI trends are used as a representative9,10. The vegetative productivity is affected by different factors like management system and climate change so it is really complicated to determine the exact cause and effects11,12.
1.2 Urban Vegetation and its condition in Pakistan
For the conservation of natural resources, and quality of urban environment the understanding and deep knowledge vegetation and environmental quality of urban environment is crucial13. The relationship between environment and vegetation environment shows various underlying factors resulting in different patterns of vegetation patterns of urban ecosystems 14,15. The pool of species and environmental factors greatly affects the richness of the vegetation species in an urban ecosystem16 although because of limited knowledge of natural vegetation benefits these factors are always ignored by the city planners and policy makers and planners. Due to rapid industrialization, population growth, and urbanization, Pakistan is also facing environmental degradation like most of the developing countries,. On the correlation of land use types and urban vegetation types not much research has been done in Pakistan. Unfortunately, among decision makers and the general public, there is very low concern about this issue in the general public and policy makers. With increasing projects the and clearing of land for these projects, the structure of Islamabad has been largely changed in past years.
1. 3 Importance of Vegetation Analysis of Islamabad
The original Master Plan of Islamabad, was never enforced, which covers the urban areas of Rawalpindi. The root cause behind this weak enforcement is the lack of institutional development. In 1960, CDA was established under Federal Government to guide implementation and planning of the capital. But CDA authority was limited to the urban area. Absence of proper planning, imbalance resource allocation and the administrative fragmentation of Rawalpindi and Islamabad are the major obstacles to implement the original Master Plan of Islamabad17.
2. Materials and Methods 2.1 The Study Area: Islamabad
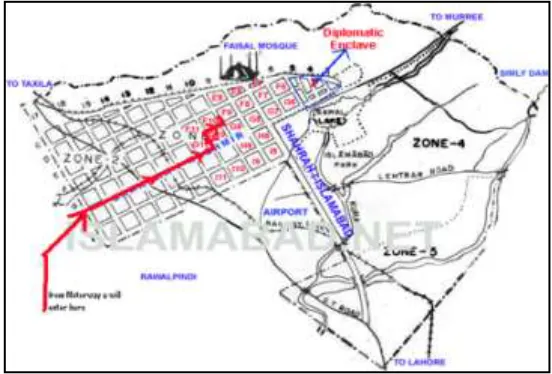
As shown in Figure 1, the study area selected for this research is Islamabad, which is
located at33.43°N 73.04°E with an elevation of 1,770 ft. Islamabad and Rawalpindi are
888
Figure 1
Map of Study Area
2.2 Datasets Used
Three Landsat images having resolution 30 m and three bands red, green and near infrared were taken from WWF-Pakistan. The images were of different dates 1992, 2000, and 2013 with the vector layers of the whole Islamabad having 30 by 30 resoultion.
2.3 Softwares Used
Following are the softwares used in this research 1.Erdas Imagine
2.ArcGIS
2.4 Methodology
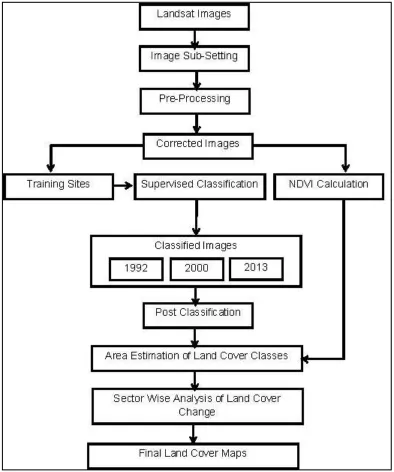
The estimation of vegetation cover has been done by two different methods. As shown in Figure 2, the whole methodology is composed of 06 stages:
1.Mosaicing.
2.Clipping images with vector layer. 3.Visual analysis of vegetation cover. 4.Estimation of NDVI.
5.Supervised classification. 6.Analysis of the results.
889
890
2.5 Normalized Difference Vegetation Index (NDVI) Analysis
Remote Senisg (RS) and Geographical Information System are proven to be a very useful tool because RS gives spatial as well as spectral data from satellites without physical contact with the object. The satellite imagery is the most reliable data in several contexts of the earth's surface like land use, biodiversity and topography, etc. GIS is the most recent technology for geographers which acts as a computer based system for displaying, checking, storing, collecting, retrieving, integrating, manipulating and analyzing. It provides the users different components like software, computer system, spatial data and analysis procedures. The emerging technique from RS and GIS is NDVI known as Normalized Difference Vegetation Index, which is used to check the spatio-temporal change in the vegetation cover for small regions on the surface of the earth 18, and condition19,20. Apart from checking the change in vegetation it can also quantify the photosynthetic capacity of the forest. The value of NDVI remains from -1 and +1. NDVI less than zero represent non-vegetation areas and 0-1 value always means wide variation in vegetation.
2.6 Supervised Classification
In the identification of desired features the indices are known as important tools by combining of two or more than two spectral bands. For the comparison of vegetation/greenery from different images NDVI can be used a standard method as it is the indicator of greeness and biomass 21. To get best results from supervised classification the maximum likelihood classifier (MLC) should be used22. For the calculation of non vegetative and vegetative cover the supervised classification has been proven best. Prior knowledge of the land cover of the area under study is really important for doing supervised classification, making it more instinctive procedure mapping the land-cover changes. The calibration pixels in supervised classification are selected and the associated statistics are generated for all the classes.
By applying MLC the training samples for the supervised classification were utilized to classify the satellite image. Around six training sites for each class were taken and then using a maximum likelihood algorithm the supervised classification was done. Then the image was classified into different classes on the basis of spectral response. After that classes were being merged according to the type of class.
3 Results and Discussion
3.1 Overall Condition of Vegetation and Settlement
NDVI Analysis and supervised Classification were done on all images and the images were then compared with google imagery to validate the results. During pre-processing and geo-rectification errors were eliminated or reduced to get the most accurate results. Different sectors were selected to further study the change in vegetation within the different areas of Islamabad where the vegetation loss was evident. The selected sectors were: H-10, G-13, G-5 and D13. In all the maps of 1992, 2000 and 2013 the RS data was used to generate maps of vegetation cover generated by supervised classification
3.1.1 NDVI Analysis
891
Table 1 Results of NDVI Analysis
Year No of
Pixels
Area of one Pixel
Total Area under under Vegetation
Total Area of Islamabad
(km2)
Percentage
1992
572834
0.0009 515.5 906 56
2000
493117
0.0009 443.8 906 48
2013
356979
0.0009
321.2
906 35
3.1.2 Results of Supervised Classification
The RS data was used to create maps of non vegetation and vegetation cover by two methods, i.e., supervised classification and NDVI. The study of vegetation generated from the Landsat demonstrates a clear area of vegetation in Islamabad. The spatial analysis of the vegetation covers clearly indicate that the biomass become poor with the passage of time.
In Table 2 the loss of vegetation and settlement increase is given. Vegetated area which is estimated at September 1992 was 529.12 km2, 58% of the total area of Islamabad. While in 2000 it was 455.43 km2 around 50% of the total area and in 2013 the area under vegetation has been rapidly decreased to 308.67 km2, which means it is 34% of the total area of Islamabad. From 1992-2000 settlement was increased from 15% to 18% and in 2013 it has reached to 23%. The rate of vegetation loss from 1992 to 2013 was 10.02 km2 per year that is 1.09 % of the total area of Islamabad per annum. From 1992 to 2013 total of 226.21 km2 of vegetation has been removed up till now.
Table 2 Change in Vegetation and Settlements during 1992-2013
Area (km2) 1992-2000 Area (km2) 2000-20013
Vegetation loss -73.69 -146.76
Settlement increase +24.13 +41.84
3.2 Land Cover Classification
Land cover classification of Landsat images was performed using MLC of supervised classification to categorize vegetation cover. The results showed the area covered by non vegetation and vegetation cover. The land use categories of interest in my research are Vegetation, Settlement, Water, and other lands.
In the Figure 3 the map of 1992 is clearly showing a larger area under vegetation because in 1992 as Islamabad was constructed as a forward capital in 1960 and it was not highly developed during 1992 which is the main reason behind more greenery during this time period.
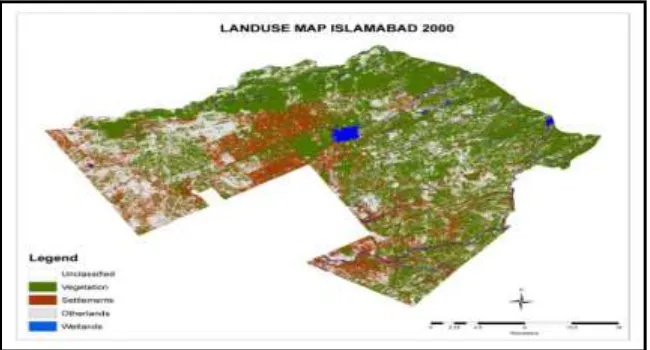
In the Figure 4 the supervised classified map of year 2000 is showing removal of vegetation which is mainly due to the constructions of new buildings and sectors in Islamabad ultimately increasing the built up area at the cost of greenery. The area, where Convention Centre, Serena Hotel and the under-construction Grand Hyatt Hotel stand today, was designated as green belt in the original master plan. The changes were made in 1995 to allow construction on the green area.
892
Centaurs Mall all made it to the city’s landscape only after making changes to the original master plan. Similarly, a new road for running parallel to the Islamabad Highway starting from Faizabad Interchange to the Lok Virsa signal was approved after making another change to the original master plan, while several trees had to cut to level the land for the parade avenue.
Figure 3 Map showing the vegetation of Year 1992
893
3.3 Vegetation Cover
One cannot estimate and monitor the change in area under vegetationeffectively for past years without applying the remote sensing technologies. The change in vegetation covered area facilitates us to unearth the impacts of decreasing and increasing trends on the environment. Assessment done in this research gives us a reliable warning of the changes in the vegetation cover and shows a declining trend of vegetation during the time period of 1992 to 2013 in Islamabad as shown in Figure 6. Vegetated area estimated for 1992, 2002, and 2013 shows that total vegetation is 58, 50, and 34 % of the total area. The overall rate of vegetation loss from 1992 to 2013 was 10.02 km2 per year that is 1.09 % of the total area of Islamabad per annum, while the other land cover classes are increasing with respect to time as shown in Table 3.
894
Table 3 Trend of different classes from Supervised Classification
3.4 Sector Wise Analysis
Different sectors were selected to further study the change in vegetation within the different areas of Islamabad where the vegetation loss was evident. The selected sectors were:, H-10, G-13, G-5 and D-13. Residential sectors (G-13 and D-13) were found to be at high risk as compared to the educational sector and diplomatic enclave .
3.4.1 Sector G-13
Sector G-13 is a newly developed sector so in the Figure 7 the supervised classified image we can is clearly showing a huge vegetation loss from 1.96 km2 in 1992 to 0.05 km2 in 2013. This is due to new development activities being done in this sector affecting the natural vegetation at an alarming rate.
3.4.2 Sector H-10
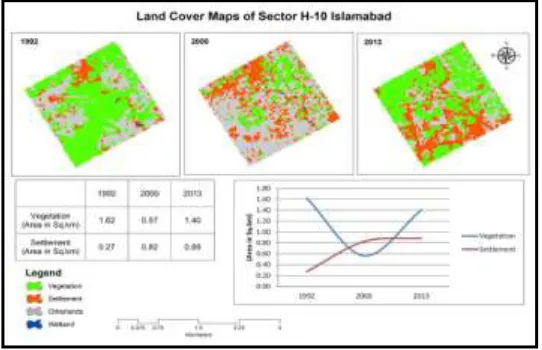
The H-10 sector has The International Islamic University and the National University of Computer and Emerging Sciences (FAST-NUCES). In Figure 8 The supervised classified image of 1992 shows that there was enough vegetation in 1992 around 1.62 km2, but then in 2000 the vegetation has been decreased to 0.57 km2. In the year 2013 again vegetation has been increased from 0.57 km2 to 1.40 km2. The vegetation increase is due to the fact that this sector contains the institutions and re vegetation has been done by the management of International Islamic Univeristy and FAST-NUCES.
3.4.3 Sector G-5
Vegetation loss in the Secteriate area of G-5 is not high as vegetation in 1992 is 1.40 km2 and 1.24 km2 in 2013 as seen in Figure 9 and Figure 10. While in diplomatic enclave the vegetation loss is very high. This is due to the fact that in the area of Pakistan secretariat there are so many government institutions operating so they have maintained the ration of vegetation within that area while in diplomatic enclave the high vegetation loss is because later all the embassies were shifted out of the red zone and they are located now in diplomatic enclave that’s why the vegetation is continuously decreasing in this area as many new embassies were also built and while doing all this lot of green vegetation was removed .
3.4.4 Sector D-13
In the Supervised classified image of D-13 the vegetation has been decreased from 0.99 km2 in 1992 to 0.06 km2 in 2013 as shown in Figure 11. Previously, there was no development in D-13 but it has been developed as a new sector so the image clearly shows the decrease in vegetation while the rapid increase in the settlement area. The image of 2013 shows a high area under other lands which shows that more settlements are under construction that’s why the area under other lands (barren soil) is very high in 2013.
Classes
Area in Km2
1992 2000 2013
Vegetation 529.13 455.50 302.91
Settlements 143.92 168.06 209.90
Water Bodies 17.35 19.94 13.53
895
Figure 7 Map Showing Vegetation Change in G-13
896
Figure 9 Map Showing Vegetation Change in G-5 Pak-Secretariat
897
Figure 11 Map showing Vegetation Change in Sector D-13
4 Conclusions and Recommendations 4.1 Conclusions
This study confirms reports of vegetation degradation within Islamabad. The results of the study are very important for the governmental organizations, non governmental organizations and the general public to respond faster and address the problem. The problem here is not only to do with the Islamabad vegetation alone, but also all other cities of the country. Otherwise, the lives of present and future generations are at stake. Based upon the results and analysis of the data the following conclusions were drawn from the present study.
• From 1992-2000 total area of 73.63 km2 of vegetation was removed in Islamabad with an annual rate of vegetation removal increasing from 0.9% to 1.3% in 1992 to 2013.
• From 2000 to 2013 total area of 152.59 km2 of vegetation was lost in Islamabad with an increase in the annual rate of settlement from 2.7% to 3.22% during 1992-2013)
• Residential sectors are losing vegetation at a very alarming rate as compared to the other sectors.
• The flora of Islamabad is under a constant threat..
4.2 Recommendations
The development and management of cities need greater consideration. The first thing is for the governments to identify the seriousness of the urban issues. The second step is to get right context to create a suitable policy of development which means economic growth requiring a favorable climate for the public and private investment. After that, it is essential to structure the improvement program which requires thorough examination of all the development activities in urban areas. There is also a need to adopt a program for the control of population growth and urban expansion at a rapid rate. Based upon this research work, the following recommendations can be made for future work.
898
2 Strong awareness movement is needed to aware people of Islamabad regarding naturally existing resources and engages them in managing the resources
3 This study can be successfully used for monitoring the growth of cities/removal of vegetation and it can be applied for other cities of Pakistan
4 For further research high resolution data can be used like 20m or 10m.
5 Remote sensing data should be used as input for analysis and decision supporting system.
6 This type research can be used as a support for the Sustainable development.
ACKNOWLEDGEMENTS
Words cannot express how grateful I am to my Parents andSiblings specially Asif Kahn and Shakeela Naz for all of the sacrifices that they have made on my behalf. I am really thankful to Zohaib Amjad, who always encouraged me to go on every adventure, especially this one.
I am highly thankful to IGIS-NUST and WWF-Pakistan for providing me the data and facilitating me in using different remote sensing softwares. Many thanks to Farhat Jabeen and Javeria Abbas, for their constant support.
References:
1. Foley, J. A., Levis, S., Costa, M. H., Cramer, W., & Pollard, D. “Incorporating dynamic vegetation cover within global climate models,” Ecological Applications, 10, 1620−1632. (2000).
2. IPCC. Synthesis Report. “4th Assessment report of the intergovernmental panel on climate change” (pp. 52) (2007).
3. Cai , X. L., & Sharma, B. R. “Integrating remote sensing, census and weather data for an assessment of rice yield, water consumption and water productivity in the Indo-Gangetic river basin” (2010).
4. Sims, D. A., Rahman, A. F., Cordova, V. D., El-Masri, B. Z., Baldocchi, D. D., Bolstad, P. V., et al. “A new model of gross primary productivity for North American ecosystems based solely on the enhanced vegetation index and land surface temperature from MODIS,” Remote Sensing of Environmen, 112, 1633−1646 (2008).
5. Yu, D., Shi, P., Shao, H., Zhu, W., & Pan, Y. . “Modelling net primary productivity of terrestrial ecosystems in East Asia based on an improved CASA ecosystem model,” International Journal of Remote Sensing, 30, 4851−4866 (2009).
6. Metternicht, G., Zinck, J. A., Blanco, P. D., & Del Valle, H. F.. “Remote sensing of land degradation: Experiences from Latin America and the Caribbean,” Journal of Environmental Quality, 39, 42−61 (2010).
7. Zika, M., & Erb, K. H. “The global loss of net primary production resulting from human-induced soil degradation in drylands,” Ecological Economics, 69, 310−318.(2009) 8. Prince, S. D., & Tucker, C. J. “Satellite remote sensing of rangelands in Botswana
II.NOAA AVHRR and herbaceous vegetation,” International Journal of Remote Sensing, 7, 1555-1570 (1986).
9. Alcaraz-Segura, D., Chuvieco, E., Epstein, H. E., Kasischke, E. S., & Trishchenko, A. “Debating the greening vs. browning of the North American boreal forest: Differences between satellite datasets,” Global Change Biology, 16, 760−770 (2009).
10. Bai, Z. G., Dent, D. L., Olsson, L., & Schaepman, M. E. “Proxy global assessment of land degradation. Soil Use and Management,” 24, 223−234 (2008).
899
12. Wessels, K. J., Prince, S. D., Malherbe, J., Small, J., Frost, P. E., & VanZyl, D. “Can human-induced land degradation be distinguished from the effects of rainfall variability? A case study in South Africa,” Journal of Arid Environments, 68, 271−297 (2007). 13. P. Pysek, K. Prach, M. Remanek and M. Wade “On the terminology used in plant
invasion studies,” In: Plant invasions: General Aspects and Special Problems. (Eds.). SPB Academic. pp. 71-81 (1995).
14. Zeleny, D. “Patterns of vegetation diversity in deep river valleys of the Bohemian Massif,” Ph.D Thesis. Faculty of Science. University of South Bohemia, Czech Republic. pp. 126 (2008).
15. Pausas, J.G. and M.P. Austin. “Patterns of plant species richness in relation to different environments,” J. Veg. Sci., 12: 153-166. (2001).
16. Leps, J. “What do the biodiversity experiments tell us about consequences of plant speciesloss in the real world?,” Basic. App. Ecol., 5: 529-534 (2004).
17. Tayler, G. “Some ecophysiological and historical approaches to species richness andcalcicole/ calcifuge behavior – contribution to a debate,” Folia Geobotanica, 38: 419-428 (2003).
18. Sanders, N.J. “Elevational gradients in ant species richness: area, geometry and Rapoport’srule,” Ecography, 25: 25-32 (2002).
19. Hermy, M. and J. Cornelis. Towards a monitoring method and a number of multifaceted and hierarchical biodiversity indicators for urban and suburban parks. Landscape.Urb. Plan., 49:149-162 (2000).
20. Rhoades, J.D. and R.J. Stipes. “Growth of trees on the Virginia Tech campus in response to various factors,” J. Arboriculture, 25: 211-215 (1999).
21. Dyer, S.M. and D.L. Mader. “Declined urban sugar maples: growth patterns, nutritional status and site factors,” J. Arboriculture, 12: 6-13.(1986).
22. Close, R.E., P.V. Nguyen and J.J. Kielbaso. “Urban vs. natural sugar maple growth: stress symptoms and phenology in relation to site characteristics,” J. Arboriculture., 22: 144-150.(1996).
23. Fostad, O. and P.A. Peterson. Vitality, variation and causes of decline of trees in Oslo center (Norway). J. Arboriculture, 23: 155-165.(1997).
24. Alvey, A.A. Promoting and preserving biodiversity in the urban forest. Urb. Forest. Green.,5: 195-201.(2006).
25. Qadir, A., R.N. Malik and S.Z. Husain. “Spatio-temporal variations in water quality of Nullah Aik-tributary of the river Chenab, Pakistan,” Environ. Monit. Assess., 140: 43-59.(2008)
26. Luther, J. E., R. A.Fournier, D. E. Piercey, L. Guindon, and R. J. Hall. “Biomass mapping using forest type and structure derived from Landsat TM imagery,” International Journal of Applied Earth Observations and Geoinformation. 8, 173-187.(2006)
27. Rossini, M., C. Panigada, M. Meroni and R. Colombo. “Assessment of oak forest condition based on leaf biochemical variables and chlorophyll fluroscence,” Tree Physiology. 26, 1487-1496(2006)
28. Wulder, M. A., J. C. White, B. Bentz, M. F. Alvarez, and N. C. Coops. “Estimating the probability of mountain pine beetle red attack damage,” Remote Sensing of Environment. 101, 150-166.(2006)
29. Schowengerdt, R.A., “Remote Sensing: Models and Methods for Image Processing,” Second ed, Academic Press, San Diego, 522 pp.(1997)
900
31. IDNP. “A methodology for identification of waterlogging and soil salinity conditions using remote sensing”. CSSRI, Karnal and Alterra-ILRI, Wageningen, The Netherlands, 78 (2002).
Nusrat Shaheen is working as a Senior Conservation Officer at WWF-Pakistan
Islamabad. She has a working experience of around 3 years in the field of Environmental Science. She received her BS Hons Degree in Environmental Science from Punjab University Lahore and MS degrees in Environmental Science from the National University of Science and Technology, Islamabad in 2012 and 2015, respectively.
Caption List
Fig. 1 Map of the Study Area
Fig. 2 Methodology Used in this Research to asses Vegetation Cover.
Fig. 3 Map showing the vegetation of Year 1992.
Fig. 4 Map showing the vegetation of Year 2000.
Fig. 5 Map showing the vegetation of Year 2013.
Fig. 6 Change in Vegetation Cover over the Past Years.
Fig. 7 Map showing Vegetation Cover change in H-10.
Fig. 8 Map showing Vegetation Cover change in G-13.
Fig. 9 Map showing Vegetation Cover change in G-5 (Pakistan Secteriate).
Fig. 10 Map showing Vegetation Cover change in G-5 (Diplomatic Enclave).
Fig. 11 Map showing Vegetation Cover change in D-13.
Table 1 NDVI Analysis
Table 2 Total Change in Land Cover Area
Table 3 Area under Classes of Land Cover during 1992-20