c
R. Savoireet al.,Published by EDP Sciences2015 DOI:10.1051/ocl/2015016
Available online at:
www.ocl-journal.org Oilseeds & fats Crops and Lipids
OCL
R
esearch
A
rticle
– D
ossier
O
pen
A
ccess
F
LAX AND HEMP
L
in et chanvre
Environmental and varietal impact on linseed composition
and on oil unidirectional expression process
Raphaëlle Savoire
1,, Melha-amel Lazouk
1,2, Elisabeth Van-Hecke
1, Romain Roulard
3,4,
Reynald Tavernier
5, Xavier Guillot
6, Larbi Rhazi
3, Emmanuel Petit
4, François Mesnard
4and Brigitte Thomasset
11 EA 4297, TIMR, UTC/ESCOM, CS60319, 60203 Compiègne Cedex, France
2 CNRS-FRE 3580, GEC, Université de Technologie de Compiègne, CS 60319, 60203 Compiègne Cedex, France 3 Institut Polytechnique LaSalle Beauvais, 19 rue Pierre Waguet, 60026 Beauvais, France
4 EA 3900, BioPI, UFR des Sciences, UPJV, 33 rue Saint Leu, 80039 Amiens, France 5 LINEA, 20 avenue Saget, 60210 Grandvilliers, France
6 Laboulet Semences, 80270 Airaines, France
Received 30 January 2015 – Accepted 2nd April 2015
Abstract – Effect of environmental factors and cultivar on linseed composition and subsequent oil expression has been studied. Ten linseed cultivars were grown in two different location (north and south of France) during years 2011, 2012 and 2013. Every year have been characterized in terms of pluviometry, sunshine hours and degree days, each climatic factor has been cumulated from flowering to harvest. A strong impact of cultivar on oil, C18:3 and starch content has been noticed whereas the growing location has only affected the starch and lipid contents. Year effect have been recorded on proteins, oil and C18:3 content. A principal component analysis has highlighted the correlation between the pluviometry and the C18:3 content. Oil content have not presented any correlation with environmental or composition factors. Oil expression using the seeds previously characterized has exhibited a strong correlation between C18:3 content and oil yield. No correlation between oil yield and other composition parameters has been observed. The analysis of variance conducted on yield has emphasized that yield variation was majority attributable to a year effect. Keywords: Linseed/composition/environmental factors/oil expression/cultivar
Résumé – Impact de la variété et de l’environnement sur la composition des graines de lin et sur le pressage
unidirectionnel. L’effet des paramètres environnementaux et de la variété sur la composition de la graine de lin et sur
le procédé ultérieur de pressage a été étudié. Dix variétés de lin oléagineux ont été cultivées sur deux sites différents (nord et centre de la France) au cours des années 2011, 2012 et 2013. Chaque année de culture a été caractérisée, de la floraison des plants à la récolte des graines, en termes de cumul de précipitation, de cumul d’heures d’ensoleillement et de degrés jour de croissance (DJCF). Un fort effet variétal sur les teneurs en huile, C18:3 et amidon a été relevé tandis que le lieu de culture n’a affecté que la teneur en lipides et amidon. L’effet année a quant à lui été marqué pour les teneurs en protéines, huile et C18:3. Une analyse en composantes principales a mis en évidence le lien entre teneur en C18:3 et cumul de précipitations. La teneur en lipides n’a pu être corrélée à aucun des paramètres environnementaux ou de composition étudiés. Le pressage des graines précédemment caractérisées a montré une forte corrélation entre teneur en C18:3 et rendement. Aucune autre corrélation entre paramètres de composition et rendement de pressage n’a été notée. L’analyse de variance a mis en évidence que les variations de rendement observées étaient principalement imputables à un effet année.
Mots clés : Graines de lin/composition/facteurs environnementaux/pressage/cultivar
1 Introduction
Oil crops have enormous economic importance worldwide
since vegetable oil consumption has increased by>50% over
Correspondence:[email protected]
the past decade and is expected to double by 2040
(FAO-STAT,2014). The production of vegetable oils has represented
around 176 million metric tons in 2014 (USDA – Oilseeds
World Market and Trade, 2014) and the majority of oils we
consumed are accumulated in seeds. These oil resources are
D
used to 97% in the food industry leaving only 5 million tons for the energy market, chemistry and oleochemistry (Carlsson,
2009; Floros et al., 2013; Hong et al., 2012; Meier et al.,
2007).
Among these oil crops, flaxseed (Linum usitatissimumL.)
is emerging as an important functional food ingredients and
one of the richest sources ofα-linolenic acid (18:3cisΔ9,12,15;
ALA) praised for their health benefits (Akhtar,et al.,2013;
Goyalet al., 2014; Hallet al.,2006; Jhala and Hall, 2010;
Singhet al.,2011). Flaxseed typically accumulates 35–50% of
the dry weight of their seed tissue as storage oil normally in the
form of triacylglycerides (TAG) (Adugnaet al.,2004; Batta
et al., 1985; Vereshchagin and Novitskaya, 1965). This
spe-cific oil contains∼45 to 65% omega-3 polyunsaturated fatty
acids depending of the genotypes (Adugnaet al.,2004; Batta
et al., 1985; Chandrawati et al., 2014; Fofanaet al., 2010;
McGregor and Carson,1961; Thambugalaet al.,2013; Tonnet
and Green,1987; Westcott and Muir,2003).
However, plants are cultured in different environments
where they are exposed to various climate conditions and soils conditions with a direct repercussion on the seed filling and its
final composition (Dilman and Hopper,1943; Dybing et al.,
1966; Kirkhuset al.,2013; Lafondet al.,2008; Painteret al.,
1944; Westcott and Muir,2003). In fact, several factors
com-prising temperature, rainfall, light, drought, ozone exposure, nitrogen deprivation, fertilizers may influence the nutritional
quality of oilseeds (Baldiniet al.,2002; Flagellaet al.,2002;
Green,1986; Harriset al.,1978; Rahimiet al.,2011; Tripathi
and Agrawal,2013). Numerous works have reported the
en-vironmental effects on yield, oil content and fatty acids
com-position of oil, tocopherols, phytosterols, and phospholipids in
oilseed plants (Fromentet al.,1999; Green,1986; Trémolière
et al.,1982; Tripathi and Agrawal,2013; Zubr and Matthaus,
2002). Cold is one of parameters directly involved in the
in-creasing of omega-3 content in plant tissues maintaining
mem-brane integrity and their fluidity (Guanet al.,2014; Steindal
et al.,2015; Tonnet and Green,1987).
The objective of this study was to evaluate the impact of environmental conditions on the chemical composition of
seeds of different genotypes of flax. In this study, ten flax
cul-tivars were systematically used and cultured during three
con-secutive years at two different locations. The effects of
sea-sonal factors such as temperature, rainfall and sunshine on oil, starch and protein contents of flax seeds were determined. The impact of seed composition was also tested on the oil expression.
2 Materials and methods
2.1 Raw material
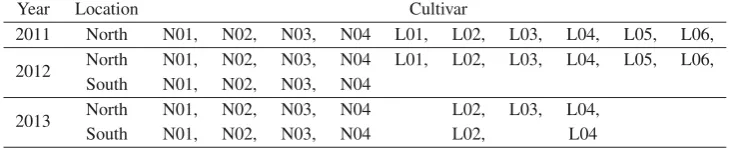
Ten linseed cultivars named L01, L02, L03, L04, L05, L06 and N01, N02, N03, N04 were cultivated in fields over three years (2011, 2012 and 2013) in France. Two locations were studied, one in the center of France (named south in the fol-lowing) and one in Picardie (North). Due to meteorological issues, all cultivars have not been harvested in all locations for
all years. Table1summarized the growing location and
culti-vars considered for each cultivation year.
2.2 Meteorological conditions
For each cultivation year and growing location, mete-orological conditions were collected. This characterization was realized using meteorological data from the
meteoro-logical station nearest the growing location (i.e. Abbeville
meteorological station for north location and Chartres for
south; www.infoclimat.fr). Raw data (i.e. pluviometry,
sun-shine hours, maximal and minimal temperatures) were col-lected for each day between plant flowering (estimated at 50% of the field in flower) and seed harvesting. Degree day after flowering (DDAF) were calculated from temperature data us-ing equation (1).
DDAF= Tmax+Tmin
2 −Tbase (1)
withTmaxthe daily maximal temperature,Tminthe daily
mini-mal temperature andTbasea reference temperature set at 5◦C
for linseed.
For evaluating the impact of meteorological conditions on seed composition, these data were summed for all days be-tween flowering and harvesting.
2.3 Seed characterization
Each biochemical characterization was performed in trip-licate on three independent seed samples randomly chosen.
2.3.1 Oil content
Seed oil content was determined using a method adapted to
low seed masses. 200 mg of seeds were oven dried at 104◦C
for 24 h. Dried seeds were grinded one minute in isooctane using a ball mill (Precellys 24 lysis homogenization). Seed-solvent mix was then centrifuged (6000 rpm, 1 min). The upper phase containing oil and solvent was recovered and a second extraction on the bottom solid phase was performed. Super-natants were pooled and then evaporated under nitrogen. Re-covered oil was then weighted and seed oil content was calcu-lated on a dry basis. Reliability of the extraction method was assessed through comparison with standard soxhlet method (norm NF EN ISO 65) and quantitation obtained by a Cofrac certified laboratory (Cetiom) using NMR method (data not shown).
2.3.2 Protein content
Table 1.Cultivar repartition according to year and location.
Year Location Cultivar
2011 North N01, N02, N03, N04 L01, L02, L03, L04, L05, L06, 2012 North N01, N02, N03, N04 L01, L02, L03, L04, L05, L06,
South N01, N02, N03, N04
2013 North N01, N02, N03, N04 L02, L03, L04,
South N01, N02, N03, N04 L02, L04
Table 2.Meteorological conditions.
Growing
Year Sunshine hours (h) Pluviometry (mm) DDAF (◦C)
location Value Mean Value Mean Value Mean
2011 630±80
530 250±20 190 1240±50 1010 North 2012 450±10
(490∗) 220±20 (160∗) 930±40 (890∗)
2013 520±10 90±20 860±30
South 2012 505±10 570 260±20 180 1050±30 1110
2013 638±0 106±0 1174±0
All 2012 480 530 240 170 990 1000
2013 580 100 1010
∗Values in brackets are the means for years 2012 and 2013 for North growing location. ±values are standard deviations for the different
cultivars.
2.3.3 Starch content
Starch content was determined using an enzymatic kit (Megazyme K-TSTA) on 100 mg of seeds.
2.3.4 Acidα-linolenic content
Fatty acid profile was established by transmethylation of triglycerides and further analysis by GC-FID. On 5 mg of oil,
100µl of diethyl ether and 5µl of tetramethyl ammonium
hy-droxide (in 25% methanol) were added. The mix was
incu-bated at 50 ◦C for 5 min then the reaction was stopped by
addition of decane. After centrifugation, the aqueous phase containing fatty acid methyl ester was recovered and diluted in heptane prior to GC analysis. Gas chromatography with Flame Ionization Detector (FID) was used for fatty acid quan-titation. Fatty acids separation was performed using a capillary
BPX-70 (30 m×0.25 mm×0.25μm) column. 10µl of
sam-ple was injected at 250◦C using an automatic injector
(AOC-20i, Shimadzu). Oven temperature was set at 120◦C and was
increased to 250◦C using a 15◦C/min slope. Then
temper-ature was maintained for 2 min. 1.2 ml/min hydrogen flow
at 67 kPa was used. Detection was realized at 280◦C. Data
was collected and integrated by a GC solution v2.4
integra-tion system (Shimadzu).α-linolenic acid content was
calcu-lated by the ratio of C18:3 peak surface to the total surface of the chromatogram.
2.4 Oil expression
Pressing experiments were conducted on a device espe-cially designed for expression conducted on small seed quan-tities. 3.17 g of milled seeds were expressed at 100 bar for 1 h
at 50 ◦C. The experimental setup was described in Savoire
(2008). Expression was conducted on seeds dried at 5%
resid-ual moisture content.
2.5 Statistical analysis
All data were analyzed using R software through the R Stu-dio interface. For principal component analysis, FactoMineR package was used, for ANOVA car package with type III sum of squares was chosen.
3 Results and discussion
Seeds of every year and location were analyzed for lipid,
protein, starch content andα-linolenic content of oil was also
determined. Data were correlated with meteorological growing conditions and cultivar considered to assess the influence of growing location, year and cultivar.
3.1 Meteorological conditions
Table2computes the meteorological data for each growing
location and year. Each year has presented a particular climate. Year 2011 was characterized by high pluviometry, DDAF and sunshine hours. For this year, cultivation has only take place in the North. Comparing years 2012 and 2013, climate has evolved following similar tendencies in south and in North. Year 2012 was more rainy but also less sunny. DDAF evolu-tion according to year was dependent of the growing locaevolu-tion. DDAF has decreased between 2012 and 2013 in the North whereas it has increased in the South. South growing loca-tion has presented higher temperatures (highlighted by higher DDAF) and higher sunshine hours than North ones. Pluviom-etry was relatively closed for both locations.
D
2011 2012 2013
38
40
42
44
46
Lipid content(% db)
a b b
2011 2012 2013
50
55
60
65
Year
C18:3 content (%)
a a b
2011 2012 2013
0.05
0.10
0.15
0.20
0.25
0.30
Year
Starch content (%)
a a a
2011 2012 2013
18
20
22
24
26
Protein content (%)
a b b
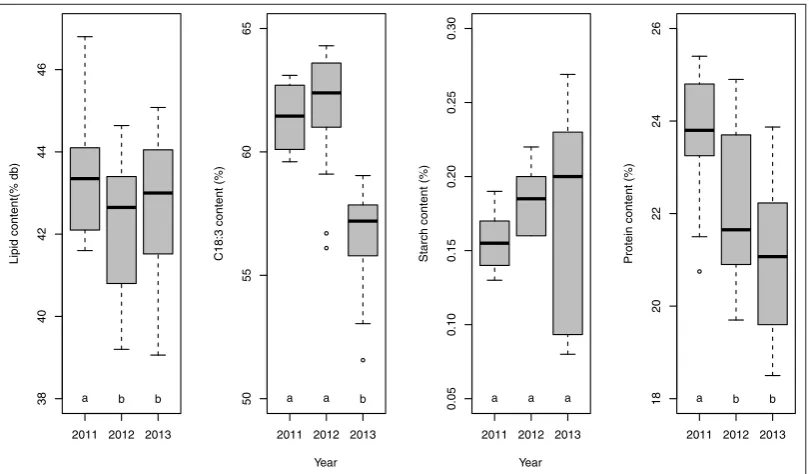
Fig. 1.Boxplots of year significant effect on lipid content, C18:3 content, starch content and protein content (means with the same letter are
not significantly different according to Tukey HSD test at 95% confidence interval).
Table 3. F values and levels of significance of ANOVA of seed
components.
Factor Oil Proteins Starch C18:3 Cultivar 12.24∗∗∗ 1.73NS 3.19∗ 4.45∗∗
Year 7.16∗∗ 6.08∗∗ 4.69∗ 39.53∗∗∗ Location 8.06∗∗ 1.33NS 5.25∗ 0.63NS
NS: non-significant;∗P<0.05;∗∗P<0.01;∗∗∗P<0.001.
3.2 Analysis of variance
First of all, data of composition were analyzed through ANOVA using year, growing location and cultivar as
explica-tive factors. Table3summarized the ANOVA results.
Cultivar remains the principal factor affecting oil, starch
and C18:3 content of flax seeds (Tab.3, Fig.2). Oil content in
flax seeds were reported between 30 to 50% of the dry weight containing 40 to 66% of C18:3 with a level highly dependent on the genetic variation between linseed genotypes (Adugna et al., 2004; Batta et al., 1985; Mc Gregor and Carson,
1961; Tonnetet al.,1987; Vereshchagin and Novitskaya,1965;
Westcott and Muir,2003). As for other plant species, the flax
cultivars tend to maintain their rank in regard to oil con-tent and fatty acid composition whatever the culture
condi-tions (Ghamkharet al.,2010; McGregor and Carson, 1961;
Rahimiet al.,2011). Thus, the flax variability is specifically
exploited to identify common molecular markers linked to oil
content and fatty acids in order to establish efficient strategies
for marker-assisted breeding of flax (Chandrawatiet al.,2014;
Soto-Cerdaet al.,2014).
Year had a significant impact on all considered responses.
This impact could be attributed to different meteorological
conditions during growing. Mean composition of the seeds
according to year is presented in Figure 1. For flax as
for various other plant species, the seed storage compounds (proteins, starch, fatty acids) are subjected to modifications that can be easily explained by seasonal variations (Adugna
and Labuschagne, 2002, 2003; Dilman and Hooper, 1943;
Fieldsend and Morison,2000; Kirkhuset al.,2013; McGregor
and Carson,1961; Westcott and Muir,1996). The year
inter-action effects are often considered as the most important
envi-ronmental factors affecting yield and seed components.
For lipid content, Tukey HSD test has highlighted a
pair-wise difference between year 2011 and years 2012–2013. This
could be due to the higher DDAF and sunshine hours for year 2011 compare to other years. However, the large variation de-pending in particular of the genotype was observed for each
year (Figs.1and2). This result is in accordance with literature
in which seasonal conditions are generally reported to
signif-icantly affect seed oil content and oil composition (McGregor
and Carson,1961; Vollmannet al.,2007; Westcott and Muir,
1996). However, it is on contradiction with the results obtained
by Kirkhus and collaborators (2013) on camelina (a plant rich
in C18:3) where no difference has been observed on seed oil
content during 3 years of camelina cultures in Norway. In our study and for C18:3 content, year 2013 is
sig-nificantly different from year 2011 and 2012. This diff
er-ence could be correlated with the lower pluviometry ob-served in 2013 compare to the other years (100 mm instead
of 240/250 mm). No data has been reported on the
modifi-cation of flax seed composition under an excess or a limi-tation of rainfall during plant development. Generally, a low temperature during seed filling promotes the accumulation of C18:3 in triglycerides (TAG) and phospholipids of flax
seeds (Green, 1986; Tonnet and Green, 1987; Velasco and
Fernandez-Martinez, 2002). However, in our study, only a
slightly decrease of temperature was observed between 2012
L01 L02 L03 L04 L05 L06 N01 N02 N03 N04 38
40 42 44 46
Lipid content(% db)
bcd ab abc a cd ab cd bc d bc
L01 L02 L03 L04 L05 L06 N01 N02 N03 N04 50
55 60 65
Cultivar
C18:3 content (%)
a ab a ab ab a a ab b a
L01 L02 L03 L04 L05 L06 N01 N02 N03 N04 0.05
0.10 0.15 0.20 0.25 0.30
Starch content (%)
bc a ab abcabcabc c abcabc bc
Fig. 2.Boxplots of cultivar significant effect on lipid content, C18:3 content and starch content (means with the same letter are not significantly
different according to Tukey HSD test at 95% confidence interval).
Nor
th
South
38 40 42 44 46
Lipid content(% db)
a a
Nor
th
South
0.05 0.10 0.15 0.20 0.25 0.30
Starch content(%)
a b
Fig. 3.Boxplots of location significant effect on lipid content, and
starch content (means with the same letter are not significantly diff er-ent according to Tukey HSD test at 95% confidence interval).
not enough to explain the observed differences (Fig.1). In the
studies on camelina, an oilseed plant rich in linolenic fatty
acids, Vollmann and collaborators (2007) have clearly shown
that low temperatures and high precipitation during the seed filling increase the production of linolenic fatty acids in seeds
of different camelina genotypes. This result seems to confirm
our observations on linseed (Fig.1). In contrast, Kirkhus and
collaborators (2013) mentioned that the highest levels of C18:3
were obtained in camelina seeds when high temperatures and excessive rainfall were recorded before and during flowering and low rainfall and high temperature observed during seed filling and maturation period. In fact, lots of works indicated a regulation of omega-3 desaturases enzymes dependent on the growth temperature. At low temperature, the transcription of fatty acid desaturase genes (FAD) in various organs are shown
to be induced (Soto-Camposet al., 2014; Yurchenko et al.,
2014).
For protein content, year 2013 is significantly different
from years 2011 and 2012. Unfortunately, no data has been
reported in the literature excepted that the ratio lipid/protein
increased to low temperatures concomitantly with an increased
C18:3 level in phospholipid content (Behzadipour et al.,
1998). However, Roche in 2005 has clearly reported a positive
effect of high temperatures on the accumulation of proteins
in sunflower seeds when plants were cultured in greenhouse under controlled conditions. In our study, the temperatures
ob-served in 2011 (Tab.1: DDAF 1240◦C) during the seed filling
were higher than those recorded for 2012–2013 (Fig.1). This
could explain the high level of proteins in our flax seeds in 2011.
Starch content was also affected by year according to
ANOVA. Unfortunately, the Tukey had not evidenced any dif-ference between years. This could be attributed to the very
large variation in starch content observed in year 2013 (Fig.1).
Beyond these considerations about starch content, the very low absolute value of starch contents (below 0.3%) should be no-ticed. In oilseed embryos, starch is generally transiently syn-thetized in the early stages of seed development and then
trans-formed in lipids and proteins (Andriotiset al.,2010; Eastmond
and Rawsthorne,2000; Troufflard,2004; Streb and Zeeman,
2012). In flax, the maxima of starch content occurs around
20/25 days after flowering and can be up to 0.015 mg/embryo.
At maturity stage, starch content of 0.002 mg/embryo are
re-ported (Troufflard,2004). So the variations of starch content
observed in this study could be attributed to different maturity
stage of the harvested seeds and/or to a varietal effect.
How-ever, starch content has varied in a very low range of values.
Considering cultivar effect, it was only noticed for lipid,
C18:3 and starch content. Tukey test has permitted to
high-light some special cultivars that are more likely to be diff
er-ent from other ones for lipid conter-ent (Fig.2). Thus cultivars
N03 and L04 have presented lipid contents significantly dif-ferent from several varieties (N02, N04, L03, L02, L06 and L04 for N03 cultivar and N01, N02, N03, N04, L01 and L05 for cultivars L04, respectively). For C18:3 content only N03
D
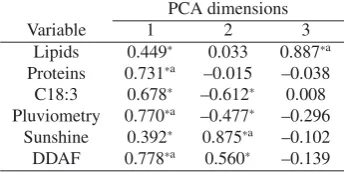
Table 4. Correlation coefficients between variables and PCA dimensions.
PCA dimensions
Variable 1 2 3
Lipids 0.449∗ 0.033 0.887∗a
Proteins 0.731∗a –0.015 –0.038
C18:3 0.678∗ –0.612∗ 0.008 Pluviometry 0.770∗a –0.477∗ –0.296
Sunshine 0.392∗ 0.875∗a –0.102
DDAF 0.778∗a 0.560∗ –0.139
∗Statistically significant correlation coefficient.aVariable with cos2
higher than 0.5.
−1.0 0.0 1.0
−1.0
0.0
1.0
Dim 1 (42.47%) Dim 2 (28.04%) C18.3
Proteins Sunshine Pluviometry DDAF C18.3 Proteins Sunshine Pluviometry DDAF C18.3 Proteins Sunshine Pluviometry DDAF C18.3 Proteins Sunshine Pluviometry DDAF C18.3 Proteins Sunshine Pluviometry DDAF C18.3 Proteins Sunshine Pluviometry DDAF C18.3 Proteins Sunshine Pluviometry DDAF C18.3 Proteins Sunshine Pluviometry DDAF C18.3 Proteins Sunshine Pluviometry DDAF
−1.0 0.0 1.0
−1.0
0.0
1.0
Dim 1 (42.47%)
Dim 3 (15.08%)
Lipids Proteins PluviometryDDAF Lipids Proteins PluviometryDDAF Lipids Proteins PluviometryDDAF Lipids Proteins PluviometryDDAF Lipids Proteins PluviometryDDAF Lipids Proteins PluviometryDDAF Lipids Proteins PluviometryDDAF Lipids Proteins PluviometryDDAF Lipids Proteins PluviometryDDAF
Fig. 4.Variables projection on PCA dimensions 1–2 and 1–3 (only
variables with cos2 >0.5 are presented).
cultivar seemed different from a large part of other cultivars
and for starch content, only difference between cultivars L02
and N01 has been noticed. As previously mentioned, the
culti-var effect is the major parameter affecting storage compounds
of flax seeds (McGregor and Carson,1961; Westcott and Muir,
1996; Vollmannet al., 2007). In our study, the flax cultivar
L04 seems to be highly interesting for its high lipid level in seeds.
According to ANOVA, culture location has only affected
the lipid and the starch contents of the seeds. However, the Tukey test realized on the lipid content results have not
ev-idenced a significant difference between mean lipid contents
observed in North and in South. For starch content, South has appeared more favorable for lower starch content indicating a higher maturity of the seeds.
3.3 Principal component analysis
In order to establish correlations between climatic grow-ing conditions and seeds composition, a principal component analysis (PCA) was performed using DDAF, pluviometry and sunshine hours as explicative variables in addition to
com-position variables affected by growing year (oil, proteins and
C18:3). Starch was not taken into account in this study due to the very low starch content in the seeds. The correlation
co-efficients defining the three PCA factors (explaining 85% of
observed variance) were presented in Table4and the
projec-tion of explicative variables on the PCA axis were on Figure4.
For projection, only variables with cos2higher than 0.5 were
represented for more readability. The projection axis were
de-scribed each by different variables. Indeed, dimension 3 was
only described by lipid content, dimension 2 mainly by sun-shine hours and dimension 1 by pluviometry, DDAF, protein
and C18:3 contents. From Figure4, the positive correlation
between pluviometry and C18:3 could be evidenced as well as the independence of lipid content from all studied variables. Positive correlation between DDAF and sunshine hour was also noticed. This last observation is quite normal as DDAF is a measure of the total heat available for vegetables during seed growing and, in temperate countries, sunshine hour and ambi-ent temperature evolves in a same way. Proteins contambi-ent was described by dimensions 1 and was correlated (but in a lesser extent than C18:3) with pluviometry and also DDAF. Roche in
2005 has clearly reported a positive effect of temperatures on
the accumulation of proteins in sunflower seeds when plants were cultured in greenhouse under controlled conditions.
During PCA treatment, the quantitative variables year, growing location and cultivars were added as supplementary variables. It has appeared that cultivar was significantly corre-lated with PCA dimension 3. The cultivars L04, L02 and N03 have shown projection on dimension 3 being significantly dif-ferent from 0, this projection was positive for L04 and L02 and negative for N03. So cultivars L04 and L02 have presented higher lipid contents than the overall cultivars whereas culti-var N03 had lower lipid content. The supplementary culti-variable growing location has been correlated with PCA dimension 2. South was positively correlated with dimension 2 and North negatively. So North was more rainy less sunny than south and C18:3 content was higher in North. In oilseed crops, the higher levels of polyunsaturated fatty acids are often observed when low temperatures occur during seed filling period (Dybing
and Zimmerman, 1965; Green,1986; Velasco and
Fernandez-Martinez,2002; Vollmannet al.,2007). Kirkhuset al.(2013)
have also shown that C18:3 content in camelina seeds could be
highly affected by the regime of precipitations. A period with
high rainfall during flowering and then low rainfall during seed filling contribute to favour the accumulation of C18:3 in seeds. Concerning PCA dimension 1, a correlation with growing year has been established. Year 2011 was statistically posi-tively correlated with axis 1 and year 2013 was negaposi-tively. So year 2011 has contained more proteins and C18:3 than year 2013 harvest. In 2011, the temperatures were high and contributed to accumulation of proteins and oil in flax seeds
(Tab.1, Fig.1). For this year, it has also been reported high
pluviometry during flax seed filling (Tab.1) that could explain
the high level of C18:3 in seeds and is in accordance with the
results of Kirkhus on camelina (Kirkhuset al.,2013).
A plot of active individuals according to PCA dimensions
was performed (Fig.5). This type of plot permits to distinguish
the individuals using supplementary variables as explaining factors. Clear distinction could be performed according to year and growing location in the projection plan using dimensions 1
and 2. For cultivars, distinction was more difficult and
−4 −3 −2 −1 0 1 2 3
−
2
−
1
0123
Dim.1 (42.47%)
Di
m.2
(28.04%
)
2011
2012
2013
−4 −3 −2 −1 0 1 2 3
−
2
−
1
0123
Dim.1 (42.47%)
Di
m.2
(28.04%
)
North
South
−3 −2 −1 0 1 2
−2
−1
0
1
2
Dim.2 (28.04%)
Di
m.3
(15.08%
)
L01
L02
L03 L04
L05
L06
N01
N02 N03
N04
Fig. 5.Individuals representation on PCA dimensions with confidence ellipses. Confidence ellipses are only represented for cultivars L02, L04
and N03.
Table 5.Fvalues and levels of significance of ANOVA of oil yield.
Factor Oil yield Cultivar 2.05NS
Year 30.02∗∗∗ Location 2.49NS
NS: non-significant;∗P<0.05;∗∗P<0.01;∗∗∗P<0.001.
As previously mentioned, these results indicate a clear im-pact of year on the quality of seeds (C18:3). The location
seems also to be a dominant source of variation (Fig.4). The
flax L02 and L04 lines are the best for their lipid and C18:3 contents whereas the N03 line has poor performance whatever
the culture conditions (Fig.5).
3.4 Oil expression
Oil expression was carried out on previously described seeds. The oil yield obtained was analyzed using the same sta-tistical methods as in the first part of this article. ANOVA con-ducted on oil yield has highlighted the significant impact of growing year whereas growing location and cultivar were not
significant (Tab.5). So extraction process was only dependent
(among studied variables) of growing year. This year effect on
oil expression was previously observed on linseed for pressing
seeds at different maturity stages (Savoire,2008). The absence
of cultivar impact on linseed oil expression is more surprising
as this effect has been largely described in the literature on
var-ious oilseeds species. This effect has notably been observed by
Dedio and Dorrell (1977) on unidirectional press and also by
Zhenget al.(2003) and Rombaut (2013) on continuous screw
presses.
The boxplot of mean oil yield according to year was
plot-ted in Figure6. Graphical interpretation of Figure6and Tukey
HSD test have permitted to evidence oil yield differences
be-tween year 2013 and years 2011–2012. In addition, oil yield for year 2013 has presented higher dispersions.
2011 2012 2013
55
60
65
70
75
80
year
pressing yield (%)
a a b
Fig. 6.Boxplots of year significant effect on oil yield.
In our study, year has a significant impact on storage
com-pounds (lipids, proteins) in seeds (Fig.1). It could be supposed
that a correlation between lipids and the extraction yield could exist.
From ANOVA results, cultivar and growing location had
no effect on oil yield. Despite the few study available on
culti-var effect on oil expression, all existing studies conclude to an
impact of cultivar on oil yield. Contrary to our results, Savoire
(2008) found an effect of cultivar on yield of linseed oil. Thus
among 14 varieties, only two stood out with a maximum and a
minimum yield. According to (Rombaut,2013; Savoire,2008;
Zheng et al.,2003), the reason for this variation can be
at-tributed to a negative correlation between oil yield and oil
con-tent of the seed, or to an effect of seed geometry. The absence
of cultivar effect in our study could be explained by the large
variation in oil yield observed for each cultivar. Indeed, for almost each studied cultivar, oil yield varied from 60 to 75% depending on year and growing location. So eventual cultivar
impact was hidden by year effect. Similar conclusion could be
D
−1.0 −0.5 0.0 0.5 1.0 −1.0 −0.5 0.0 0.5 1.0
Dim 1 (45.72%)
Dim 2 (26.97%)
Lipids C18. Proteins Yield Lipids C18. Proteins Yield Lipids C18. Proteins Yield Lipids C18. Proteins Yield Lipids C18. Proteins Yield Lipids C18. Proteins Yield Lipids C18. Proteins Yield Lipids C18. Proteins Yield Lipids C18. Proteins Yield
−1.0 −0.5 0.0 0.5 1.0
−1.0
−0.5
0.0
0.5
1.0
Dim 1 (45.72%)
Dim 3 (15.12%)
Lipids C18.3 Proteins Yield Lipids C18.3 Proteins Yield Lipids C18.3 Proteins Yield Lipids C18.3 Proteins Yield Lipids C18.3 Proteins Yield Lipids C18.3 Proteins Yield Lipids C18.3 Proteins Yield Lipids C18.3 Proteins Yield Lipids C18.3 Proteins Yield
Fig. 7.Variables projection on PCA dimensions 1–2 and 1–3 (PCA yield).
−4 −3 −2 −1 0 1 2 3
−3 −2 −1 0 1 2 Dim.1 (45.72%) Di m.2 (26.97% ) 2011 2012 2013
−4 −3 −2 −1 0 1 2 3
−3 −2 −1 0 1 2 Dim.1 (45.72%) Di m.2 (26.97% ) Centre Picardie
−4 −2 0 2
−3 −2 −1 0 1 2 Dim.1 (45.72%) Di m.2 (26.97% ) L01 L02 L03 L04 L05 L06 N01 N02 N03 N04
Fig. 8.Individuals representation on PCA dimensions (PCA yield).
formulated to explain the lack of significance of growing
loca-tion on oil yield. The effect of growing location on the oil yield
has not been widely studied. However in Dedio and Dorrell’s
study (1977) on linseed oil unidirectional expression, a
tion impact was noticed. In our study, the two growing loca-tion are only distant from 170 km, this two localoca-tion could be too close to evidence a strong growing location impact on seed post treatment.
As the growing year has impacted lipid, protein and C18:3
content (cf. Tab.3), the relation between these composition
variables and the oil yield was studied through PCA (In the fol-lowing, notably for table and figure, this PCA will be referred
as PCA yield). The correlation coefficients defining the three
PCA yield factors (explaining 87% of observed variance) are
presented in Table6and the projection of explicative variables
on the PCA axis are on Figure7. A strong correlation between
C18:3 content and oil yield has appeared through this PCA yield analysis. In axis 1 definition, the variables accounting for the majority of the contribution were oil yield and C18:3 content. So oil yield was highly dependent of C18:3 content and to a lesser extent from protein and lipid contents. Analysis of other dimensions have mainly highlighted the correlation between lipid and protein contents. So far there have been no studies linking the overall composition of the seed to the
ef-Table 6.Correlation coefficients between variables and PCA
dimen-sions (PCA yield).
PCA dimensions
Variable 1 2 3
Oil yield 0.822∗a –0.058 –0.281
Lipids 0.493∗ –0.728a∗ 0.475∗
C18:3 0.822∗a 0.061 –0.282∗
Proteins 0.485∗ 0.736a∗ 0.470
∗Statistically significant correlation coefficient.aVariable with cos2
higher than 0.5.
ficiency of pressing. One study was interested by the impact of linseed mucilage content on oil expression but no correla-tion between these particular molecule and process has been
established (Savoire,2008).
Individuals were plotted in the projection plan defined by the dimensions 1 and 2 of PCA; year, cultivar and growing
lo-cation were used as illustrative variables (Fig.8). Using year as
significantly linked to dimension 1. Years 2011 and 2012 were positively linked to dimension 1 and year 2013 negatively. In addition, cultivar N03 was also negatively linked to dimen-sion 1. The second dimendimen-sion was linked to cultivar (nega-tively with cultivars L04 and L02). For the third dimension, positive link with cultivar L04 and year 2013 was noticed and negative link with year 2012 and cultivar N01.
Correlation between oil yield and C18:3 content has been evidenced from PCA analysis. Physical interpretation of this correlation could not be found and it would be possible that a non-studied physical or biochemical factor is responsible for oil yield variations.
4 Conclusion
Growing year, location and cultivar effect on linseed
com-position has been studied. Year impact was mainly noticed on oil, C18:3 and protein content. Analysis of year impact through meteorological factors (pluviometry, sunshine and DDAF) has only permitted to evidence the pluviometry influ-ence on C18:3. For other biochemical factor, no link between their content in the seed and the meteorological growing condi-tions has been observed. Raw material impact on seed
process-ing (expression) has been evaluated and only year effect was
detected. Correlation between oil yield and C18:3 content has been noticed but no satisfactory explanation have been found. So the impact of cultivar and culture conditions on seed composition and transformation was evaluated. In this study, two flax lines (L02, L04) presented a robust behaviour with the best lipid and C18:3 content and one line (N03) a poor performance whatever the culture conditions (year, location). These two most stable lines could be exploited for industrial use.
Acknowledgements. The financial support of the Conseil Régional de Picardie (FUI project Granolin) and of the European Regional Devel-opment Fund (equipment acquired) is greatly acknowledged.
References
Adugna W, Labuschagne MT. 2002. Genotypes-environment inter-actions and phenotypic stability analysis of linseed in Ethiopia. Plant Breed.121: 66–71.
Adugna W, Labuschagne MT. 2003. Association of linseed characters and its variability in different environments.J. Agric. Sci.140: 285–296.
Adugna W, Labuschagne MT, Hugo A. 2004. Variability in oil content and fatty acid composition of Ethiopian and introduced cultivars of linseed.J. Sci. Food Agric.84: 601–607.
Akhtar S, Ismail T, Riaz M. 2013. Flaxseed – a miraculous defense against some critical maladies.Pak J. Pharm. Sci.26: 199–208. Andriotis VME, Pike MJ, Kular B, Rawsthorne S, Smith AM. 2010.
Starch turnover in developing oilseed embryos. New Physiol. 187: 791–804.
Baldini M, Giovanardi R, Tahmasebi-Enferadi S, Vannozzi GP. 2002. Effects of water regime on fatty acid accumulation and final fatty acid composition in the oil of standard and High oleic sunflower hybrids.Ital. J. Agron.6: 119–126.
Batta SK, Ahuja KL, Raheja RK, Labana KS. 1985. Variability in oil content and fatty acid composition in linseed (Linum usitatissi-mumL.).Ann. Biol.1: 80–85.
Behzadipour M, Ratajczak R, Faist K, Pawlistchek P, Trémolière A, Kluge M. 1998. Phenotypic adaptation of tonoplast fluidity to growth temperature in the CAM plant Kalanchoë daigremontiana ham. et Per. is accompanied by changes in the membrane phos-pholipid and protein composition.J. Membr. Biol.166: 61–70. Carlsson AS. 2009. Plant oils as feedstock alternatives to petroleum
– A short Survey of potential oil crop platforms.Biochimie91: 665–670.
Chandrawati, Maurya FR, Singh PK, Ranada SA, Yadav HK. 2014. Diversity analysis in India genotypes pf linseed (Linum usitatis-simumL.) using AFLP markers.Gene541: 171–178.
Dedio W, Dorrell DG. 1977. Factors Affecting the Pressure Extraction of Oil from Flaxseed.J. Am. Oil Chem. Soc.54: 313–315. Dilman AC, Hopper TH. 1943. Effect of climate on yield and oil
con-tent of flaxseed and iodine number of linseed oil.USDA Tech. Bull.844: 1–69.
Dybing CD, Zimmerman DC. 1966. Fatty acid accumulation in matu-rating flaxseeds as influenced by environment.Plant Physiol.41: 1465–1470.
Eastmond PJ, Rawsthorne S. 2000. Coordinate changes in carbon partitioning and plastidial metabolism during the development of oilseed rape embryos.Plant Physiol.122: 767–774.
FAOSTAT. 2014. Available at:http://faostat3.fao.org.
Fieldsend AF, Morison JIL. 2000. Climatic conditions during seed growth significantly influence oil content and quality in winter and spring evening primrose crops (Oenotheraspp.).Ind. Crops Prod.12: 137–147.
Flagella Z, Rotunno T, Tarantino E, Di Caterina R, De Caro A. 2002. Changes in seed yield and oil fatty acid composition of high oleic sunflower (Helianthus annuusL.) hybrids in relation to the sow-ing date and the water regime.Eur. J. Agron.17: 221–230. Floros MC, Leão AL, Narine SS. 2014. Vegetable Oil Derived
Solvent, and Catalyst Free “Click Chemistry” Thermoplastic Polytriazoles.BioMed. Res. Int.Article ID 792901.
Fofana B, Cloutier S, Ragupathy R. 2010. Flax lipids: classes, biosyn-thesis, genetics and the promise of applied genomics for under-standing and altering of fatty acids. Nova Science Publishers Inc. Froment MA, Smith JM, Freeman K. 1999. Influence of environmen-tal and agronomical factors contributing to increased levels of phospholipids in oil from UK linseedLinum usitatissinum. Ind. Crops Prod.10: 201–207.
Ghamkhar K, Croser J, Aryamanesh N, Campbell M, Kon’kova N, Clive F. 2010. Camelina(Camelina sativa(L.) Crantz) as an alter-native oilseed: molecular and ecogeographic analyses.Genome 53: 558–567.
Goyal A, Sharma V, Upadhay N, Gill S, Sihag M. 2014. Flax and flaxseed oil: an ancient medicine & modern functional food.J. Food Sci. Technol.51: 1633–1653.
Green AG. 1986. Effect of temperature during seed maturation on the oil composition of low linolenic genotypes of flax.Crop.Sci. 26: 961–965.
Guan LL, Wu W, Hu B, Li D, Chen JW, Hou K, Wang L. 2014. Developmental and growth regulation of omega-3 fatty acid de-saturase genes in safflower (Carthamus tinctorius L.). Genet. Mol. Res.13: 6623–6637.
Hall C, Tulbek MC, Xu Y. 2006. Flaxseed – Review.Adv. Food Nutr. Res. 51: 1–97.
Harris HC, Mc William JR, Mason WK. 1978. Influence of temper-ature on oil content and composition of sunflower seed.Aust. J. Agri. Res. 29: 1203–1212.
D
Hong J, Luo Q, Wan X, Petroviæ ZS, Shah BK. 2012. Biopolymers from vegetable oils via catalyst- and solvent-free “click" chem-istry: effect of cross-linking density.Biomacromolecules13: 261– 266.
Jhala AJ, Hall LM. 2010. Flax(Linum usitatissimumL.): current uses and future applications.Aust. J. Basic Appl. Sci. 4: 430–4312 Kirkhus B, Lundon AR, Haugen JE, Vogt G, Borge GIA, Henriksen
BIF. 2013. Effects of environmental factors on edible oil quality of organically grownCamelina sativa.J. Agric. Food Chem.61: 3179–3185.
Lafond GP, Irvine B, Johnston AM,et al.2008. Impact of agronomic factors on seed yield formation and quality in flax.Can. J. Plant Sci.88: 485–500.
Mc Gregor WG, Carson RB. 1961. Fatty acid composition of flax varieties,Can. J. Plant Sci.41: 814–817.
Meier MA, Metzger JO, Schubert US. 2007. Plant oil renewable re-sources as green alternatives in polymer science.Chem. Soc. Rev. 36: 1788–1802.
Painter EP, Nesbitt LL, Stoa TE. 1944. The influence of seasonal con-ditions on oil formation and changes in the iodine number during growth of flaxseed.J. Am. Soc. Agron. 36: 204–213.
Rahimi MM, Nourmohamadi Gh, Ayneband A, Afshar E, Moafpourian Gh. 2011. Study of effect of planting date and nitro-gen levels on yield, yield components and fatty acids of linseed (Linum usitatissimum L.).World Appl. Sci. J.12: 59–67. Rombaut N. 2013. Etude comparative de trois procédés d’extraction
d’huile: aspects qualitatifs et quantitatifs. Application aux graines de lin et aux pépins de raisin. Thèse de doctorat, Université de Technologie de Compiègne, p. 252.
Roche J. 2005. Composition de la graine de tournesol (Helianthus annuus L.) sous l’effet conjugué descontraintes agro-environnementales et des potentiels variétaux. Thèse de l’Institut National Polytechnique de Toulouse.
Savoire R. 2008. Etude multi-échelles de la separation solide-liquide dans la trituration du lin oléagineux. Thèse de doctorat, Université de Technologie de Compiègne, p. 217.
Savoire R, Lanoisellé JL, Ducatel H, Vorobiev E. 2008. Oil Yield and Compressibility Modeling during Microscale Expression: Criteria for Linseed Breeding.Eur. J. Lip. Sci. Tech.110: 725– 734.
Singh KK, Mridula D, Rehal J, Barnwa P. 2011. Flaxseed: a potential source of food, feed and fiber.Crit. Rev. Food Sci. Nutr. 51: 210– 222.
Soto-Cerda BJ, Duguid S, Booker H, Rowland G, Dierderichsen A, Cloutier S. 2014. Association mapping of seed quality traits us-ing the Canadian flax (Linum usitatissimumL.) core collection. Theor. Appl. Genet.127: 881–896
Steindal AL, Rødven R, Hansen E, Mølmann J. 2015. Effects of pho-toperiod, growth temperature and cold acclimatation on glycosi-nolates, sugars and fatty acids in kale.Food Chem.174: 44–51. Streb S, Zeeman SC. Starch metabolism in Arabidopsis. In:
Arabidopsis Book, American Society of Plant Biologists, 2012, vol. 10.
Thambugala D, Duguid S, Loewen E,et al. 2013. Genetic variation of six desaturase genes in flax and their impact on fatty acid com-position.Theor. Appl. Genet.126: 2627–2641.
Tonnet ML, Green AG. 1987. Characterization of the seed and leaf lipids of high and low linolenic acid flax genotypes.Arch. Biochem. Biophys.252: 646–654.
Trémoliére A, Dubacq JP, Drapier D. 1982. Unsaturated fatty acids in maturing seeds of sunflower and rape: regulation by temperature and high intensity.Phytochem.21: 41–45.
Tripathi R, Agrawal SB. 2013. Interactive effect of supplemented ul-tarviolet B and elevated ozone an seed yield and oil quality of two cultivars of linseed (Linum usitatissimumL.) carried out in open top chambers.J. Sci. Food Agric. 93: 1016–1025.
Troufflard S. 2004. Etude du métabolisme carboné dans l’embryon de lin oléagineux lors de l’accumulation des réserves lipidiques. Thèse de doctorat, Université de Picardie, p. 148.
USDA 2014, Oilseeds: World Markets and Trade. Available at:http:// apps.fas.usda.gov/psdonline/circulars/oilseeds.pdf.
Velasco L, Fernandez-Martinez JM. 2002. Breeding oilseed crops for improved oil quality. J. Crop Prod.5: 309–344.
Vereshchagin AG, Novitskaya GV. 1965. The triglyceride composi-tion of linseed oil.J. Am. Oil Chem. Soc.42: 970–974.
Vollmann J, Moritz T, Kargl C, Baumgartner S, Wagentristl H. 2007. Agronomic evaluation of camelina genotypes selected for seed quality characteristics.Ind. Crops Prod.26: 270–277.
Westcott N, Muir A. 1996. Variation in the concentration of the flaxseed lignin concentration with variety, location and year. In: Proc. of the Flax Institute of the United States, Fargo, ND: Flax Institute of the United States, Vol. 56, pp. 77–80.
Westcott N, Muir A. Chemical studies on the constituents ofLinum sp. In: Muir AD, Westcott ND (eds.). Flax the genusLinum. New York (USA): Taylor and Francis, 2003, pp. 55–73.
Yurchenko OP, Park S, Ilut DC,et al. 2014. Genome-wide analysis of the omega-3 fatty acid desaturase gene family inGossypium. BMC Plant Biol.14: 312–326.
Zheng YL, Wiesenborn DP, Tostenson K, Kangas N. 2003. Screw Pressing of Whole and Dehulled Flaxseed for Organic Oil.J. Am. Oil Chem. Soc.80: 1039–1045.
Zubr J, Matthaus B. 2002. Effects of growth conditions on fatty acids and tocopherols inCamelina sativaoil.Ind. Crops Prod.15: 155– 162.
Cite this article as:Raphaëlle Savoire, Melha-amel Lazouk, Elisabeth Van-Hecke, Romain Roulard, Reynald Tavernier, Xavier Guillot,