https://doi.org/10.5194/gmd-10-2333-2017 © Author(s) 2017. This work is distributed under the Creative Commons Attribution 3.0 License.
Modeling regional air quality and climate: improving organic
aerosol and aerosol activation processes in WRF/Chem version 3.7.1
Khairunnisa Yahya1, Timothy Glotfelty1, Kai Wang1, Yang Zhang1, and Athanasios Nenes2,3,4,5
1Department of Marine, Earth, and Atmospheric Sciences, North Carolina State University, Raleigh, NC, USA 2School of Earth and Atmospheric Sciences, Georgia Institute of Technology, Atlanta, GA, USA
3School of Chemical and Biomolecular Engineering, Georgia Institute of Technology, Atlanta, GA, USA
4Institute of Environmental Research & Sustainable Development, National Observatory of Athens, Athens, Greece 5Institute for Chemical Engineering Science, Foundation for Research and Technology-Hellas, Patra, Greece
Correspondence to:Yang Zhang ([email protected])
Received: 23 November 2016 – Discussion started: 6 December 2016 Revised: 16 May 2017 – Accepted: 18 May 2017 – Published: 27 June 2017
Abstract. Air quality and climate influence each other through the uncertain processes of aerosol formation and cloud droplet activation. In this study, both processes are im-proved in the Weather, Research and Forecasting model with Chemistry (WRF/Chem) version 3.7.1. The existing Volatil-ity Basis Set (VBS) treatments for organic aerosol (OA) formation in WRF/Chem are improved by considering the following: the secondary OA (SOA) formation from semi-volatile primary organic aerosol (POA), a semi-empirical for-mulation for the enthalpy of vaporization of SOA, and func-tionalization and fragmentation reactions for multiple gener-ations of products from the oxidation of VOCs. Over the con-tinental US, 2-month-long simulations (May to June 2010) are conducted and results are evaluated against surface and aircraft observations during the Nexus of Air Quality and Climate Change (CalNex) campaign. Among all the config-urations considered, the best performance is found for the simulation with the 2005 Carbon Bond mechanism (CB05) and the VBS SOA module with semivolatile POA treatment, 25 % fragmentation, and the emissions of semi-volatile and intermediate volatile organic compounds being 3 times the original POA emissions. Among the three gas-phase mech-anisms (CB05, CB6, and SAPRC07) used, CB05 gives the best performance for surface ozone and PM2.5 concentra-tions. Differences in SOA predictions are larger for the simu-lations with different VBS treatments (e.g., nonvolatile POA versus semivolatile POA) compared to the simulations with different gas-phase mechanisms. Compared to the tion with CB05 and the default SOA module, the
simula-tions with the VBS treatment improve cloud droplet num-ber concentration (CDNC) predictions (normalized mean bi-ases from−40.8 % to a range of −34.6 to −27.7 %), with large differences between CB05–CB6 and SAPRC07 due to large differences in their OH and HO2 predictions. An advanced aerosol activation parameterization based on the Fountoukis and Nenes (2005) series reduces the large neg-ative CDNC bias associated with the default Abdul Razzak and Ghan (2000) parameterization from−35.4 % to a range of −0.8 to 7.1 %. However, it increases the errors due to overpredictions of CDNC, mainly over the northeastern US. This work indicates a need to improve other aerosol–cloud– radiation processes in the model, such as the spatial distribu-tion of aerosol optical depth and cloud condensadistribu-tion nuclei, in order to further improve CDNC predictions.
1 Introduction
nu-clei (CCN). According to Hallquist et al. (2009), the forma-tion of inorganic particulates such as sulfate, nitrate, and am-monium are well understood; however, there are large uncer-tainties in the formation of secondary organic aerosol (SOA). As a result, current models do not have a comprehensive treatment of organic aerosol (OA), which usually result in an underprediction of OA concentrations (Hodzic et al., 2010; Jathar et al., 2011; Bergstrom et al., 2012), due to missing key precursors and processes in OA formation (Ahmadov et al., 2012). Some of the missing key precursors in most models include semi-volatile primary organic aerosol (POA), long-chainn-alkanes, polycyclic aromatic hydrocarbons, and large olefins that have lower volatilities compared to tradi-tional SOA precursors (Chan et al., 2009). Also, the organic carbon (OC) component of the radiative forcing in the IPCC AR5 report does not include SOA because the formation is dependent on a number of factors that are not currently suf-ficiently quantified (Myhre et al., 2013). However, SOA can form a significant percentage of total OA (up to 95 % in ru-ral areas) (Zhang et al., 2007). Another large source of un-certainty is the quantification of clouds as well as aerosol– cloud interactions due to incomplete or inaccurate represen-tations of these processes in climate models (Boucher et al., 2013). A major process in cloud formation from aerosol is aerosol activation, which involves the condensational growth of aerosols in a cooling air parcel until maximum supersat-uration, and some of the wet particles reach a critical radius where they are then able to grow spontaneously into cloud droplets (Ghan et al., 2011). Various approaches have been developed to reduce the uncertainties associated with OA and aerosol activation treatments in climate models. Those treat-ments are reviewed in the following section.
1.1 VBS treatments and sensitivity to different gas-phase chemical mechanisms in regional and global models
Unlike inorganic aerosols such as sulfate, the physical and chemical properties of OA dynamically evolve with age (Jimenez et al., 2009). The traditional approach to model-ing SOA is to assume that each VOC precursor forms several surrogate compounds (Odum et al., 1996). However, the tra-ditional method has several shortcomings, for example, two products are needed for each VOC precursor, causing this method to be computationally expensive if many VOC pre-cursors are treated in the model (Murphy and Pandis, 2009). The assumption that the products are unreactive also does not reflect the dynamic nature of the first-generation prod-ucts from the oxidation of VOCs that can undergo succes-sive oxidation steps to further produce lower volatility prod-ucts (Jimenez et al., 2009). The volatility basis set (VBS) is a framework developed by Donahue et al. (2006), which is able to simulate gas-phase partitioning and multiple genera-tions of gas-phase oxidation of organic vapors. This approach addresses the shortcomings of the traditional SOA modeling
approach as it can cover the complete volatility range of OA compounds (Murphy and Pandis, 2009).
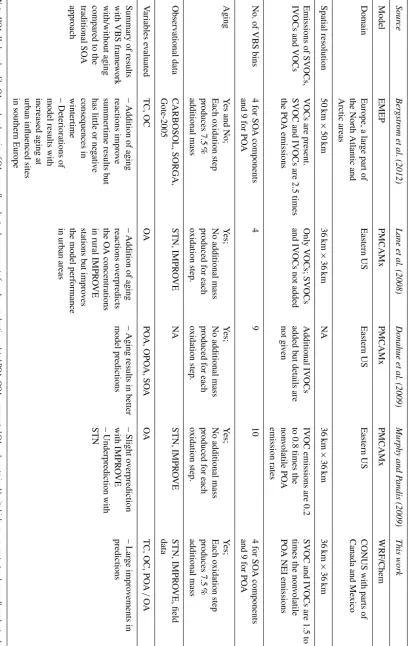
Table 1 summarizes some of the VBS treatments from current regional and global models. The VBS treatment has been implemented into a number of regional mod-els such as the Weather, Research and Forecasting model with Chemistry (WRF/Chem; Shrivastava et al., 2011; Ah-madov et al., 2012), the Particulate Matter Comprehensive Air Quality Model with extensions (PMCAMx; Lane et al., 2008; Donahue et al., 2009; Murphy and Pandis, 2009), and CHIMERE (Hodzic et al., 2010). It has also been imple-mented in global models such as GISS II’ GCM (Farina et al., 2010; Jathar et al., 2011) and the Community Earth Sys-tem Model (CESM; Shrivastava et al., 2015). Different stud-ies define the classifications of the organic specstud-ies slightly differently. Donahue et al. (2009) defined primary organic vapors with effective saturation concentrations (C∗) of 10−2– 10−1, 100–102, and 103–106µg m−3 at 298 K as volatility organic compounds (LVOCs), semi-volatile organic pounds (SVOCs), and intermediate volatility organic com-pounds (IVOCs), respectively. Shrivastava et al. (2011) and Jathar et al. (2011) defined primary organic vapors with
C∗ values of 10−2–103 and 104–106µg m−3 to be SVOCs and IVOCs, respectively. All those studies defined VOCs as gas-phase organic species withC∗larger than 106µg m−3at 298 K.
some studies such as Ahmadov et al. (2012) and Bergstrom et al. (2012) used the VBS approach for OA modeling but did not include additional SVOC emissions. There are also differences in the volatility distribution used in the literature. Shrivastava et al. (2008) and Jathar et al. (2011) found that moving half the mass of SVOC from all bins to the lowest bin from the traditional “diesel exhaust” volatility distribu-tion of Robinson et al. (2007) produced the lowest errors in simulated OA on an annual-average basis.
The number of bins used can also result in differ-ences in simulated SOA concentrations. Shrivastava et al. (2011) showed that the two-species VBS performed bet-ter than the nine-species VBS in modeling oxygenated or-ganic aerosol (OOA) and gave the closest agreement to the OOA calculated by the positive matrix factorization (PMF) method. This indicates that SOA may be less volatile com-pared to the volatility distribution in the nine-species VBS, which allows for evaporation of SOA with dilution (Shrivas-tava et al., 2011).
There are uncertainties in the amount of oxygen added for each oxidation step. This factor can influence the O : C ratio used for the model evaluation. O : C predic-tions from models need to be improved by including frag-mentation reactions (which could lead to an increase in O : C ratios) and improving emission estimates (Shrivas-tava et al., 2011). Different rate constants can also result in different predictions of SOA concentrations. For exam-ple, Farina et al. (2010) showed that the use of a k value of 1×10⁻¹²cm3molecule−1s−1 (compared to the default
k value of 10×10−12cm3molecule−1s−1) resulted in a re-duced aged SOA formation by 71 %. Hodzic et al. (2010) also showed a case study based on Grieshop et al. (2009) in which each oxidation step reduced the volatility of the SVOC and IVOC vapors by two orders of magnitude, and each successive oxidation step produced a 40 % increase in mass due to the addition of oxygen. This case is inconclusive in urban areas – a larger bias along with a higher correlation coefficient compared to the more common case where each oxidation step reduced the volatility by 1 order of magnitude with a 7.5 % increase in mass. However, the model performed worse (with larger bias and lower correlation coefficient) in suburban areas.
The aging process improves model performance in general in the United States (US) but deteriorates the performance in several parts of Europe. Accounting for the aging process of OA will increase the OA concentrations and improve model results in the US, where OA is usually underpredicted, but increase the model bias for OA in several parts of Europe, where OA concentrations are overpredicted (Farina et al., 2010; Bergstrom et al., 2012).
Shrivastava et al. (2013) studied the effects of the frag-mentation and functionalization in VBS. Functionalization increases the mass of OA for each successive oxidation step, while fragmentation reduces the mass for each oxidation step. One such case includes simulating first-order effects of
the fragmentation and functionalization processes in VBS by assuming functionalization of 100 % of organic vapors for the first two generations of oxidation and both fragmenta-tion and funcfragmenta-tionalizafragmenta-tion for the third and higher genera-tions of oxidation. The fragmentation reduces the SOA con-centrations drastically. For example, Shrivastava et al. (2013) showed that peak SOA concentrations can be reduced by factors of 2 to 4 for a 1 h example on 10 March 2006 at 21:00 UTC over the Mexico City Plateau.
The VBS framework for OA modeling in the latest ver-sion of WRF/Chem, v3.7.1, is coupled with several gas-phase mechanisms including the 2005 Carbon Bond Mech-anism (CB05; Yarwood et al., 2005), the Model for Ozone and Related chemical Tracers version 4 (MOZART-4; Em-mons et al., 2010), the Regional Atmospheric Chemistry Model (RACM; Stockwell et al., 1997), and the 1999 version of the Statewide Air Pollution Research Centre (SAPRC99) mechanism (Carter, 2000). Different gas-phase mechanisms have different lumpings or groupings for VOCs, which will affect OA formation. For example, VOCs are lumped ac-cording to their carbon bonds (e.g., single or double bond) in CB05 (Yarwood et al., 2005) while VOCs in SAPRC99 (Carter, 2000) are lumped according to their OH reactivi-ties. A number of studies examined the differences in pre-dicting O3concentrations due to different gas-phase mecha-nisms (e.g., Luecken et al., 2008; Li et al., 2012; Shearer et al., 2012; Zhang et al., 2012), but fewer studies reported the impact of different gas-phase mechanisms on modeling SOA and PM2.5 concentrations (Kim et al., 2011; Zhang et al., 2012). SAPRC99 has more detailed organic chemistry com-pared to CB05. SAPRC99 has been updated to SAPRC07 (and recently, to SAPRC11) based on newly available infor-mation regarding the reactions and influence of individual VOCs on O3, as well as evaluations against chamber ex-periments (Carter, 2010). In addition, SAPRC07 has refor-mulated reactions of peroxy radicals so that the effects of changes in nitrogen oxides (NOx) on organic product
for-mation is more accurately represented. SAPRC07 has the most extensive set of VOC species and reactions, compared to CB05 and the Carbon Bond version 6 (CB6). Shearer et al. (2012) reported that a condensed version of SAPRC07 predicted lower O3and OH concentrations in central Califor-nia compared to SAPRC99 due to a decreased reaction rate coefficient in the reaction of OH and NO2 to form HNO3. Li et al. (2012) also showed that predicted O3 concentra-tions from SAPRC07 were lower than those of SAPRC99 by up to 20 % over Texas. The same study also reported that SAPRC07 gave lower OH concentrations due to differences in the reaction rate constants in the reactions of O1D and H2O between SAPRC07 and SAPRC99. Luecken et al. (2008) re-ported that SAPRC99 gave higher O3 concentrations com-pared to CB05 on average; however, the differences vary with locations, VOC/NOx ratios, and the concentrations
us-ing WRF/Chem with the Model of Aerosol, Dynamics, Re-action, Ionization and Dissolution (WRF/Chem-MADRID) produced the highest O3mixing ratios in July at the South-eastern Aerosol Research and Characterization (SEARCH) sites. The CB6 (Yarwood et al., 2010) is an updated version of CB05, with improved kinetic and photolysis data; addi-tional explicit species for long-lived and abundant organic compounds including propane, acetone, benzene, and acety-lene; and revised isoprene and aromatics chemistry from CB05. Yarwood et al. (2010) showed that CB6 produces higher daily maximum 8 h O3compared to CB05 over Los Angeles for one episode day in August with the highest ob-served O3 mixing ratios. CB6 was also shown to produce substantially higher OH concentrations (25 to 50 % higher at midday over large areas) over the eastern US compared to CB05 over a few days in June 2006. A summary of the main characteristics of CB05, CB6, and SAPRC07 gas-phase mechanisms are listed in Table 2.
1.2 Description of aerosol activation parameterizations
Ghan et al. (2011) provided a comprehensive review on var-ious aerosol activation treatments in current climate models. Two main types of parameterizations are commonly used: the Abdul-Razzak and Ghan (2000; AR-G00) and the Foun-toukis and Nenes (2005; FN05) and associated updates de-scribed in Barahona et al. (2010) and Morales Betancourt and Nenes (2014). AR-G00 uses multiple lognormal or sec-tional distributions to approximate the aerosol size distri-bution. It uses the Kohler theory to relate the aerosol size distribution and composition to the number of aerosols acti-vated as a function of maximum supersaturation (Smax). The complex function involvingSmaxis parameterized based on the standard deviation σ from a large number of numeri-cal solutions using a cloud parcel model. The number and mass activated are particles with critical supersaturation less than Smax. It also accounts for particle growth before and after the particles are activated. However, the Abdul Raz-zak and Ghan (2000; ARG00) treatment does not explicitly represent kinetic limitations which tend to affect smaller or larger particles (with diameters far from their critical size). Very small particles tend to lose water when supersaturation declines, as they never exceed the critical supersaturation for that particle size, and very large particles may not have achieved the critical size beforeSmaxis reached (Ghan et al., 2011). Kinetic limitations refer to the (i) inertial mechanism – where particles with large dry diameters grow to be as large as activated particles but have not been activated themselves, these particles should be considered together with activated particles; (ii) evaporation mechanism – where particles with high critical supersaturation evaporate before reaching their critical diameters; and (iii) deactivation mechanism – where initially activated particles that are deactivated to intersti-tial aerosols when the parcel supersaturation falls below the equilibrium supersaturation (Nenes et al., 2001). Neglecting
kinetic limitations performs well for all conditions except in highly polluted areas (Ghan et al., 2011). In urban and highly polluted cases, many particles fail to be activated due to strong evaporation and deactivation processes (Nenes et al., 2001). Explicitly accounting for kinetic limitations re-duces CDNC at low updraft velocity (Ghan et al., 2011).
The FN05 scheme improved the ARG00 scheme by solv-ing Smax analytically (with the exception of kinetically limited particles) using a so-called “population splitting” method. In addition, FN05 took into account the kinetic lim-itations, as well as the influence of gas kinetics on water va-por diffusivity (Ghan et al., 2011). The other improved treat-ments built on top of the FN05 scheme include the entrain-ment of ambient air, which could reduce the supersaturation of the updraft (Barahona and Nenes, 2007; BN07), therefore reducing CDNC; the adsorption of water vapor onto insolu-ble particles by Kumar et al. (2009; KU09) based on a modi-fied Frenkel–Halsey–Hill (FHH) adsorption theorem (which will increase CDNC); the growth of giant cloud condensation nuclei (CCN) (Barahona et al., 2010, BA10) by introducing an additional condensation rate term to account for conden-sation of giant CCN (which will reduce CDNC); as well as the modification of the original population splitting concept in FN05 and BA10 by Morales Betancourt and Nenes (2014; MN14) by better accounting for the size of inertially limited CCN, and removing a discontinuity in the calculation of the surface area of cloud droplets.
The parameterization of Abdul Razzak and Ghan (2000) (ARG00) is used as the default aerosol activation module in WRF/Chem. It is not linked to the microphysics module or cumulus parameterization in WRF or WRF/Chem. However, for WRF/Chem, the CDNC gen-erated in ARG00 is passed to the microphysics scheme, i.e., the Morrison two-moment microphysics scheme selected in this work.
1.3 Motivations and objectives
OA predictions on CDNC in WRF/Chem will be quantified. The second objective is to incorporate an improved aerosol activation parameterization based on the FN05 series into WRF/Chem to study its impacts on CDNC predictions.
2 Model configuration, evaluation protocol, and observational datasets
2.1 Model setup and inputs
The model used in this study is a modified version of WRF/Chem v3.7.1 as described by Wang et al. (2015). The 2005 Carbon Bond gas-phase mechanism (CB05) of Yarwood et al. (2005), with additional chlorine chemistry, is coupled with the Modal for Aerosol Dynamics in Europe – Secondary Organic Aerosol Model (MADE/SORGAM) (Anchorman et al., 1998; Schell et al., 2001) and the Volatil-ity Basis Set (MADE/VBS) (Ahmadov et al., 2012). The CB05-VBS option has also been coupled to existing model treatments including the aerosol direct effect, the aerosol semidirect effect on photolysis rates of major gases, and the aerosol indirect effect on CDNC and resulting impacts on shortwave radiation. The physics options used in WRF/Chem include the rapid and accurate radiative transfer model for GCM (RRTMG) for both shortwave and long-wave ra-diation, the Yonsei University (YSU) planetary boundary layer (PBL) scheme (Hong et al., 2006; Hong, 2010), the Morrison et al. (2009) double moment microphysics scheme, as well as the multi-scale Kain–Fritsch (MSKF) cumulus pa-rameterization scheme (Zheng et al., 2016). Aqueous-phase chemistry module (AQCHEM) for both resolved and con-vective clouds is based on a similar AQCHEM module in CMAQv4.7 from Sarwar et al. (2011). The anthropogenic emissions used are from the 2010 emissions based on the 2008 US Environmental Protection Agency (US EPA) Na-tional Emissions Inventory (NEI) from the Air Quality Model Evaluation International Initiative (AQMEII) project (Pouliot et al., 2015). Dust emissions are based on the Atmospheric and Environmental Research Inc. and Air Force Weather Agency (AER/AFWA) scheme (Jones and Creighton, 2011). Emissions from sea salt are generated based on the scheme of Gong et al. (1997). Biogenic emissions are simulated on-line by the Model of Emissions of Gases and Aerosols from Nature v2.1 (MEGAN2.1) (Guenther et al., 2006).
The chemical initial and boundary conditions (ICONs and BCONs) come from the modified CESM/CAM version 5.3 with updates by Gantt et al. (2014), He and Zhang (2014), and Glotfelty et al. (2017). The meteorological ICONs and BCONs are from the National Center for Environmental Protection Final Reanalyses (NCEP FNL) dataset, which is available every 6 h. The chemical fields are also allowed to run continuously while the meteorology is reinitialized every 5 days. The simulations are performed at a horizontal res-olution of 36 km with 148×112 horizontal grid cells over
the CONUS domain and parts of Canada and Mexico, and a vertical resolution of 34 layers from the surface to 100 hPa.
A number of sensitivity simulations are designed to iden-tify the model configuration with results that are in the closest agreement to observations as well as the realistic model treat-ments of OA that are the closest to atmospheric processes. The baseline and sensitivity simulations are conducted from May to June 2010, during which the Nexus of Air Quality and Climate Change (CalNex) campaign was held in Bakers-field and Pasadena, California. The first 10 days, from 1 to 10 May, are considered to be the spin-up period.
2.2 Model evaluation protocol and available measurements
Bak-ersfield, CA, and Pasadena, CA, which are both urban lo-cations. The Bakersfield sampling site is located between the city center and areas of agricultural activity, while the Pasadena site is located at the California Institute of Tech-nology campus between the Los Angeles metropolitan area to the southwest and mountains in the north (Baker et al., 2015).
POA/OA ratios are also used to evaluate the performance of the model. A number of studies have reported observed POA/OA ratios which range from 15 to 40 % over CONUS. For example, over the southeastern US, hydrocarbon-like OA (HOA) and cooking OA are found to contribute to 21– 38 % of total OA in urban sites (Xu et al., 2015). HOA and oxygenated OA (OOA) are found to account for 34 and 66 % of measured OA from Pittsburgh in September 2002 (Zhang et al., 2005). HOA and cooking OA are assumed to be syn-onymous with POA, and OOA is assumed to be synsyn-onymous with SOA. Particulate matter sampled during August and September 2006 in Houston as part of the Texas Air Quality Study II Radical and Aerosol Measurement Project showed that approximately 32 % of OA comes from HOA (Cleve-land et al., 2012). Results from positive matrix factoriza-tion analysis from the Pasadena ground site during May and June 2010 showed that the primary components contribute 29 % of the total OA mass (Hayes et al., 2013). Based on Zhang et al. (2007), the percentages of HOA mass at urban sites in Riverside, CA, from mid-July to mid-August 2005, in Houston, TX, from mid-August to mid-September 2000, and in New York City in July 2001 are 15, 38, and 30 %, re-spectively. In addition, Zhang et al. (2011) compiled a large number of field campaigns across the globe where the aver-age POA/OA ratios for urban, downwind, and rural/remote areas are found to be 0.42, 0.18, and 0.10 respectively.
For the aerosol activation sensitivity and production sim-ulations, additional variables that will be analyzed in this study include maximum 1 h and 8 h O3 against the Clean Air Status and Trends Network (CASTNET) and Air Quality System (AQS), aerosol optical depth (AOD), CDNC, CCN against MODIS.
3 Model development and improvement
A number of modifications have been made to the standard version of WRF/Chem model v3.7.1. Those modifications and treatments are described below.
3.1 OA treatments
The CB05-VBS treatment in the default WRF/Chem v3.7.1 assumes that POA is nonreactive and nonvolatile. In this study, POA is assumed to be semivolatile, and can un-dergo gas-particle partitioning, similar to anthropogenic SOA (ASOA) and biogenic SOA (BSOA) in VBS. While the volatility of ASOA and BSOA is represented by 4 bins
with C∗ from 100 to 103µg m−3, the POA is distributed into 9 bins, withC∗from 10−2to 106µg m−3, following the set-up of Shrivastava et al. (2011). The POA is oxidized to form semi-volatile OA, which can also undergo gas-particle partitioning. For the POA, bin-resolved enthalpies of vapor-izations are used, ranging from 64 kJ mol−1for the 9th bin to 112 kJ mol−1for the 1st bin according to Shrivastava et al. (2011). The default enthalpy of vaporization (Hvap) for SOA in WRF/Chem is 30 kJ mol−1 according to Lane et al. (2008). A more accurate alternative is to use theHvap val-ues calculated from the semi-empirical correlation from Ep-stein et al. (2010):
Hvap= −11log10C
∗
300+129. (1)
The values ofHvapfrom Epstein et al. (2010) are used in a number of sensitivity simulations and final production simu-lation.
Shrivastava et al. (2013, 2015) also implemented several cases of fragmentation and functionalization (FF) processes into VBS. For this study, the FF set-up is similar to the method employed by Shrivastava et al. (2013), with the ex-ception that fragmentation percentages of 10, 25, and 50 % are used in sensitivity simulations. Shrivastava et al. (2013) used fragmentation percentages of 50 % (intermediate frag-mentation) and 85 % (high fragfrag-mentation) in his simulations over Mexico City. For example, for the 10 % FF case, 10 % of the mass in the VBS species is functionalized and moved to the next lower volatility bin, 80 % is fragmented and moved to the highest volatility bin, and the remaining 10 % is frag-mented and becomes more volatile than the highest volatility bin (i.e., it is lost from the current volatility bins). For the 50 % FF case, 50 % is functionalized and moved to the next lower volatility bin, 40 % is fragmented and moved to the highest volatility bin, and 10 % is lost.
Zhao et al. (2014) measured IVOCs in Pasadena, CA, dur-ing CalNex and found that the concentrations of primary IVOCs are similar to those of single-ring aromatics, and they produce about 30 % of newly formed SOA in the afternoon. With the semivolatile POA and FF cases in this study, addi-tional IVOC and SVOC emissions are added as values that are 3 times as large as the traditional POA emissions from NEI, to account for missing IVOC and SVOC species in the traditional POA emission inventory. The fraction of IVOC and SVOC emissions assigned to each volatility bin is sum-marized in Table 3.
Table 3.Factors to calculate SVOC and IVOC emissions from POA emissions from Shrivastava et al. (2011) and May et al. (2013a, c) and newly calculated factors for this study.
Log Ci∗ Normalized Fraction Fraction New calculated
at 298 K fraction for for gasoline for biomass fraction for
stationary emissions burning all sources
emissions from May emissions based on
based on et al. from May Shrivastava
anthropogenic (2013a) et al. et al. (2011),
emissions from (2013c) May et al.
Shrivastava (2013a, c), and %
et al. (2011) distribution
of NEI emissions
−2 0.04 0.14 0.2 0.1754
−1 0.02 0.13 0.0 0.0141
0 0.03 0.15 0.1 0.0961
1 0.05 0.26 0.1 0.1084
2 0.07 0.15 0.2 0.1799
3 0.11 0.03 0.1 0.0949
4 0.16 0.02 0.3 0.258
5 0.20 0.01 0.0 0.0249
6 0.32 0.11 0.0 0.0483
and the percentages of VOC emissions from various sources from the 2008 NEI. According to the 2008 NEI report (Rao et al., 2013), total VOC emissions from stationary, mobile, and fire (prescribed and wildfire) sources are ∼7.6, ∼5.6, and ∼49.6 million t, respectively. The corresponding per-centages for VOC emissions are∼12,∼9, and∼79 % for stationary, mobile, and fire sources, respectively. Based on the US EPA (2013), the percentages of diesel emissions from mobile sources are low compared to those from gasoline sources (∼7 % of total diesel and gasoline sources); they are thus not included in this study.
An example calculation for the mass fraction of the lowest volatility bin for POA and IVOC and SVOC emissions are as follows:
logC∗−2(at 298 K)=0.04×12 %+0.14×9 %
+0.2×79 %=0.1754, (2)
where C−∗2 refers to the lowest volatility bin with a value of 10−2µg m−3; 12, 9, and 79 % refer to the percentages for VOC emissions from stationary, mobile, and fire sources, re-spectively, from NEI; 0.04 refers to the original mass frac-tion for stafrac-tionary emissions based on anthropogenic emis-sions from Shrivastava et al. (2011) for the lowest volatility bin with a value of 10−2µg m−3; 0.14 refers to the original mass fraction for gasoline emissions from May et al. (2013a) for the lowest volatility bin with a value of 10−2µg m−3; 0.2 refers to the original mass fraction for biomass burning emissions from May et al. (2013c) for the lowest volatility bin with a value of 10−2µg m−3; and 0.1754 refers to the newly calculated mass fraction of POA and IVOC and SVOC emissions for this study. The mass fractions used by
Shrivas-tava et al. (2011), May et al. (2013a, c), and this work can be found in Table 3.
3.2 Gas-phase chemical mechanisms
Three gas-phase mechanisms are used: CB05, CB6, and SAPRC07. The gas-phase mechanisms for CB6 and SAPRC07 are coupled to the MADE/VBS in WRF/Chem v3.7.1 in this work following the coupling of CB05 with MADE/VBS by Wang et al. (2015). The emissions for all cases are based on the CB05 chemical species from the 2010 emissions based on the 2008 NEI. For SAPRC07, slight modifications had to be made to ac-count for the different VOC species or groups. The map-ping of emission species from CB05 to SAPRC07 is based on the grouping of species from emitdb.xls from Hender-son et al. (2014) as well as from http://www.cert.ucr.edu/ ~carter/emitdb/old-emitdb.htm. CB05 emissions are used for the CB6 case, with the exception of the VOCs including propane, benzene, ethyne, acetone, and ketone, which are mapped based on fractions of existing CB05 VOCs accord-ing to Yarwood et al. (2010).
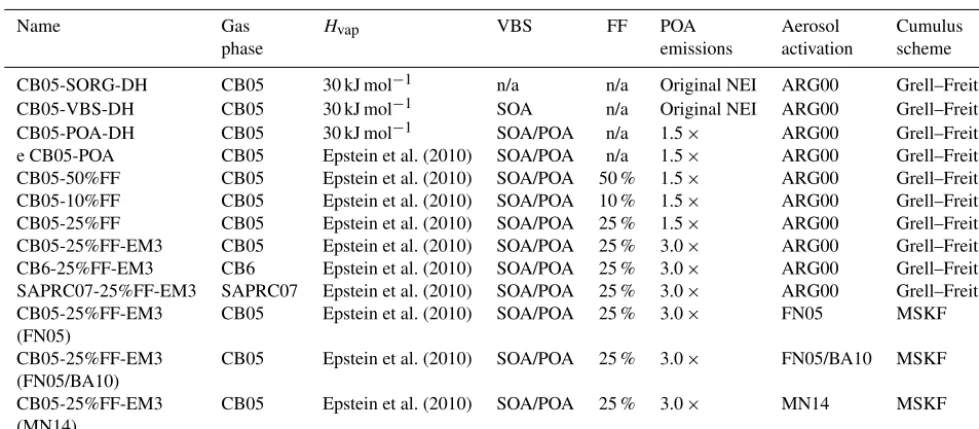
im-Table 4.Configurations for OA and aerosol activation sensitivity simulations. All simulations except for CB05-SORG-DH contain the VBS treatments for OA.
Name Gas Hvap VBS FF POA Aerosol Cumulus
phase emissions activation scheme
CB05-SORG-DH CB05 30 kJ mol−1 n/a n/a Original NEI ARG00 Grell–Freitas
CB05-VBS-DH CB05 30 kJ mol−1 SOA n/a Original NEI ARG00 Grell–Freitas
CB05-POA-DH CB05 30 kJ mol−1 SOA/POA n/a 1.5× ARG00 Grell–Freitas
e CB05-POA CB05 Epstein et al. (2010) SOA/POA n/a 1.5× ARG00 Grell–Freitas
CB05-50%FF CB05 Epstein et al. (2010) SOA/POA 50 % 1.5× ARG00 Grell–Freitas
CB05-10%FF CB05 Epstein et al. (2010) SOA/POA 10 % 1.5× ARG00 Grell–Freitas
CB05-25%FF CB05 Epstein et al. (2010) SOA/POA 25 % 1.5× ARG00 Grell–Freitas
CB05-25%FF-EM3 CB05 Epstein et al. (2010) SOA/POA 25 % 3.0× ARG00 Grell–Freitas
CB6-25%FF-EM3 CB6 Epstein et al. (2010) SOA/POA 25 % 3.0× ARG00 Grell–Freitas
SAPRC07-25%FF-EM3 SAPRC07 Epstein et al. (2010) SOA/POA 25 % 3.0× ARG00 Grell–Freitas
CB05-25%FF-EM3 CB05 Epstein et al. (2010) SOA/POA 25 % 3.0× FN05 MSKF
(FN05)
CB05-25%FF-EM3 CB05 Epstein et al. (2010) SOA/POA 25 % 3.0× FN05/BA10 MSKF
(FN05/BA10)
CB05-25%FF-EM3 CB05 Epstein et al. (2010) SOA/POA 25 % 3.0× MN14 MSKF
(MN14)
The suffix “DH” in the case names refers to cases with the defaultHvapof 30 kJ mol−1, otherwise with the semi-empirical correlation by Epstein et al. (2010). The simulations
without the suffix “POA” or “FF” indicate cases with nonvolatile default POA emissions. The suffix “POA” in the case names refers to cases with semivolatile POA. The suffix “FF” in the case names refers to cases with semivolatile POA and with fragmentation and functionalization treatments, and the suffix “EM3” in the case names refers to cases with 3 times the original NEI POA emissions to take into account for missing SVOC and IVOC species. “n/a” indicates not applicable.
plemented in WRF/Chem in this case is the uncondensed and expanded version C, which includes reactions for per-oxy radical operators (Carter, 2010). Species in both CB6-MADE/VBS and SAPRC07-CB6-MADE/VBS undergo dry de-position, aqueous chemistry, photolysis, and wet scavenging that are similar to CB05-MADE/VBS.
3.3 Aerosol activation
The FN05 series aerosol activation parameterizations (with the exclusion of MN14) have been incorporated into 3-D regional air quality models and global climate and Earth system models such as the WRF Community Atmosphere Model version 5 (WRF-CAM5) (Zhang et al., 2015), and in the global-through-urban WRF/Chem (GU-WRF/Chem) (Zhang et al., 2012) and CESM (Gantt et al., 2014). In this study, the FN series parameterizations are incorporated into WRF/Chem following the methods of Gantt et al. (2014) and Zhang et al. (2015), as described in detail in Zhang et al. (2015). However, in WRF/Chem, the aerosol activation module is only linked to the microphysics module through the variable CDNC, which is read by the microphysics mod-ule. It is not coupled to the cumulus parameterization scheme unlike in WRF-CAM5 and CESM. The FN05 series has been incorporated into module_mixactivate.F in the physics direc-tory in WRF/Chem. As BN07 involves the entrainment effect for convective clouds and has very small impacts on noncon-vective CDNC (Zhang et al., 2015), it is not included in this study. In addition, unlike Gantt et al. (2014) and Zhang et al. (2015), the KU09 treatment is also not included in this
study because the empirical constantsAFHHandBFHHused in the formulation, which are compound-specific, have not been experimentally determined for black carbon, although those constants have been determined for dust and confirmed by Laaksonen et al. (2016). The additional MN14 treatment incorporated in this study involves a small modification to the original FN05 series parameterizations (without KU09), and helps to better account for the size of inertially limited CCN, and to remove a discontinuity in the calculation of the sur-face area of cloud droplets (Morales Betancourt and Nenes, 2014). The updated treatments are about 20 % more compu-tationally expensive to run compared to ARG00 (Zhang et al., 2015), but capture the sensitivity of CDNC to all aspects of the aerosol with comparable accuracy to numerical par-cel models, which was shown to be an underlying reason for biases from ARG (Morales Betancourt and Nenes, 2014).
4 Results and discussions
4.1 Sensitivity simulations with VBS treatments coupled with CB05
Table 5.Range of statistics for OA/OC ratios of 1.4 and 2.1 (1.4/2.1) for May to June 2010. All simulations use the ARG00 aerosol activation scheme and the Grell–Freitas cumulus parameterization.
Case Mean Obs Mean Sim Corr NMB (%) NME (%)
OC against IMPROVE
CB05-SORG-DH 0.88 0.28/0.19 0.26 −68.1/−78.7 73.9/80.9
CB05-VBS-DH 0.88 1.19/0.79 0.51 34.9/−10.1 75.5/52.3
CB05-POA-DH 0.88 0.89/0.59 0.51 1.1/−32.6 52.4/59.0
CB05-POA 0.88 1.05/0.70 0.51 18.9/−20.7 63.2/49.2
CB05-10%FF 0.88 1.05/0.70 0.51 19.4/−20.4 63.0/49.1
CB05-25%FF 0.88 0.86/0.57 0.49 −2.9/−35.2 54.6/51.4
CB05-50%FF 0.88 0.56/0.37 0.45 −36.4/−57.6 54.4/62.6
CB05-25%FF-EM3 0.88 1.09/0.73 0.47 23.8/−17.5 65.9/50.2
CB6-25%FF-EM3 0.88 1.06/0.71 0.48 20.5/−19.6 49.4/63.7
SAPRC07-25%FF-EM3 0.88 1.00/0.67 0.46 13.3/−24.4 60.1/50.4
TC against IMPROVE
CB05-SORG-DH 1.03 0.44/0.34 0.30 −57.6/−66.7 67.9/72.3
CB05-VBS-DH 1.03 1.34/0.94 0.52 30.6/−8.0 70.3/51.1
CB05-POA-DH 1.03 1.13/0.83 0.52 10.2/−18.7 58.5/48.7
CB05-POA 1.03 1.29/0.94 0.53 25.6/−8.5 63.8/48.3
CB05-10%FF 1.03 1.29/0.94 0.53 25.9/−8.2 63.8/48.2
CB05-25%FF 1.03 1.09/0.83 0.51 6.8/−21.6 55.2/48.2
CB05-50%FF 1.03 0.80/0.61 0.47 −22.0/−40.2 50.8/53.4
CB05-25%FF-EM3 1.03 1.32/0.97 0.49 29.7/−5.7 50.7/66.9
CB6-25%FF-EM3 1.03 1.30/0.95 0.50 27.2/−7.3 65.2/50.0
SAPRC07-25%FF-EM3 1.03 1.23/0.90 0.48 20.6/−11.9 61.4/49.4
TC against STN
CB05-SORG-DH 2.71 1.34/1.10 0.29 −50.6/−59.4 60.1/64.9
CB05-VBS-DH 2.71 3.35/2.44 0.47 23.7/−5.8 53.1/42.0
CB05-POA-DH 2.71 2.88/2.19 0.47 6.2/−19.0 45.5/41.6
CB05-POA 2.71 3.03/2.30 0.46 11.7/−15.3 44.6/39.9
CB05-10%FF 2.71 3.03/2.30 0.46 11.8/−15.3 44.5/39.8
CB05-25%-FF 2.71 2.66/2.05 0.44 −1.8/−24.3 41.5/42.0
CB05-50%-FF 2.71 2.07/1.65 0.39 −3.8/−39.1 43.9/49.4
CB05-25%FF-EM3 2.71 3.27/2.45 0.41 20.5/−9.5 49.7/41.7
CB6-25%FF-EM3 2.71 3.39/2.45 0.34 24.9/−6.4 54.8/45.5
SAPRC07-25%FF-EM3 2.71 3.00/2.28 0.41 10.7/−16.1 45.2/42.0
versus the semi-empirical Hvap equation by Epstein et al., 2010), (iv) three different percentages of FF (10, 25, and 50 %), (v) three sets of POA emissions (default versus 1.5 or 3 times the original NEI POA emissions), (vi) three differ-ent gas-phase mechanisms (CB05, CB6, and SAPRC07), and (vii) two different aerosol activation schemes (ARG00 versus combinations of different aerosol activation schemes of the FN05 series: FN05, FN05/BA10, and MN14) All simulations except for CB05-SORG-DH contain the VBS treatments for OA. CB05-SORG-DH and CB05-VBS-DH treat POA emis-sions as nonvolatile. In addition, the impact of two different cumulus parameterization schemes: Grell–Freitas (Grell and Freitas, 2014) and the MSKF (Zheng et al., 2016) scheme were also tested.
K. Yahya et al.: Improving organic aerosol and aerosol activation processes in WRF/Chem version 3.7.1 2345
0.0 0.2 0.4 0.6 0.8 1.0 1.2 1.4
CB05_SORG_DH CB05_VBS_DH CB05_POA_DH CB05_POA CB05_FF10% CB05_FF25% CB05_FF50% CB05_FF25%_EM3 CB6_FF25%_EM4 SAPRC07_FF25%_EM5
O
C
co
n
cen
tr
a
ti
on
s
(
m
g
m
-3)
OC concentrations at IMPROVE sites
OA / OC = 1.4 OA / OC = 2.1
Obs = 0.88 mg m-3
0.0 0.2 0.4 0.6 0.8 1.0 1.2 1.4 1.6
CB05_SORG_DH CB05_VBS_DH CB05_POA_DH CB05_POA CB05_FF10% CB05_FF25% CB05_FF50% CB05_FF25%_EM3 CB6_FF25%_EM4 SAPRC07_FF25%_EM5
TC
c
o
n
cen
tr
at
io
n
s
(
m
g
m
-3)
TC concentrations at IMPROVE sites
OA / OC = 1.4 OA / OC = 2.1
Obs = 1.03 mg m-3
0.0 0.5 1.0 1.5 2.0 2.5 3.0 3.5 4.0
CB05_SORG_DH CB05_VBS_DH CB05_POA_DH CB05_POA CB05_FF10% CB05_FF25% CB05_FF50% CB05_FF25%_EM3 CB6_FF25%_EM4 SAPRC07_FF25%_EM5
T
C
co
n
cen
tr
a
ti
on
s
(
m
g
m
-3)
TC concentrations at STN sites
OA / OC = 1.4 OA / OC = 2.1
Obs = 2.71 mg m-3
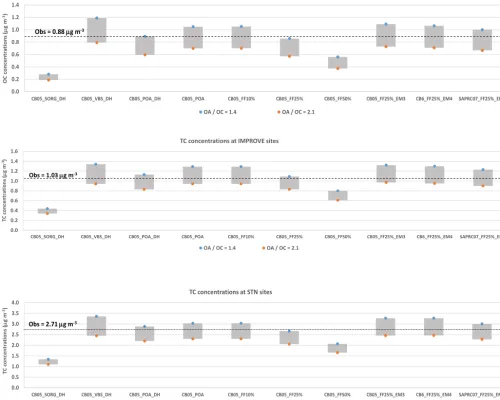
Figure 1.Sim OC and TC concentrations against observations from IMPROVE and STN under two OA/OC ratios, 1.4 and 2.1, resulting in a range of possible OC or TC values denoted by the gray bars. The obs OC or TC is denoted by the horizontal dotted line.
NMEs and the lowest Corr compared to all other simula-tions with a SOA module based on the VBS method. The remaining VBS simulations significantly reduce the biases and errors in OC and TC from CB05_SORG_DH and also improve the correlation. Compared to CB05_SORG_DH, CB05_VBS_DH with nonvolatile POA seems to perform rel-atively well in terms of NMBs and Corr against IMPROVE OC, IMPROVE TC, and STN TC.
Adding the semivolatile POA treatment with 1.5 times the NEI POA emissions (CB05_POA_DH) reduces simulated OC and TC concentrations compared to CB05_VBS_DH, due to the loss of mass from the semivolatile POA. As the POA mass is reduced, less surface area is available for SOA precursors to condense onto, resulting in decreased OA (and thus decreased OC and TC) for CB05_POA_DH. Using the
semi-empirical correlation of Epstein et al. (2010) forHvap increases the OC and TC concentrations (CB05_POA ver-sus CB05_POA_DH). Compared to the default Hvap of 30 kJ mol−1 used in CB05_POA_DH, the semi-empirical correlation of Epstein et al. (2010) gives much higher
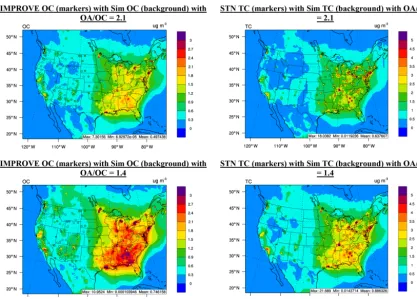
Figure 2.Overlay of obs data (markers) vs. sim data (background) for IMPROVE OC and STN TC and for OA/OC ratios of 1.4 and 2.1 for the case CB05_25%FF_EM3.
processes, reduce the Corr slightly (compared to the cases CB05_POA and CB05-10%FF). By doubling the POA sions (from 1.5 to 3.0 times the original POA NEI emis-sions) for the 25 % FF case (CB05_FF25%_EM3), the pre-dicted OC and TC concentrations are closer to the obser-vations. When evaluated against IMPROVE OC, IMPROVE TC, and STN TC, among simulations using CB05, the sim-ulations CB05_VBS_DH, CB05_POA, CB05_FF10%, and CB05_FF25%_EM3 perform better than other cases. The differences in the OC and TC predictions from the simula-tions with different gas-phase mechanisms will be discussed later in Sect. 2.
Figure 2 shows the spatial distributions of simulated OC and TC concentrations overlaid with observed OC from IM-PROVE and TC from STN for the case CB05_25%FF_EM3 for the two OA/OC ratios. The model performs much bet-ter for IMPROVE OC with an OA/OC ratio of 2.1 com-pared to 1.4, especially over the eastern US, where the use of an OA/OC ratio of 1.4 results in large overpredictions. On the one hand, over the central US and parts of the west-ern US, the use of an OA/OC ratio of 1.4 shows slightly better predictions of IMPROVE OC compared to the use of OA/OC ratio of 2.1 that gives underpredictions of OC. On the other hand, the model performs better for STN OC with an OA/OC ratio of 1.4 compared to 2.1. The use of an
OA/OC ratio of 1.4 gives better agreement with STN TC over the eastern US where the use of an OA/OC ratio of 2.1 results in large underpredictions of TC. Evaluation of OC and TC against IMPROVE and STN, respectively, therefore de-pends heavily on the OA/OC ratio, which is site-specific. Therefore in more rural sites (IMPROVE), the OA/OC ratio is more likely to be high (∼2.1) with more oxygenated OA, while in more urban sites (STN), the OA/OC ratio is more likely to be lower (∼1.4) due to fresher emissions and less oxidized species.
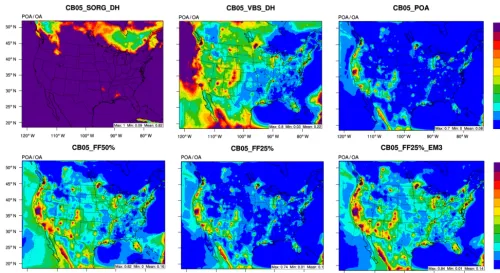
Figure 3.POA/OA ratios of sim data from various sensitivity simulation cases.
however, might give too-high POA concentrations over the western portion of the domain as it does not consider POA to be semivolatile. Considering semivolatile POA, how-ever, without considering the fragmentation and function-alization processes in the simulation CB05_POA results in too-low POA/OA ratio (<0.1 over most areas). Similarly, the CB05_FF25% case also results in a large portion of CONUS having POA/OA ratios of <0.1, due to the loss of POA mass. CB05_FF50%, however, predicts reasonable POA/OA ratios, even with FF due to balanced loss of both POA and SOA mass through fragmentation to higher volatil-ity bins. The simulation CB05_FF25%_EM3 also improves from CB05_FF25% by increasing the POA mass contribut-ing to higher POA/OA ratios.
Figure 4 shows the observed and simulated tempo-ral variations of SOA concentrations at the two Cal-Nex sites, Bakersfield and Pasadena in CA, from May to June 2010 for the simulations CB05_SORM_DH, CB05_VBS_DH, CB05_25%FF_EM3, CB6_25%FF_EM3, and SAPRC07_25%FF_EM3. There are large underpredic-tions of SOA by all runs on some days (e.g., 15–16 May, 2–6 June, 13–14 June), likely due to missing SOA precur-sor emissions. Table 6 shows the statistics of the simulations presented in Fig. 4. The results using CB6 and SAPRC07 gas-phase mechanisms will be discussed in Sect. 4.2. The ob-served SOA was derived based on the tracer method of Klein-dienst et al. (2012) which contains some uncertainties, and also likely contributes to the poor correlation for most of the
cases. For example, it assumes mass fraction of the tracers in secondary organic carbon is the same in the field as that in the laboratory, and the tracers are assumed to be inert and are un-likely to undergo oxidation in the atmosphere, which might not be the case. In addition, the SOA data from the CalNex campaign only consider contributions from a small number of precursors including biogenic precursors (i.e., isoprene,
α-pinene, andβ-caryophyllene), and the anthropogenic pre-cursors (i.e., toluene, polycyclic aromatic hydrocarbons, and methyl butenol).
Table 6.Statistics for evaluation at Bakersfield and Pasadena sites. A bar chart of daily average obs vs. sim values can be found in Fig. 4.
Case Mean Obs Mean Sim Corr NMB (%) NME (%)
Bakersfield
CB05-SORG-DH 0.51 5.9×10⁻⁴ −0.15 −100 100 %
CB05-VBS-DH 0.51 0.67 0.41 32.5 62.0
CB05-25%FF-EM3 0.51 0.24 −0.01 −52.0 61.0
CB6-25%FF-EM3 0.51 0.28 −0.04 −45.8 59.0
SAPRC07-25%FF-EM3 0.51 0.24 −0.16 −53.1 63.0
Pasadena
CB05-SORG-DH 0.63 0.04 −0.07 −94.0 94.0
CB05-VBS-DH 0.63 0.54 0.09 −14.5 64.3
CB05-25%FF-EM3 0.63 0.54 −0.2 −14.4 66.2
CB6-25%FF-EM3 0.63 0.62 −0.2 −2.1 70.0
SAPRC07-25%FF-EM3 0.63 0.62 0.03 −1.4 70.5
0.0 0.5 1.0 1.5 2.0 2.5 3.0
5/1
9
5/2
0
5/2
1
5/2
2
5/2
3
5/2
4
5/2
5
5/2
6
5/2
7
5/2
8
5/2
9
5/3
0
5/3
1
6/1 6/2 6/3 6/4 6/5 6/6 6/7 6/8 6/9 6/10 6/11 6/12 6/13 6/14 6/15 6/16 6/17 6/18 6/19 6/20 6/21 6/22 6/23 6/24
SO
A
conce
n
tr
at
ion
(
m
g
m
-3)
SOA at Bakersfield, CA
Observed SOA CB05-SORG-DH CB05-VBS-DH CB05-25%FF-EM3 CB6-25%FF-EM3 SAPRC07-25%FF-EM3
0.0 0.3 0.5 0.8 1.0 1.3 1.5 1.8 2.0
5/15 5/16 5/17 5/18 5/19 5/20 5/21 5/22 5/23 5/24 5/25 5/26 5/27 5/28 5/29 5/30 5/31 6/1 6/2 6/3 6/4 6/5 6/6 6/7 6/8 6/9 6/10 6/11 6/12 6/13 6/14 6/15
SO
A
concen
tr
ati
on
(
m
g
m
-3)
SOA at Pasadena, CA
Observed SOA CB05-SORG-DH CB05-VBS-DH CB05-25%FF-EM3 CB6-25%FF-EM3 SAPRC07-25%FF-EM3
Figure 4.Comparison of obs SOA vs. sim SOA at CalNex sites in Bakersfield and Pasadena in California.
low SOA concentrations due to low concentrations of con-densable material. At Pasadena, both CB05_VBS_DH and CB05_25%FF_EM3 overpredict the obs SOA from 15 to 30 May, but are unable to capture the high SOA con-centrations from 2 to 6 June. The CB05_VBS_DH case seems to perform better than the CB05_25%FF_EM3 case when observed SOA concentrations are high. The results from this study are consistent with those from Baker et
al. (2015), which showed that measured PM2.5 OC at Bak-ersfield is largely underpredicted compared to Pasadena. Baker et al. (2015), however, attributed to the underpre-dictions of OC at Bakersfield and Pasadena mainly to pri-mary OC predicted by the baseline model, compared to the aerosol mass spectrometer measurements, suggesting that OC is mostly secondary in nature in Pasadena. In addition, as mentioned earlier, the simulated SOA from WRF/Chem
does not consider contributions from all the SOA precur-sors identified by their trace compounds (e.g., the biogenic precursor, b-caryophyllene, and the anthropogenic precursor methyl butenol, are not included in WRF/Chem), which can help to account for the discrepancies between the simulated and observed SOA concentrations.
4.2 Sensitivity of OA predictions to different gas-phase mechanisms
Figure 1 shows that CB05_FF25%_EM3 produces the high-est OC and TC concentrations at the IMPROVE sites, fol-lowed by CB6_FF25%_EM3 and SAPRC07_FF25%_EM3, while CB6_FF25%_EM3 produces the highest TC concen-trations at the STN sites. However, the differences in domain-mean simulated OC and TC between the simulations with the three different gas-phase mechanisms are small compared to the differences in simulated OC and TC due to differences in VBS treatments (e.g., nonvolatile versus semivolatile POA). Figure 4 also shows that there are not many differences between simulated SOA concentrations with different gas-phase mechanisms at Bakersfield, but larger differences are found at Pasadena. For example, SAPRC07_25%FF_EM3 produces much higher SOA concentrations compared to CB05_25%FF_EM3 and CB6_25%FF_EM3 at Pasadena on several days (e.g., 6–8 June). Figure 5 shows the time series of hydroxyl radical mixing ratios as well as diurnal plots of OH and hydroperoxyl radical at Pasadena from the CalNex field campaign. The time series of HO2is not shown due to irregularity of the observational data. The model is able to reproduce the diurnal variation of OH radicals but signifi-cantly overpredicts the daytime and peak OH mixing ratios, especially for CB05 and CB6. All gas-phase mechanisms un-derpredict OH mixing ratios at night. Among all simulations, SAPRC07 produces the closest simulated OH mixing ratios compared to CB05, and CB6 gives the largest overpredic-tions. Similarly, the HO2 mixing ratios are generally over-predicted by all gas-phase mechanisms with SAPRC07 per-forming the best. The overpredictions in OH and HO2mixing ratios do not help explain the underpredictions of SOA for several days at Pasadena where underpredictions of VOCs may be the main cause, which is consistent with the findings of Baker et al. (2015).
Figure 6 shows spatial distributions of average concentra-tions of oxidants including ozone (O3), OH, and HO2, as well as the OA species including anthropogenic SOA (ASOA), biogenic SOA (BSOA), total SOA, and POA. SAPRC07-25%FF-EM3 produces the highest domain-average O3 mix-ing ratios but the lowest domain-average OH+HO2 mix-ing ratios, while CB6-25%FF-EM3 produces the highest domain-average and maximum OH+HO2mixing ratios but the lowest domain-average O3mixing ratios. These findings are mostly consistent with the literature. For example, maxi-mum O3and OH mixing ratios over the Los Angeles area are higher for CB6 compared to CB05, which are consistent with
the results from Yarwood et al. (2010). SAPRC07 also gen-erally produces higher O3mixing ratios compared to CB05. However, average O3mixing ratios from CB6 are expected to be higher than CB05 (rather than lower, as shown in Fig. 6), according to the study from Nopmongcol et al. (2012) which showed higher O3mixing ratios over Europe for January and July using the Comprehensive Air Quality Model with Ex-tensions (CAMx). CB6 is a relatively new gas-phase mech-anism, and there are very few studies that evaluated its per-formance over a longer period of time (e.g., for the whole summer) and over CONUS. In addition, there are other un-certainties in this study. For example, the emissions for CB05 are used for CB6, the additional explicit VOC species in CB6 such as benzene and acetylene are not considered, which can also contribute to O3formation. In addition, most locations in the US in 2010 are considered to be NOx-limited with
local-ized VOC-limited regimes from May to September (Camp-bell et al., 2015), which means that O3 formation is more likely to depend on NOxrather than VOC concentrations.
Table 7 shows the statistics for maximum 1 h and 8 h O3 mixing ratios evaluated against CASTNET and AQS. CAST-NET sites are mainly rural sites, while AQS consists of ur-ban, suburur-ban, and rural sites. As expected, SAPRC07 con-sistently produces the highest maximum 1 h and maximum 8 h O3mixing ratios and overpredicts at AQS sites with an NMB of∼16 %. However, SAPRC07 performs the best at CASTNET sites, as both CB05 and CB6 significantly under-predict maximum 1 h and maximum 8 h O3mixing ratios. At CASTNET sites, CB6 performs the poorest with the largest underpredictions for both maximum 1 h and 8 h O3 mixing ratios. However, CB6 predicts higher maximum 1 h and 8 h O3mixing ratios at AQS sites, while CB05 predicts the low-est maximum 1 h and 8 h O3 mixing ratios at AQS sites. It is likely that CB6 predicts higher O3 mixing ratios at more VOC-limited sites in urban areas, while CB05 predicts higher O3mixing ratios at more NOx-limited areas, due to the
im-provement in VOC speciation in CB6 compared to CB05. Overall, however, CB05 has the highest Corr and the low-est NMEs for CASTNET maximum 1 h and AQS maximum 1 h and 8 h O3mixing ratios. For PM2.5concentrations, CB6 produces the best performance against IMPROVE (highest Corr, lowest NMB and NME) while CB05 produces the best performance against STN (highest Corr and lowest NME). All three cases perform poorly for PM10 against AQS, with large underpredictions due to the lack of consideration of the coarse-mode inorganic species in MADE-VBS treatments.
high-0.0 0.1 0.2 0.3 0.4 0.5 0.6
5/15 5/17 5/20 5/22 5/25 5/27 5/30 6/1 6/4 6/6 6/9 6/11 6/14 6/16
O
H mixin
g
ra
tio
(p
p
t)
OH at Pasadena (May to June 2010)
Obs CB05-25%FF-EM3 CB6-25%FF-EM3 SAPRC07-25%FF-EM3
0.00 0.05 0.10 0.15 0.20 0.25 0.30 0.35 0.40
0:00
0 03:00 06:00 09:00 12:00 15:00 18:00 21:00 00:00
OH
(p
p
t)
OH at Pasadena (May to June 2010)
Obs CB05-25%FF-EM3 CB6-25%FF-EM3 SAPRC07-25%FF-EM3
0 0.005 0.01 0.015 0.02 0.025 0.03 0.035
0:00
0 03:00 06:00 09:00 12:00 15:00 18:00 21:00 00:00
HO
2
(p
p
b
)
HO2 at Pasadena (May to June 2010)
Obs CB05-25%FF-EM3 CB6-25%FF-EM3 SAPRC07-25%FF-EM3
Figure 5.Time series of OH and diurnal plots of OH and HO2at Pasadena, CA, during CALNEX, 2010.
est OH+HO2 mixing ratios for CB6. The more extensive VOC representation and high O3mixing ratios for SAPRC07 also likely contribute to the high BSOA concentrations for SAPRC07 compared to CB05. However, overall, the total SOA and POA concentrations for all three gas-phase mecha-nisms do not vary much, resulting in similar OA concentra-tions.
Figures 7 and 8 show the time series of simulated ver-sus observed OC from IMPROVE and simulated verver-sus ob-served TC from STN at several representative sites over CONUS for the different gas-phase mechanisms. In general, at IMPROVE sites, CB05 gives the highest OC concentra-tions compared to CB6 and SAPRC07 most of the time, re-sulting in overpredictions of OC concentrations, while CB6 and SAPRC07 perform better against IMPROVE OC. The overpredictions of CB05 are likely due to overpredictions in ASOA (as CB05 produces the highest ASOA concentrations
0 0.5 1 1.5 2 2.5 3 3.5 4 4.5 5 5/ 11 5/ 13 5/ 15 5/ 17 5/ 19 5/ 21 5/ 23 5/ 25 5/ 27 5/ 29 5/
31 6/2 6/4 6/6 6/8
6/ 10 6/ 12 6/ 14 6/ 16 6/ 18 6/ 20 6/ 22 6/ 24 6/ 26 6/ 28 OC ( m g m -3)
Brigantine NWR, NJ (39.465, -74.4492)
CB05-25%FF-EM3 CB6-25%FF-EM5 SAPRC07-25%FF-EM7 Obs
0 0.2 0.4 0.6 0.8 1 1.2 1.4 5/ 11 5/ 13 5/ 15 5/ 17 5/ 19 5/ 21 5/ 23 5/ 25 5/ 27 5/ 29 5/
31 6/2 6/4 6/6 6/8
6/ 10 6/ 12 6/ 14 6/ 16 6/ 18 6/ 20 6/ 22 6/ 24 6/ 26 6/ 28 OC ( m g m -3)
Death Valley NP, CA (36.5089, -116.8478)
CB05-25%FF-EM3 CB6-25%FF-EM5 SAPRC07-25%FF-EM7 Obs
0 0.5 1 1.5 2 2.5 3 3.5 4 4.5 5/ 11 5/ 13 5/ 15 5/ 17 5/ 19 5/ 21 5/ 23 5/ 25 5/ 27 5/ 29 5/
31 6/2 6/4 6/6 6/8
6/ 10 6/ 12 6/ 14 6/ 16 6/ 18 6/ 20 6/ 22 6/ 24 6/ 26 6/ 28 OC ( m g m -3)
Swanqwarter, NJ (35.451, -76.2075)
CB05-25%FF-EM3 CB6-25%FF-EM5 SAPRC07-25%FF-EM7 Obs
0 0.5 1 1.5 2 2.5 5/ 11 5/ 13 5/ 15 5/ 17 5/ 19 5/ 21 5/ 23 5/ 25 5/ 27 5/ 29 5/
31 6/2 6/4 6/6 6/8
6/ 10 6/ 12 6/ 14 6/ 16 6/ 18 6/ 20 6/ 22 6/ 24 6/ 26 6/ 28 OC ( m g m -3)
Tallgrass, KS (38.4341, -96.4602)
CB05-25%FF-EM3 CB6-25%FF-EM5 SAPRC07-25%FF-EM7 Obs
Figure 7.Time-series plots of IMPROVE OC vs. simulated OC at selected sites from sensitivity simulations of different gas-phase mecha-nisms. The colored bands represent the range of OC values for ratios 1.4 to 2.1.
probably due to similar elemental carbon (EC) concentra-tions for all gas-phase mechanisms, which can form a signif-icant percentage of TC. In general, all simulations with the three gas-phase mechanisms also show similar trends (peaks and troughs) for simulated TC, likely due to influences from meteorological parameters such as wind and precipitation. Overall, all three simulations are also able to predict the mag-nitude and trends of STN TC concentrations relatively well. Similarly, CB05 tends to produce the highest TC concentra-tions; however, CB6 does also produce the highest TC con-centrations for several days, for example, for some days in May in Washington, DC, and Tampa, FL, as well as in June in Liberty, KS, likely due to influences of BSOA where CB6 produces the highest concentrations, as shown in Fig. 6.
4.3 Impact of different VBS treatments on CDNC
0 1 2 3 4 5 6 7 8 9 10
TC (
m
g
m
-3)
Washington, DC (38.921847, -77.013178) [urban]
CB05-25%FF-EM3 CB6-25%FF-EM3 SAPRC07-25%FF-EM3 Obs
0 1 2 3 4 5 6 7
TC (
m
g
m
-3)
Tampa, FL (27.960278, -82.3825) [industrial]
CB05-25%FF-EM3 CB6-25%FF-EM3 SAPRC07-25%FF-EM3 Obs
0 0.5 1 1.5 2 2.5 3 3.5
TC (
m
g
m
-3)
Liberty, KS (39.30309, -94.376623) [rural/agricultural]
CB05-25%FF-EM3 CB6-25%FF-EM3 SAPRC07-25%FF-EM3 Obs
0 0.5 1 1.5 2 2.5
TC (
m
g
m
-3)
Boise, ID (43.600699, -116.347853) [urban]
CB05-25%FF-EM3 CB6-25%FF-EM3 SAPRC07-25%FF-EM3 Obs
Figure 8.Time-series plots of STN TC vs. simulated TC at selected sites from sensitivity simulations of different gas-phase mechanisms. The colored bands represent the range of OC values for ratios 1.4 to 2.1.
are small differences, however, among simulated CDNC with different VBS treatments for CB05 in CDNC predictions, with similar Corr∼0.29, NMBs of ∼ −29 to−27 %, and NMEs of ∼47 %. Figure 9 shows the spatial differences in predictions in warm clouds between several simulations and the simulation CB05_VBS_DH. CB05_SORGAM_DH gives the lower CDNC than CB05_VBS_DH, indicat-ing that the VBS treatment in CB05_VBS_DH helps to increase CDNC significantly. While other simulations with semivolatile POA treatments further increase domain-average CDNC when comparing to CB05_VBS_DH, the dif-ferences between CDNC predictions from those simulations and those from CB05_VBS_DH are quite similar. In general, CDNC with the semivolatile POA cases is higher over the western US but lower over the eastern US due to decreases
in column OA concentrations for the semivolatile POA cases compared to CB05_VBS_DH over the eastern US.
concen-Figure 9.Impact of different VBS cases on CDNC in warm clouds. The plots show the differences between the different sensitivity simula-tions and CB05_VBS-DH.
trations, with SAPRC07 producing the lowest domain mean and maximum total inorganic PM2.5 concentrations. Com-pared to CB05 and CB6, the lower inorganic PM2.5 concen-trations simulated with SAPRC07 are likely due to the low OH+HO2mixing ratios for SAPRC07, as shown in Fig. 6, resulting in a lower PM number concentration and lower CCN, and thus lower CDNC.
4.4 Sensitivity simulations for aerosol activation parameterizations
Among all OA sensitivity simulations, the simulation CB05-25%FF-EM3 gives the overall best performance in terms of OC, TC, O3, PM2.5, and CDNC evaluation; it is thus se-lected to test various aerosol activation parameterizations. Four sensitivity simulations, listed in Table 4, are designed to test the FN05 series aerosol activation parameterizations with improved treatments compared to the default ARG00 aerosol activation parameterization. These sensitivity simu-lations include the default ARG00, the FN05, the combi-nation of FN05 and BA10, and the MN14. These simula-tions use the MSKF scheme instead of the Morrison micro-physics schemes in the previous SOA runs, as the MSKF scheme has a better correlation with MODIS CDNC com-pared to the Morrison microphysics scheme. Table 8 sum-marizes the model evaluation results against MODIS-derived
Figure 10.Spatial plots of total column CDNC, total surface OA, and total inorganic PM2.5concentrations from simulations with different gas-phase mechanisms.
compared to ARG00 shown in Table 9, and also compared to ARG00, are due to the large overpredictions over the north-eastern US but underpredictions over other parts of the do-main. The simulated CDNC from the default ARG00 case is similar to that from Bennartz (2007) over the eastern US; the underpredictions are mainly over the western US and over the ocean because of the known bias when large CCN are not present (Morales Betancourt and Nenes, 2014). The sim-ulations with the FN05 series increase CDNC where CCN is high, i.e., over the northeastern US, resulting in overpredic-tions in CDNC over the northeastern US, and does not help to improve CDNC predictions over other parts of the US as well as over the ocean.
Figure 12 compares the simulated CCN and AOD from the CB05_25%FF_EM3+MN14 case with those derived from the MODIS. The model largely underpredicts CCN, espe-cially over the western part of the domain, which also ex-plains the large underprediction of CDNC over the western part of the domain. Condensation of the available water
va-por occurs over CCN which are concentrated over the north-eastern US, resulting in overpredictions of CDNC over the northeastern US. The lack of CCN over the ocean and the western part of the domain is related to the underpredictions of AOD over the same areas. This indicates biases in number (and probably mass) concentrations of column PM concen-trations, especially over the ocean and western US. PM2.5 and PM10 observational data are available over the surface and are both underpredicted; however, there are no observa-tional data for column concentrations of PM2.5and PM10for evaluation. Improving the spatial distribution and magnitude of emissions for PM species and precursors for the model layers at the surface and above the surface can help improve AOD and CCN predictions, and therefore CDNC predictions.
5 Summary and conclusions
Figure 11.Spatial plots for MODIS-derived CDNC from Bennartz (2007) and simulated in-cloud column CDNC from CB05_25%FF_EM3 ARG00, FN series, and MN14 from May to June 2010.
Table 7.Statistics for max 1 h and max 8 h O3for simulations with different gas phases against CASTNET and AQS for May to June 2010.
Case Mean Obs Mean Sim Corr NMB (%) NME (%)
CASTNET Max 1 h O3
CB05-25%FF-EM3 51.8 43.3 0.54 −16.3 21.9
CB6-25%FF-EM3 51.8 41.9 0.52 −19.1 24.1
SAPRC07-25%FF-EM3 51.8 48.3 0.51 −6.7 21.1
CASTNET Max 8 h O3
CB05-25%FF-EM3 47.4 43.0 0.54 −9.3 18.9
CB6-25%FF-EM3 47.4 41.8 0.53 −11.8 20.6
SAPRC07-25%FF-EM3 47.4 47.9 0.50 1.0 19.8
AQS Max 1 h O3
CB05-25%FF-EM3 51.0 49.9 0.55 −2.1 18.2
CB6-25%FF-EM3 51.0 51.5 0.43 1.0 20.8
SAPRC07-25%FF-EM3 51.0 59.3 0.44 16.4 26.1
AQS Max 8 h O3
CB05-25%FF-EM3 46.2 46.0 0.54 −0.4 18.6
CB6-25%FF-EM3 46.2 47.4 0.47 2.6 20.3
SAPRC07-25%FF-EM3 46.2 53.7 0.46 16.3 25.4
IMPROVE PM2.5
CB05-25%FF-EM3 4.9 3.8 0.64 −22.0 40.6
CB6-25%FF-EM3 4.9 4.1 0.65 −16.5 39.6
SAPRC07-25%FF-EM3 4.9 3.5 0.60 −28.5 42.9
STN PM2.5
CB05-25%FF-EM3 11.1 8.8 0.48 −20.6 40.7
CB6-25%FF-EM3 11.1 10.0 0.37 −9.3 44.3
SAPRC07-25%FF-EM3 11.1 7.7 0.40 −30.5 45.2
AQS PM10
CB05-25%FF-EM3 24.6 7.3 0.08 −70.2 73.5
CB6-25%FF-EM3 24.6 8.0 0.09 −67.7 71.8
SAPRC07-25%FF-EM3 24.6 6.9 0.09 −71.9 74.8
Table 8.Statistics for model evaluation for simulated CDNC against MODIS-derived CDNC from Bennartz (2007). All cases use the Grell– Freitas cumulus parameterization.
Case Mean Obs Mean Sim Corr NMB (%) NME (%)
CB05-SORG-DH 162.1 96.0 0.28 −40.8 50.4
CB05-VBS-DH 162.1 106.0 0.28 −34.6 50.6
CB05-POA-DH 162.1 115.0 0.29 −29.1 47.4
CB05-POA 162.1 117.3 0.29 −27.7 47.3
CB05-10%FF 162.1 117.1 0.29 −27.8 47.2
CB05-25%-FF 162.1 116.4 0.29 −28.2 47.3
CB05-50%-FF 162.1 114.7 0.29 −29.2 47.4
CB05-25%FF-EM3 162.1 116.2 0.29 −28.3 47.3
CB6-25%FF-EM3 162.1 110.4 0.30 −31.9 47.3
Table 9. Statistics for simulated CDNC for CB05-25%FF-EM3 against MODIS-derived CDNC from Bennartz (2007) for May to June 2010. All cases use the MSKF cumulus parameterization.
Case Mean Obs Mean Sim Corr NMB (%) NME (%)
ARG00 162.1 104.8 0.31 −35.4 49.9
FN05 162.1 173.8 0.26 7.1 93.0
FN05/BA10 162.1 160.8 0.27 −0.8 87.9
MN14 162.1 168.9 0.27 4.2 89.6
feedback mechanisms such as the aerosol activation pro-cess. Compared to the traditional OA method, the VBS treatment helps to improve OA predictions by reducing the underpredictions of OA. By including a semivolatile POA treatment, using a semi-empirical formation of Epstein et al. (2010) forHvap, including 25 % fragmentation and func-tionalization as well as including additional SVOC and IVOC emissions, the VBS treatment in WRF/Chem simu-lates the atmospheric OA formation processes more real-istically and can perform relatively well in predictions of OC and TC against IMPROVE and STN. POA/OA ra-tios for the CB05_25%FF_EM3 and CB05_FF50% treat-ments are within the range of POA/OA ratios of ∼0.15 to 0.40 from literature. Compared to the simulation with default SORGAM SOA module, the simulations with var-ious new VBS treatments also give better agreement with observed SOA at Bakersfield and Pasadena during the Cal-Nex field campaign from May to June 2010. However, biases exist in those simulations with the VBS treatments for sev-eral possible reasons, including underestimated POA emis-sions, underpredicted VOC concentrations, and differences in the SOA precursors used in the model and those contribut-ing to the observed SOA concentrations. The simulations with different gas-phase mechanisms (i.e., CB05, CB6, and SAPRC07) produce in general different ASOA and BSOA concentrations. SAPRC07 produces the highest O3 mixing ratios, while CB6 produces the lowest OH+HO2mixing ra-tios. CB6 also performs the best when evaluated against IM-PROVE PM2.5 while CB05 performs the best when evalu-ated against STN PM2.5 concentrations. All three cases per-form poorly against AQS PM10 evaluation. Due to the sig-nificant differences between O3, OH, and HO2mixing ratios for the three gas-phase mechanisms, inorganic PM concen-trations vary widely, especially between the Carbon Bond mechanisms (CB05 and CB6) and SAPRC07, resulting in significantly different predictions of CDNC. The CDNC pre-dictions do not vary much among simulations with CB05 and different VBS treatments, for example, for simulations with nonvolatile versus semivolatile POA, and with and without fragmentation and functionalization treatments. The simula-tion with SAPRC07 produces the lowest CDNC compared to those with CB05 and CB6, due to the lowest inorganic PM number and mass concentrations resulting from the low-est OH and HO2mixing ratios among all simulations. CB05
gives the best performances when evaluated against CAST-NET and AQS ozone mixing ratios, STN PM2.5 concentra-tions, and MODIS CDNC.
With the default ARG00 treatment in the model, in gen-eral, all simulations with VBS treatments underpredict the MODIS-derived CDNC by Bennartz (2007). By including the FN05 series (i.e., FN05, FN05/BA10, and MN14), the un-derpredictions for CDNC are greatly reduced. However, the correlation coefficient and errors are worse with the FN05 series, with large overpredictions over the northeastern US, where CCN is high. The model performs poorly for AOD and CCN, likely due to inaccuracies in spatial distribution and magnitudes of PM and PM precursor emissions in the model layers at the surface and above the surface. The CDNC pre-dictions can be improved by improving AOD and CCN un-derpredictions over the western US and over the ocean.
Code and data availability. The WRF/Chem v3.7.1 code used in
this paper will be available upon request. The inputs including the meteorological files, meteorological initial and boundary con-ditions, chemical initial and boundary concon-ditions, model setup and configuration, and the name-list setup and instructions on how to run the simulations for a 1-day test case, as well as a sample output for a 1-day test, can be provided upon request.
Competing interests. The authors declare that they have no conflict of interest.
Acknowledgements. This study is funded in part by the National