Open Access
Research article
Genomic selection of reference genes for real-time PCR in human
myocardium
Anna P Pilbrow
1, Leigh J Ellmers
1, Michael A Black
2, Christine S Moravec
3,
Wendy E Sweet
3, Richard W Troughton
1, A Mark Richards
1,
Chris M Frampton
1and Vicky A Cameron*
1Address: 1Christchurch Cardioendocrine Research Group, Department of Medicine, University of Otago-Christchurch, PO Box 4345, Christchurch 8014, New Zealand, 2Department of Biochemistry, University of Otago, PO Box 56, Dunedin 9054, New Zealand and 3Kaufman Center for Heart Failure, Department of Cardiovascular Medicine, Cleveland Clinic, 9500 Euclid Avenue, Cleveland, Ohio 44195, USA
Email: Anna P Pilbrow - [email protected]; Leigh J Ellmers - [email protected];
Michael A Black - [email protected]; Christine S Moravec - [email protected]; Wendy E Sweet - [email protected]; Richard W Troughton - [email protected]; A Mark Richards - [email protected];
Chris M Frampton - [email protected]; Vicky A Cameron* - [email protected] * Corresponding author
Abstract
Background: Reliability of real-time PCR (RT-qPCR) data is dependent on the use of appropriate reference gene(s) for normalization. To date, no validated reference genes have been reported for normalizing gene expression in human myocardium. This study aimed to identify validated reference genes for use in gene expression studies of failed and non-failed human myocardium.
Methods: Bioinformatic analysis of published human heart gene expression arrays (195 failed hearts, 16 donor hearts) was used to identify 10 stable and abundant genes for further testing. The expression stability of these genes was investigated in 28 failed and 28 non-failed human myocardium samples by RT-qPCR using geNorm software.
Results: Signal recognition particle 14 kDa (SRP14), tumor protein, translationally-controlled 1 (TPT1) and eukaryotic elongation factor 1A1 (EEF1A1) were ranked the most stable genes. The commonly used reference gene, glyceraldehyde-3-phosphate dehydrogenase (GAPDH) was ranked the least stable of the genes tested. The normalization strategy was tested by comparing RT-qPCR data of both normalized and raw expression levels of brain natriuretic peptide precursor (NPPB), a gene known to be up-regulated in heart failure. Non-normalized levels of NPPB exhibited a marginally significant difference between failed and non-failed samples (p = 0.058). In contrast, normalized NPPB expression levels were significantly higher in heart-failed patients compared with controls (p = 0.023).
Conclusion: This study used publicly available gene array data to identify a strategy for normalization involving two reference genes in combination that may have broad application for accurate and reliable normalization of RT-qPCR data in failed and non-failed human myocardium.
Published: 29 December 2008
BMC Medical Genomics 2008, 1:64 doi:10.1186/1755-8794-1-64
Received: 15 July 2008 Accepted: 29 December 2008
This article is available from: http://www.biomedcentral.com/1755-8794/1/64 © 2008 Pilbrow et al; licensee BioMed Central Ltd.
BMC Medical Genomics 2008, 1:64 http://www.biomedcentral.com/1755-8794/1/64
Page 2 of 12 (page number not for citation purposes)
Background
Analysis of gene expression levels has become increasingly important in biological research, providing insight into the complex regulatory networks that underlie health and disease [1]. Quantitative real-time PCR (RT-qPCR) is one of the most sensitive, specific, and widely-used methods for measuring the expression levels of selected genes [2,3]. Accuracy of RT-qPCR data is reliant on appropriate malization of individual samples, and sub-optimal nor-malization is a common pitfall of RT-qPCR analyses [1,2,4]. There are many sources of variation in gene expression measurements, including differences in cell number, transcriptional efficiency, mRNA integrity, and differences in efficiency of RNA extraction and variability of cDNA synthesis between samples. While a number of strategies have been applied to account for inter-sample variation, the use of two or more reference genes is cur-rently the favored approach for accurate and reliable nor-malization of the mRNA fraction [2,5].
Among the most commonly used reference genes in RT-qPCR are glyceraldehyde-3-phosphate dehydrogenase (GAPDH) and β-actin [6]. These genes were introduced for normalization when mRNA expression was assessed using semi-quantitative methods, such as Northern blot-ting and RNase protection, because of their relatively high abundance in numerous cell-types [1,4]. However, the increased sensitivity of RT-qPCR demands a significantly greater stringency for reference gene selection [2,5]. Previ-ous studies have demonstrated that the expression levels of classical reference genes can vary markedly across cells, tissues and experimental conditions, including heart cells and tissues [7,8]. More stable alternatives exist, although these tend to be specific to the tissue under investigation [1,6,9,10]. To date, no validated universal or human heart-specific reference genes have been identified.
To select optimal reference genes for RT-qPCR analysis of human myocardium, we screened human heart gene expression data from a published microarray study and investigated gene abundance and expression stability. We validated the top-ranked candidate reference genes in an independent set of human myocardium samples obtained from heart transplant patients and heart-healthy donors, and identified the minimum set required for accurate and reliable normalization of RT-qPCR data in failed and non-failed human myocardium.
Methods
Candidate gene selection
To select candidate reference genes for subsequent testing by RT-qPCR, publicly available microarray data from explanted human myocardium was screened to identify transcripts with stable and abundant expression. Abun-dant transcripts were selected to ensure robust
measure-ment by RT-qPCR in all samples. Affymetrix gene expression profiles generated from left ventricle myocar-dium from 195 heart transplant recipients with advanced ischemic or idiopathic cardiomyopathy and 16 unmatched heart donors [11] were obtained from the NCBI GEO database (GEO accession GSE5406, http:// www.ncbi.nlm.nih.gov). These data were derived from Affymetrix HG-U133A microarrays, each consisting of 22,283 probe sets representing approximately 13,000 genes. MAS 5.0 [12] normalized data were used to calcu-late the mean and standard deviation of the expression intensity for each probe set across all samples, using the R software package [13]. The 5% of probe sets with the smallest standard deviations (i.e., the least variable) were then identified, and of those, any probe set with a mean expression intensity of greater than 10 on the log2 scale was selected for assessment as a candidate reference for RT-qPCR analysis. For comparison, the expression stabil-ity and abundance of 50 genes previously used or pro-posed by prior studies as reference genes [6,10,14] were also screened for abundance and stability across all probes for identification of candidate reference genes.
Patient samples
Tissue from the left ventricular free wall of the myocar-dium was obtained from explanted failed hearts from heart transplant recipients at the Cleveland Clinic Foun-dation (n = 28). Non-failed heart tissue was obtained from unmatched organ donors through Lifebanc of Northeast Ohio (n = 28). Tissue handling was as previ-ously described [15,16]. The investigation was approved by the Cleveland Clinic Internal Review Board (ethics approval IRB 2378) and all patients provided informed consent. The study adhered to the principles outlined in the Declaration of Helsinki and Title 45, US Code of Fed-eral Regulation, Part 46, Protection of Human Subjects, revised November 13, 2001, effective December 13, 2001. All procedures followed were in accordance with institu-tional guidelines.
Sample preparation
Frozen tissue blocks (previously stored at -80°C, mean weight ± standard deviation = 181 ± 81 mg) were placed in pre-chilled tubes containing TRIzol® (Invitrogen, Carlsbad, CA) and immediately subjected to automated grinding in a Mixer Mill MM301 (Retsch, Haan, Ger-many). Total RNA was isolated with chloroform and puri-fied using RNeasy Midi columns in a total volume of 300
were digested with DNase I (Invitrogen, Carlsbad, CA). First strand cDNA synthesis was performed from 2 μg of total RNA with oligodT primers and Superscript III, fol-lowed by RNase H digestion (Invitrogen, Carlsbad, CA) as previously described [17].
Real-time PCR
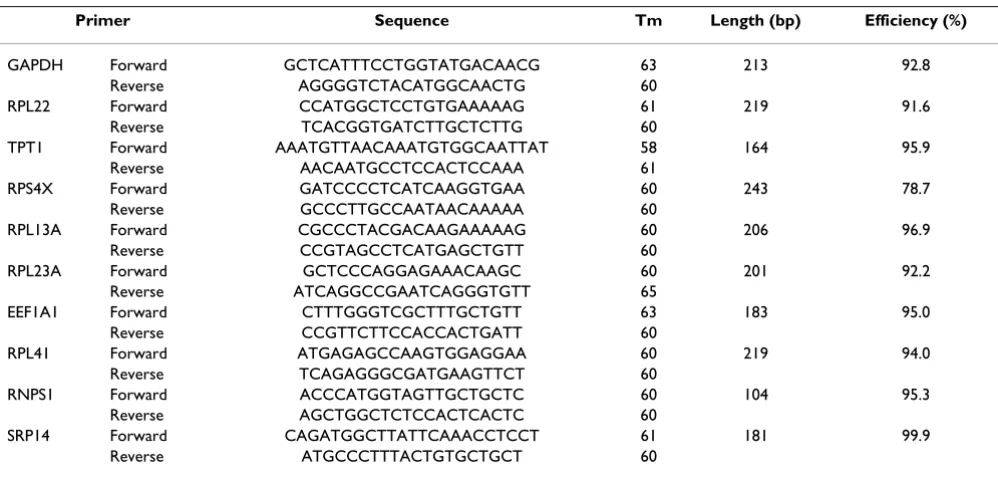
Primers for all 10 candidate reference genes were designed using Primer3 software [18] within regions spanned by the Affymetrix probe set target sequences (Table 1). At least one primer in every primer pair was designed across an exon/exon boundary to prevent amplification of any dsDNA transcripts not removed by digestion with DNase I. Affymetrix probe sequences were obtained from the Affymetrix NETAFFX Analysis Centre http://www.affyme trix.com/analysis/index.affx. Alignments of Affymetrix probe set target sequences with mRNA and genomic DNA sequences for each gene were performed with Genious version 2.0.01 software. RT-qPCR reactions were per-formed in duplicate in a Rotor-Gene 3000 (Corbett Research, Sydney, Australia) using SYBR Green I detection of dsDNA synthesis. Reactions (20 μL) contained 1 μL template cDNA, 1× PCR buffer, 1.5 mM MgCl2, 0.2 mM dNTPs (Fermentas, Glen Burnie, MD), 0.5 mM forward and reverse primers, 5× SYBR Green I (Roche Diagnostics, Mannheim, Germany) and 1 U Taq-Ti DNA polymerase (Fisher Biotec, West Perth, Australia). The cycling condi-tions comprised 2 mins polymerase activation at 94°C followed by 30 cycles of 94°C for 10s, 56°C for 20s, and 68°C for 10s. On completion, amplimers were exposed to a temperature gradient from 79–95°C (melt curve) to confirm that a single product had been amplified. For
each sample the Ct value (the fluorescent point at which the reactions are compared) was fitted to a standard curve consisting of five serial dilution points (in triplicate) of purified DNA template (amplicon derived, copy number ranging from ~109 to ~105 copies) and a no-template control. The reaction efficiency for each primer set is detailed in Table 1. The mean standard deviation of Ct values for duplicated samples was 0.10. Quantification of each sample was performed using Rotor-Gene software version 6.1.
NPPB expression levels were determined using a Taqman gene expression assay with inventoried probes (assay id # Hs00173590_m1, Applied Biosystems, Foster City, CA). Reactions (20 μL) were performed in triplicate on a 7500 Fast real-time PCR system (Applied Biosystems) in stand-ard mode according to manufacturer's instructions. Sam-ples were quantified using a standard curve consisting of five serial dilution points (in triplicate) of purified DNA template (amplicon derived, copy number ranging from 1.13 × 10⁸ – 1.13 × 10⁴ copies) and a no-template con-trol. Reaction efficiency was 101.2%. The mean standard deviation of Ct values for duplicate samples was 0.16. Quantification was performed with 7500 Software ver-sion 2.0 (Applied Biosystems).
Evaluation of candidate reference genes using GeNorm The Visual Basic Application geNorm version 3.4 [5,14] was used to evaluate the expression stability of each gene, determine the ideal number of genes required for normal-ization, and calculate individual normalization factors based on the expression levels of the best reference genes.
Table 1: Real-time PCR primers
Primer Sequence Tm Length (bp) Efficiency (%)
GAPDH Forward GCTCATTTCCTGGTATGACAACG 63 213 92.8
Reverse AGGGGTCTACATGGCAACTG 60
RPL22 Forward CCATGGCTCCTGTGAAAAAG 61 219 91.6
Reverse TCACGGTGATCTTGCTCTTG 60
TPT1 Forward AAATGTTAACAAATGTGGCAATTAT 58 164 95.9
Reverse AACAATGCCTCCACTCCAAA 61
RPS4X Forward GATCCCCTCATCAAGGTGAA 60 243 78.7
Reverse GCCCTTGCCAATAACAAAAA 60
RPL13A Forward CGCCCTACGACAAGAAAAAG 60 206 96.9
Reverse CCGTAGCCTCATGAGCTGTT 60
RPL23A Forward GCTCCCAGGAGAAACAAGC 60 201 92.2
Reverse ATCAGGCCGAATCAGGGTGTT 65
EEF1A1 Forward CTTTGGGTCGCTTTGCTGTT 63 183 95.0
Reverse CCGTTCTTCCACCACTGATT 60
RPL41 Forward ATGAGAGCCAAGTGGAGGAA 60 219 94.0
Reverse TCAGAGGGCGATGAAGTTCT 60
RNPS1 Forward ACCCATGGTAGTTGCTGCTC 60 104 95.3
Reverse AGCTGGCTCTCCACTCACTC 60
SRP14 Forward CAGATGGCTTATTCAAACCTCCT 61 181 99.9
BMC Medical Genomics 2008, 1:64 http://www.biomedcentral.com/1755-8794/1/64
Page 4 of 12 (page number not for citation purposes)
In geNorm analysis, the calculated gene stability measure (M) relies on the principle that the ratio of two ideal ref-erence genes will be identical in all samples. M is calcu-lated as the average pairwise variation between a particular gene and all other genes in the analysis. Decreasing expression stability occurs when one or more of the genes is not constantly expressed. At each step in the analysis the least stable gene (highest M-value) is excluded and M is recalculated. This process continues in a step-wise manner until the two most stable genes remain. To determine the optimum number of genes for normalization, the two most stable genes are used as a starting point. Genes are added sequentially (from most stable to least stable) until the pairwise variation between two sequential normalization factors drops below a set threshold, indicating that the prior gene set is sufficient for accurate normalization [5]. A large variation indicates that the added gene has a significant effect and should preferably be included, provided it is stably expressed. However, genes that are less stably expressed also give high pairwise variation because they have a different pat-tern of expression compared with the more stably expressed genes. Therefore, to achieve accurate normaliza-tion, less stable genes should not be included in calcula-tion of the normalizacalcula-tion factor, despite their high pairwise variation values. Based on their findings Vandes-ompele et. al. recommended setting the pairwise variation threshold at 0.15 [5].
Using the geNorm algorithm, normalization factors were calculated by transforming Ct values into quantities (using standard curves or the comparative Ct method), setting the highest relative quantity for each gene to 1, and scaling the expression value for all other samples to a pro-portion relative to this highest value. Normalization fac-tors using multiple genes were determined by calculating the geometric mean of the scaled reference genes.
Statistical analyses
Univariate analyses were performed using analysis of var-iance to compare gene expression levels in heart-failed and non heart-failed groups. Gene expression data dis-played consistently skewed distributions and hence these data were log-transformed and geometric means with 95% confidence intervals have been reported. Correla-tions between expression levels of ribosomal genes and between normalization factors generated with two, three, four or five genes were calculated using Pearson correla-tion coefficients. All statistical analyses were performed with SPSS version 16 (SPSS Inc., Chicago, IL). A p-value < 0.05 was taken to indicate statistical significance.
Results
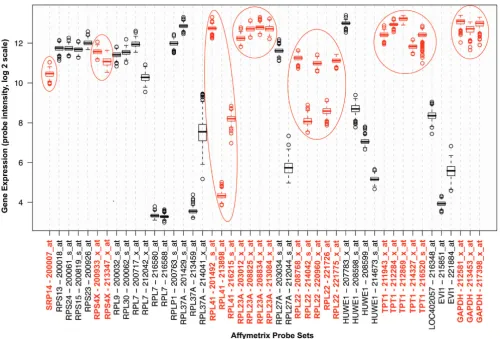
Twenty genes were identified as being represented by at least one probe set exhibiting low variation and high
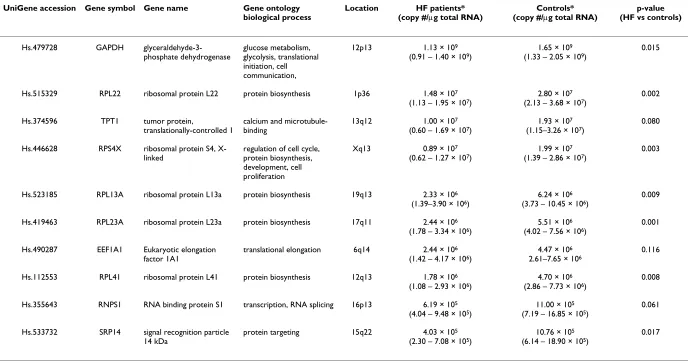
abundance among all samples (Figure 1). From this anal-ysis 7 genes were selected as candidate reference genes for further testing with RT-qPCR based on whether other probe sets for that gene also had small variance and high abundance across samples. The genes selected were GAPDH, RPL22, RPS4X, TPT1, RPL23A, RPL41 and SRP14 (see Table 2 for full gene name, chromosomal loca-tion, function and expression levels in heart-failed and control tissue). In addition, analysis of 50 genes previ-ously used or proposed by prior studies as reference genes [6,10,14] identified an additional three genes with small variance across probes: RPL13A, EEF1A1 and RNPS1 (Table 2, see Additional file 1 for Affymetrix probe inten-sities for all 50 genes). Thus a total of 10 genes were selected as candidates for testing, of which 4 encoded ribosomal proteins (RPL22, RPL23A, RPL41 and RPL13A) and are involved in protein biosynthesis. Because the expression levels of the ribosomal genes were tightly cor-related (Table 3) and co-regulation of genes may con-found geNorm analyses, only one of the ribosomal proteins could be included in the analysis. A preliminary analysis identified RPL13A as the most stable ribosomal gene for inclusion in the geNorm analysis (data not shown). The remaining ribosomal genes were excluded. There was no relationship between the functional class of any of the other genes (Table 2).
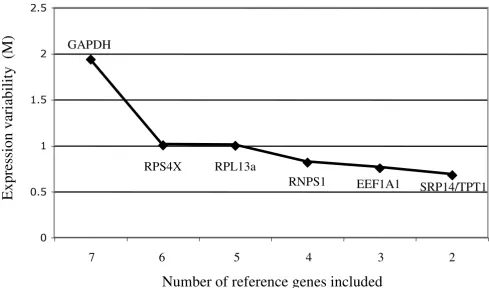
Genes were ranked from least stable to most stable by geNorm analysis: GAPDH, RPS4X, RPL13A, RNPS1, EEF1A1, TPT1/SRP14 (Figure 2). All genes had high expression stability (M-values <1), below the default limit of M = 1.5, except for GAPDH. GAPDH was considerably more variably expressed (M-value = 1.94). GeNorm anal-ysis indicated that the top five most stable genes would be needed for reliable normalization of RT-qPCR data (geNorm recommended threshold = 0.15, Figure 3).
Univariate analysis showed that the expression levels of all candidate reference genes except for TPT1 (p = 0.080), EEF1A1 (p = 0.116) and RNPS1 (p = 0.061) were signifi-cantly lower in the myocardium of end-stage heart failure patients compared with non heart-failed donors (Table 2). Thus, these genes have utility as a reference within heart-failed myocardium samples or non-failed donor myocardium samples separately, but not for comparing gene expression between these groups. Notably expres-sion levels of the commonly used reference gene, GAPDH, differed significantly between failed and non-failed myo-cardium (p = 0.015, Table 2).
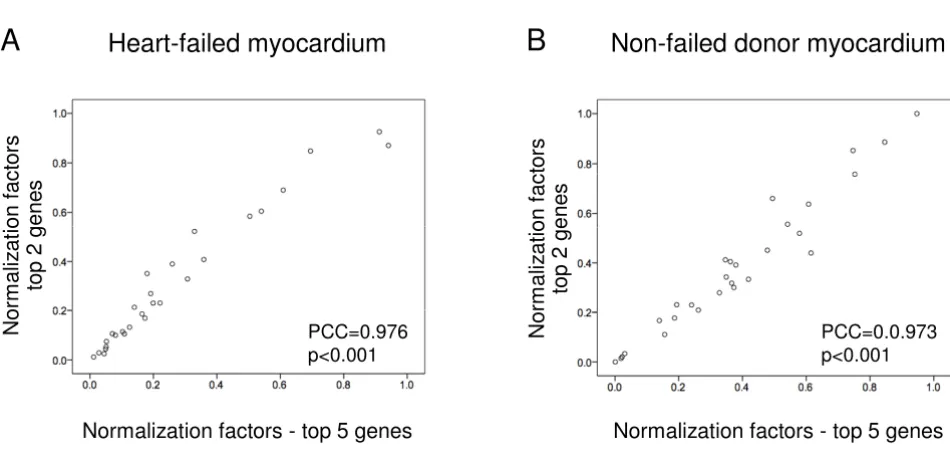
genes and correlated with the original set of normaliza-tion factors generated using all five top-ranked genes. Very tight correlation was observed between normalization fac-tors for all gene sets (Pearson correlation coefficients, heart-failed samples: 0.976–0.995, p < 0.001; non-failed controls: 0.973–0.992, p < 0.001). Figure 4 illustrates the tight correlation between normalization factors generated with the top two (SRP14 and TPT1) and the top five most stable genes, indicating that as few as two genes may be sufficient for reliable normalization within failed and non-failed myocardium. Normalization factors generated using SRP14 and TPT1 were not correlated with GAPDH levels, in failed myocardium (Pearson correlation coeffi-cient = -0.153, p = 0.436) or non-failed myocardium (Pearson correlation coefficient = -0.181, p = 0.356),
sug-gesting that normalization of gene expression data with GAPDH in these samples would be inappropriate.
The expression levels of TPT1, EEF1A1 and RNPS1, did not differ significantly between failed and non-failed human myocardium samples (Table 2). These genes ranked among the top four most stable genes of those tested (Figure 2). Normalization of gene expression in failed and non-failed myocardium using these genes was tested by comparing normalized and raw expression levels of NPPB, a gene known to be up-regulated in heart-failed heart tissue. In the raw data NPPB levels were higher in heart-failed patients compared with controls, but the dif-ference did not reach statistical significance (p = 0.058, Table 4). In normalized data, NPPB levels were
signifi-Selection of candidate reference genes
Figure 1
BMC
Med
ical
Ge
nomics
200
8,
1
:64
http
://www.bio
m
e
dcent
ral.com/175
5-879
4/1/6
4
Pa
ge 6 of
1
2
(page nu
mber not
for
cit
a
tion pur
poses)
Table 2: Candidate cardiac reference genes ranked in order of abundance
UniGene accession Gene symbol Gene name Gene ontology biological process
Location HF patients* (copy #/μg total RNA)
Controls* (copy #/μg total RNA)
p-value (HF vs controls)
Hs.479728 GAPDH glyceraldehyde-3-phosphate dehydrogenase
glucose metabolism, glycolysis, translational initiation, cell communication,
12p13 1.13 × 10⁹
(0.91 – 1.40 × 10⁹)
1.65 × 10⁹
(1.33 – 2.05 × 10⁹)
0.015
Hs.515329 RPL22 ribosomal protein L22 protein biosynthesis 1p36 1.48 × 10⁷
(1.13 – 1.95 × 10⁷)
2.80 × 10⁷
(2.13 – 3.68 × 10⁷)
0.002
Hs.374596 TPT1 tumor protein,
translationally-controlled 1
calcium and microtubule-binding
13q12 1.00 × 10⁷
(0.60 – 1.69 × 10⁷)
1.93 × 10⁷
(1.15–3.26 × 10⁷)
0.080
Hs.446628 RPS4X ribosomal protein S4, X-linked
regulation of cell cycle, protein biosynthesis, development, cell proliferation
Xq13 0.89 × 10⁷
(0.62 – 1.27 × 10⁷)
1.99 × 10⁷
(1.39 – 2.86 × 10⁷)
0.003
Hs.523185 RPL13A ribosomal protein L13a protein biosynthesis 19q13 2.33 × 10⁶
(1.39–3.90 × 10⁶)
6.24 × 10⁶
(3.73 – 10.45 × 10⁶)
0.009
Hs.419463 RPL23A ribosomal protein L23a protein biosynthesis 17q11 2.44 × 10⁶
(1.78 – 3.34 × 10⁶)
5.51 × 10⁶
(4.02 – 7.56 × 10⁶)
0.001
Hs.490287 EEF1A1 Eukaryotic elongation factor 1A1
translational elongation 6q14 2.44 × 10⁶
(1.42 – 4.17 × 10⁶)
4.47 × 10⁶
2.61–7.65 × 10⁶
0.116
Hs.112553 RPL41 ribosomal protein L41 protein biosynthesis 12q13 1.78 × 10⁶
(1.08 – 2.93 × 10⁶)
4.70 × 10⁶
(2.86 – 7.73 × 10⁶)
0.008
Hs.355643 RNPS1 RNA binding protein S1 transcription, RNA splicing 16p13 6.19 × 10⁵
(4.04 – 9.48 × 10⁵)
11.00 × 10⁵
(7.19 – 16.85 × 10⁵)
0.061
Hs.533732 SRP14 signal recognition particle 14 kDa
protein targeting 15q22 4.03 × 10⁵
(2.30 – 7.08 × 10⁵)
10.76 × 10⁵
(6.14 – 18.90 × 10⁵)
0.017
cantly higher in heart-failed patients compared with con-trols (p = 0.023, Table 4). Removing the least stable gene, RNPS1, from the pool of reference genes only marginally affected the results (p = 0.024, Table 4). Mean NPPB levels were almost identical to data normalized with RNPS1 included, indicating that as few as two genes (TPT1 and EEF1A1) may be sufficient for reliable normalization. Normalization factors generated using TPT1, EEF1A1 and RNPS1 were not correlated with GAPDH levels (Pearson correlation coefficient = -0.085, p = 0.535). Normalizing NPPB to GAPDH alone gave a larger difference between
failed and non-failed myocardium (4.2-fold, p = 0.012, Table 4) compared with data normalized with TPT1, EEF1A1 and RNPS1 combined (3.4-fold, p = 0.023, Table 4).
Discussion
Validation of tissue-specific reference genes is a funda-mental first-step in RT-qPCR analysis. We have identified two genes, SRP14 and TPT1, that in combination can be used for accurate and reliable normalization of RT-qPCR gene expression data within failed human myocardium and non-failed human myocardium separately, and two genes, TPT1 and EEF1A1 that are more stably expressed than GAPDH and may be used for normalization of RT-qPCR data when comparing gene expression levels between failed and non-failed human myocardium sam-ples.
The physiological functions of SRP14, TPT1 and EEF1A1 relate to important independent cellular processes, emphasizing their utility as reference genes. SRP14 is a component of the signal recognition particle, a univer-sally conserved ribonucleoprotein complex that mediates
Table 3: Pearson correlations of expression levels of ribosomal genes
RPL13A RPL22 RPL23A RPL41
RPL13A 1.00 0.851 p < 0.001
0.866 p < 0.001
0.952 p < 0.001
RPL22 1.00 0.886
p < 0.001
0.831 p < 0.001
RPL23A 1.00 0.903
p < 0.001
RPL41 1.00
Average expression variability of reference genes (M), during stepwise exclusion of the least stable gene
Figure 2
Average expression variability of reference genes (M), during stepwise exclusion of the least stable gene. At each step the most variable gene (highest M-value) is excluded and M is recalculated. This process continues in a step-wise manner until the two most stable genes remain. The figure indicates that GAPDH is least stably expressed relative to the other genes, and that SRP14 and TPT1 have the most stable expression.
Ex
pre
ssion
va
ri
ab
ilit
y
(M)
0 0.5 1 1.5 2 2.5
GAPDH
RPS4X
RPL13a
RNPS1
EEF1A1
SRP14/TPT1
7
6
5
4
3
2
BMC Medical Genomics 2008, 1:64 http://www.biomedcentral.com/1755-8794/1/64
Page 8 of 12 (page number not for citation purposes)
targeting of membrane and secretory proteins to the endo-plasmic reticulum [19]. TPT1 encodes the abundant and highly conserved translationally controlled tumor protein (TCTP), which is reported to play a role in cell growth and cell cycle progression [20]. EEF1A1 is a component of the alpha subunit of the elongation factor-1 complex, which facilitates the enzymatic delivery of aminoacyl tRNAs to the ribosome [21]. Notably, TPT1 is expressed in a tissue-and development-specific manner, suggesting that its util-ity as a reference gene in human myocardium may be lim-ited to analyses in adult hearts [22].
To date, reference genes have been identified for a wide range of species, tissue types, experimental conditions and disease states. The typical methodological approach used in these studies has been to test a selection of commonly used reference genes such as GAPDH, β-actin, α-tubulin, hypoxanthine phosphoribosyl-transferase 1 and 18S RNA to identify the most stable combination specific to the sample and experimental conditions under investigation [23-29]. A small number of studies have reported that none of the traditional reference genes tested were
appro-priate for use in the particular setting investigated [30-32]. More recently, a genome-wide approach has been employed, where candidate reference genes selected from publicly available microarray data has lead to identifica-tion of novel transcripts that are more stably expressed than commonly used reference genes. These studies can be broadly classified into two groups: those that screen expression data from a diverse range of tissue types and species to identify transcripts that are stably and ubiqui-tously expressed and may therefore have board utility as reference genes [6,10,33-35], and those that screen array data from a specific tissue or disease setting to identify a set of candidate genes for validation in an independent sample set, as in the present study. To date, studies in the latter group have validated panels of novel reference genes in human normal and cancerous lung tissues [36,37], human normal and tumor gastrointestinal tissues [38], human embryonic stem cells [39], porcine mammary tis-sue [40], canine osteoarthritic joint tistis-sue [41], barley [42] and lymphoblastoid cell lines and fibroblasts [43]. Nota-bly, Peltier et. al. have identified a set of microRNA refer-ences for use in RT-qPCR analysis of microRNAs in
Determination of the ideal number of reference genes for normalization
Figure 3
Determination of the ideal number of reference genes for normalization. Using the two most stable genes as a start-ing point (SRP14 and TPT1), genes are added sequentially (from most stable to least stable) until the pairwise variation between two sequential normalization factors drops below the recommended threshold of 0.15, indicating that the prior gene set is sufficient for accurate normalization. Variation greater than 0.15 indicates that the added gene has a significant effect and should preferably be included, provided it is stably expressed. This figure shows that the sixth most stable gene (RPS4X) is not required for reliable normalization of RT-PCR data.
0
0.05
0.10
0.15
0.20
0.25
0.30
+RNPS1
+RPL13A
+RPS4X
+GAPDH
Pai
rw
ise va
ri
at
ion (V
)
normal and cancerous human solid tumors [44]. How-ever, no validated universal reference genes have been identified.
In the present study, screening of Affymetrix cardiac expression data enabled us to identify four novel genes and six genes commonly used, or recommended for use, as references in human tissue, as potentially suitable for use in heart tissue RT-qPCR analyses. Interestingly, there were striking similarities between the genes we identified as stably expressed in cardiac microarrays and those iden-tified in a recent meta-analysis of 13,629 human gene arrays of a diverse range of cell types and experimental conditions [6]. Both studies identified SRP14, RPL13A
and RPL22 as being highly stably expressed, and found an over-representation of ribosomal genes among the top ranked transcripts. However, we also identified novel can-didate genes specific to heart tissue, including TPT1, one of the most stably expressed genes in our analysis. Our finding that all genes selected were more stably expressed than GAPDH is consistent with an analogous study in gas-trointestinal normal and tumor tissues [38], where GAPDH was the less stably expressed genes in tissue from stomach, small intestine, liver, and lymph nodes com-pared with expression of 8 candidate reference genes selected from analysis of publicly available Affymetrix array data.
Correlation of individual normalization factors generated using the top five most stable genes and the top two most stable genes
Figure 4
Correlation of individual normalization factors generated using the top five most stable genes and the top two most stable genes. Tight correlation between normalization factors indicates that as few as two genes may be sufficient for reliable normalization of RT-qPCR data for (A) heart-failed myocardium and (B) non-failed donor myocardium. PCC = Pearson correlation coefficient.
Heart-failed myocardium
Non-failed donor myocardium
Normalization factors - top 5 genes Normalization factors - top 5 genes
Nor
m
ali
z
at
ion f
a
c
tor
s
top 2 gene
s
Nor
m
ali
z
at
ion f
a
c
tor
s
top 2 gene
s
A
B
PCC=0.976 p<0.001
PCC=0.0.973 p<0.001
Table 4: Normalization of NPPB using fewer than three reference genes
Genes used for normalization
Correlation with normalization factors using TPT1, EEF1A1 & RNPS1
Normalized NPPB levels
(geometric mean and 95% CI, copy #/μg total RNA)
PCC p-value for correlation HF patients Controls p-value (HF vs controls)
TPT1, EEF1A1 & RNPS1
1.000 - 11.3 × 10⁶
(5.3 – 24.0 × 10⁶)
3.3 × 10⁶
(1.5 – 6.9 × 10⁶)
0.023
TPT1 & EEF1A1 0.989 <0.001 11.2 × 10⁶
(5.3 – 23.9 × 10⁶)
3.3 × 10⁶
(1.5 – 7.0 × 10⁶)
0.024
GAPDH -0.085 0.535 77.5 × 10⁶
(35.6 – 168.9 × 10⁶)
18.5 × 10⁶
(8.5 – 40.4 × 10⁶)
0.012
Raw data - - 14.1 × 10⁶
(6.6 – 30.4 × 10⁶)
4.9 × 10⁶
(2.3 – 10.6 × 10⁶)
0.058
BMC Medical Genomics 2008, 1:64 http://www.biomedcentral.com/1755-8794/1/64
Page 10 of 12 (page number not for citation purposes)
GeNorm [5] is one of several statistical algorithms that evaluate the relative expression stability of genes on the basis of non-normalized expression levels. Other pro-grams for assessing gene stability include Best keeper [45], NormFinder [46], Global Pattern Recognition [47] and equivalence tests [48]. These programs have provided a rational basis for selection of reference genes for normali-zation of RT-qPCR data. While the relative gene stability rankings may vary subtly depending on which algorithm is applied [41,49,50], use of multiple reference genes pro-vides a considerably more robust result compared with relying on a single RNA transcript [5]. This reflects the het-erogeneity inherent in human samples related to age, gen-der, ethnicity, and gene-environment interactions. In the present study all donors were on life-support as a result of head trauma or cerebral vascular accident and thus the gene expression profile of the donor heart samples may have been affected by the traumatic events and acute drug treatments that preceded the donation of tissue. Similarly, gene expression in heart-failed tissue will vary depending on the etiology and duration of heart failure and chronic and acute drug treatments.
GeNorm analysis enables the ideal number of reference genes required for reliable normalization to be deter-mined. Our analysis indicated that the top five genes would be required for accurate normalization of RT-qPCR data within failed and non-failed human myocardium, however, the number of genes used needs to be a balance between accuracy and practical considerations. Realisti-cally, if two relatively stable genes have been identified, it is unnecessary to add more genes if the normalization fac-tor does not change markedly when they are included. We were able to demonstrate that as few as two genes may be sufficient for normalization in human myocardium (SRP14 and TPT1 for analysis within failed or non-failed tissue and TPT1 and EEF1A1 for comparisons of gene expression between these groups), as the variation between normalization factors generated using two, three, four or five genes was very small. Furthermore, when com-paring NPPB levels between failed and non-failed myocar-dium, removal of the least stable gene, RNPS1, impacted minimally on normalized NPPB levels, suggesting that TPT1 and EEF1A1 may be sufficient for normalization. This reflects the uniformity in expression stability across the top-ranked genes (Figure 2) and is equivalent to using a pairwise variation threshold of 0.23.
Several studies have demonstrated how a single, unvali-dated reference gene can generate biased results if it is itself altered by the experimental conditions [5,51-53], In contrast to GAPDH, the expression levels of TPT1 and EEF1A1 did not differ significantly between failed and non-failed human myocardium samples, and they were ranked as being considerably more stably expressed.
How-ever, because expression of both genes tended to be lower in failed myocardium compared with non-failed myocar-dium, TPT1 and EEF1A1 require further validation in a larger sample to confirm that their expression levels do not differ between these groups. Normalizing NPPB expression to GAPDH alone gave a greater difference in NPPB levels between failed and non-failed myocardium than the data normalized to TPT1 and EEF1A1. However, the expression levels of GAPDH were lower in failed heart samples compared with healthy hearts, and this will have artificially skewed the data. Normalizing NPPB expression to TPT1 and EEF1A1 gave a modestly significant differ-ence in NPPB levels between failed and non-failed myo-cardium that is more likely to reflect the true level of expression of NPPB in these two groups. In particular our finding that GAPDH is differentially expressed in failing and non-failing myocardium has implications for previ-ous RT-qPCR studies of human myocardium that have used GAPDH for normalization without validation.
We have identified reference genes for both failing and non-failing human myocardium that have significantly improved stability compared with the commonly used reference gene, GAPDH (SRP14 and TPT1 for analysis within failed or non-failed tissue and TPT1 and EEF1A1 for comparisons of gene expression between these groups). Our findings suggest that routine normalization of RT-qPCR data in human myocardium with GAPDH should be avoided as it was the least stably expressed of all genes tested. This highlights the importance of validating reference genes for normalization of RT-qPCR data. The reference genes identified in this study will enable more reliable interpretation of RT-qPCR results in these tissues. Whilst TPT1 and EEF1A1 require further validation in a larger study, these findings serve as a basic guideline for reference gene selection in human myocardium.
Conclusion
This study has identified a strategy for normalization of cardiac gene expression involving two reference genes, SRP14 and TPT1, that in combination may have broad application for accurate and reliable normalization of RT-qPCR data within failed human myocardium and non-failed human myocardium separately. In addition, for comparisons of gene expression between failed and non-failed human myocardium TPT1 and EEF1A1, in combi-nation, may provide a more reliable reference than GAPDH for normalization of RT-qPCR data for these analyses.
Abbreviations
Omni-bus; mRNA: messenger ribonucleic acid; NCBI: National Center for Biotechnology Information; NPPB: brain natri-uretic peptide precursor; PCR: polymerase chain reaction; RNA: ribonucleic acid; RNPS1: ribonucleic acid binding protein S1; RPL13A: ribosomal protein L13a; RPL22: ribosomal protein L22; RPL23A: ribosomal protein L23a; RPL41: ribosomal protein L41; RPS4X: ribosomal protein S4: X-linked; RT-qPCR: real-time polymerase chain reac-tion; SRP14: signal recognition particle 14; TCTP: transla-tionally controlled tumor protein; TPT1: tumor protein: translationally-controlled 1.
Competing interests
The authors declare that they have no competing interests.
Authors' contributions
APP was involved in the conception and design of the study, performed the gene expression studies and statisti-cal analysis, and wrote the first draft of the manuscript. LJE participated in the data acquisition and provided crit-ical revision of the manuscript. MAB performed the bioin-formatics analysis and provided critical revision of the manuscript. CSM was involved in the conception, design and coordination of the study and management of the Cleveland heart tissue bank. WES oversaw tissue acquisi-tion and data coordinaacquisi-tion. RWT was involved in the con-ception and coordination of the study and acquisition of funding. AMR was involved with acquisition of funding and provided critical revision of the manuscript. CMF contributed to the study design and performed statistical analysis. VAC was involved in the conception, design and coordination of the study, acquisition of funding, inter-pretation of the data and provided critical revision of the manuscript. All authors read and approved the final man-uscript.
Additional material
Acknowledgements
We gratefully acknowledge the donation of human myocardium by heart transplant patients and the families of heart donors for research purposes. This work was funded by the National Heart Foundation of New Zealand, the New Zealand Foundation of Research, Science and Technology and the Health Research Council of New Zealand.
References
1. Bustin SA: Absolute quantification of mRNA using real-time reverse transcription polymerase chain reaction assays. Jour-nal of molecular endocrinology 2000, 25:169-193.
2. Hendriks-Balk MC, Michel MC, Alewijnse AE: Pitfalls in the nor-malization of real-time polymerase chain reaction data. Basic research in cardiology 2007, 102:195-197.
3. Wang T, Brown MJ: mRNA quantification by real time TaqMan polymerase chain reaction: validation and comparison with RNase protection. Analytical biochemistry 1999, 269:198-201. 4. Huggett J, Dheda K, Bustin S, Zumla A: Real-time RT-PCR
nor-malisation; strategies and considerations. Genes and immunity
2005, 6:279-284.
5. Vandesompele J, De Preter K, Pattyn F, Poppe B, van Roy N, De Paepe A, Speleman F: Accurate normalization of real-time quantitative RT-PCR data by geometric averaging of multi-ple internal control genes. Genome biology 2002,
3:RESEARCH0034.
6. de Jonge HJ, Fehrmann RS, de Bont ES, Hofstra RM, Gerbens F, Kamps WA, de Vries EG, Zee AG van der, te Meerman GJ, ter Elst A:
Evidence based selection of housekeeping genes. PLoS ONE
2007, 2:e898.
7. Brattelid T, Tveit K, Birkeland JA, Sjaastad I, Qvigstad E, Krobert KA, Hussain RI, Skomedal T, Osnes JB, Levy FO: Expression of mRNA encoding G protein-coupled receptors involved in congestive heart failure – a quantitative RT-PCR study and the question of normalisation. Basic research in cardiology 2007, 102:198-208. 8. Schmittgen TD, Zakrajsek BA: Effect of experimental treatment
on housekeeping gene expression: validation by real-time, quantitative RT-PCR. Journal of biochemical and biophysical methods
2000, 46:69-81.
9. Suzuki T, Higgins PJ, Crawford DR: Control selection for RNA quantitation. BioTechniques 2000, 29:332-337.
10. Warrington JA, Nair A, Mahadevappa M, Tsyganskaya M: Compari-son of human adult and fetal expression and identification of 535 housekeeping/maintenance genes. Physiological genomics
2000, 2:143-147.
11. Hannenhalli S, Putt ME, Gilmore JM, Wang J, Parmacek MS, Epstein JA, Morrisey EE, Margulies KB, Cappola TP: Transcriptional genomics associates FOX transcription factors with human heart fail-ure. Circulation 2006, 114:1269-1276.
12. Hubbell E, Liu WM, Mei R: Robust estimators for expression analysis. Bioinformatics (Oxford, England) 2002, 18:1585-1592. 13. A Language and Environment for Statistical Computing
[http://www.R-project.org]
14. geNorm [http://medgen.ugent.be/~jvdesomp/genorm/]
15. Yang J, Moravec CS, Sussman MA, DiPaola NR, Fu D, Hawthorn L, Mitchell CA, Young JB, Francis GS, McCarthy PM, Bond M:
Decreased SLIM1 expression and increased gelsolin expres-sion in failing human hearts measured by high-density oligo-nucleotide arrays. Circulation 2000, 102:3046-3052.
16. Zakhary DR, Moravec CS, Stewart RW, Bond M: Protein kinase A (PKA)-dependent troponin-I phosphorylation and PKA reg-ulatory subunits are decreased in human dilated cardiomy-opathy. Circulation 1999, 99:505-510.
17. Ellmers LJ, Scott NJ, Piuhola J, Maeda N, Smithies O, Frampton CM, Richards AM, Cameron VA: Npr1-regulated gene pathways con-tributing to cardiac hypertrophy and fibrosis. Journal of molec-ular endocrinology 2007, 38:245-257.
18. Rozen S, Skaletsky H: Primer3 on the WWW for general users and for biologist programmers. Methods Mol Biol 2000,
132:365-386.
19. Lakkaraju AK, Mary C, Scherrer A, Johnson AE, Strub K: SRP keeps polypeptides translocation-competent by slowing transla-tion to match limiting ER-targeting sites. Cell 2008,
133:440-451.
Additional file 1
Selection of candidate reference genes. Expression levels of probe sets for 50 genes previously used or recommended for use as reference genes from publically available Affymetrix gene expression profiles of left ventricle myocardium from 195 heart transplant recipients and 16 unmatched heart donors [11] (GEO accession GSE5406, http://
www.ncbi.nlm.nih.gov). RPL13A, EEF1A1 and RNPS1 (shown in red) were selected as candidate reference genes from this analysis, based on their high abundance and consistent expression across the majority of probes. Affymetrix probe set nomenclature is preceded by the gene symbol. Boxes indicate median and interquartile range, whisker length is 150% of the interquartile range. Observations beyond the whiskers are denoted by open circles.
Click here for file
BMC Medical Genomics 2008, 1:64 http://www.biomedcentral.com/1755-8794/1/64
Page 12 of 12 (page number not for citation purposes)
20. Bommer UA, Thiele BJ: The translationally controlled tumour protein (TCTP). The international journal of biochemistry & cell biology
2004, 36:379-385.
21. Brands JH, Maassen JA, van Hemert FJ, Amons R, Moller W: The pri-mary structure of the alpha subunit of human elongation fac-tor 1. Structural aspects of guanine-nucleotide-binding sites.
European journal of biochemistry/FEBS 1986, 155:167-171.
22. Thiele H, Berger M, Skalweit A, Thiele BJ: Expression of the gene and processed pseudogenes encoding the human and rabbit translationally controlled tumour protein (TCTP). European journal of biochemistry/FEBS 2000, 267:5473-5481.
23. Ahn K, Huh JW, Park SJ, Kim DS, Ha HS, Kim YJ, Lee JR, Chang KT, Kim HS: Selection of internal reference genes for SYBR green qRT-PCR studies of rhesus monkey (Macaca mulatta) tis-sues. BMC molecular biology 2008, 9:78.
24. Daud II, Scott ME: Validation of reference genes in cervical cell samples from human papillomavirus-infected and -unin-fected women for quantitative reverse transcription-PCR assays. Clin Vaccine Immunol 2008, 15:1369-1373.
25. Langnaese K, John R, Schweizer H, Ebmeyer U, Keilhoff G: Selection of reference genes for quantitative real-time PCR in a rat asphyxial cardiac arrest model. BMC molecular biology 2008, 9:53. 26. Olbrich M, Gerstner E, Welzl G, Fleischmann F, Osswald W, Bahnweg G, Ernst D: Quantification of mRNAs and housekeeping gene selection for quantitative real-time RT-PCR normalization in European beech (Fagus sylvatica L.) during abiotic and biotic stress. Zeitschrift fur Naturforschung 2008, 63:574-582. 27. Perez R, Tupac-Yupanqui I, Dunner S: Evaluation of suitable
ref-erence genes for gene expression studies in bovine muscular tissue. BMC molecular biology 2008, 9:79.
28. Waxman S, Wurmbach E: De-regulation of common house-keeping genes in hepatocellular carcinoma. BMC genomics
2007, 8:243.
29. Yoo WG, Kim TI, Li S, Kwon OS, Cho PY, Kim TS, Kim K, Hong SJ:
Reference genes for quantitative analysis on Clonorchis sin-ensis gene expression by real-time PCR. Parasitology research
2008.
30. Giricz O, Lauer-Fields JL, Fields GB: The normalization of gene expression data in melanoma: investigating the use of glyc-eraldehyde 3-phosphate dehydrogenase and 18S ribosomal RNA as internal reference genes for quantitative real-time PCR. Analytical biochemistry 2008, 380:137-139.
31. Gutierrez L, Mauriat M, Guenin S, Pelloux J, Lefebvre JF, Louvet R, Rusterucci C, Moritz T, Guerineau F, Bellini C, van Wuytswinkel O:
The lack of a systematic validation of reference genes: a seri-ous pitfall undervalued in reverse transcription-polymerase chain reaction (RT-PCR) analysis in plants. Plant biotechnology journal 2008, 6:609-618.
32. Sellars MJ, Vuocolo T, Leeton LA, Coman GJ, Degnan BM, Preston NP: Real-time RT-PCR quantification of Kuruma shrimp transcripts: a comparison of relative and absolute quantifica-tion procedures. Journal of biotechnology 2007, 129:391-399. 33. Frericks M, Esser C: A toolbox of novel murine house-keeping
genes identified by meta-analysis of large scale gene expres-sion profiles. Biochimica et biophysica acta 2008.
34. Lee S, Jo M, Lee J, Koh SS, Kim S: Identification of novel universal housekeeping genes by statistical analysis of microarray data. J Biochem Mol Biol 2007, 40(2):226-231.
35. Zhu J, He F, Song S, Wang J, Yu J: How many human genes can be defined as housekeeping with current expression data?
BMC genomics 2008, 9:172.
36. Saviozzi S, Cordero F, Lo Iacono M, Novello S, Scagliotti GV, Calo-gero RA: Selection of suitable reference genes for accurate normalization of gene expression profile studies in non-small cell lung cancer. BMC cancer 2006, 6:200.
37. Su LJ, Chang CW, Wu YC, Chen KC, Lin CJ, Liang SC, Lin CH, Whang-Peng J, Hsu SL, Chen CH, Huang CY: Selection of DDX5 as a novel internal control for Q-RT-PCR from microarray data using a block bootstrap re-sampling scheme. BMC genomics 2007, 8:140.
38. Kidd M, Nadler B, Mane S, Eick G, Malfertheiner M, Champaneria M, Pfragner R, Modlin I: GeneChip, geNorm, and gastrointestinal tumors: novel reference genes for real-time PCR. Physiological genomics 2007, 30:363-370.
39. Synnergren J, Giesler TL, Adak S, Tandon R, Noaksson K, Lindahl A, Nilsson P, Nelson D, Olsson B, Englund MC, Abbot S, Sartipy P:
Dif-ferentiating human embryonic stem cells express a unique housekeeping gene signature. Stem cells (Dayton, Ohio) 2007,
25:473-480.
40. Tramontana S, Bionaz M, Sharma A, Graugnard DE, Cutler EA, Ajmone-Marsan P, Hurley WL, Loor JJ: Internal controls for quan-titative polymerase chain reaction of swine mammary glands during pregnancy and lactation. Journal of dairy science
2008, 91:3057-3066.
41. Maccoux LJ, Clements DN, Salway F, Day PJ: Identification of new reference genes for the normalisation of canine osteoar-thritic joint tissue transcripts from microarray data. BMC molecular biology 2007, 8:62.
42. Faccioli P, Ciceri GP, Provero P, Stanca AM, Morcia C, Terzi V: A combined strategy of "in silico" transcriptome analysis and web search engine optimization allows an agile identification of reference genes suitable for normalization in gene expres-sion studies. Plant molecular biology 2007, 63:679-688.
43. de Brouwer AP, van Bokhoven H, Kremer H: Comparison of 12 reference genes for normalization of gene expression levels in Epstein-Barr virus-transformed lymphoblastoid cell lines and fibroblasts. Molecular diagnosis & therapy 2006, 10:197-204. 44. Peltier HJ, Latham GJ: Normalization of microRNA expression
levels in quantitative RT-PCR assays: identification of suita-ble reference RNA targets in normal and cancerous human solid tissues. RNA 2008, 14(5):844-852.
45. Pfaffl MW, Tichopad A, Prgomet C, Neuvians TP: Determination of stable housekeeping genes, differentially regulated target genes and sample integrity: BestKeeper – Excel-based tool using pair-wise correlations. Biotechnology letters 2004,
26:509-515.
46. Andersen CL, Jensen JL, Orntoft TF: Normalization of real-time quantitative reverse transcription-PCR data: a model-based variance estimation approach to identify genes suited for normalization, applied to bladder and colon cancer data sets. Cancer research 2004, 64:5245-5250.
47. Akilesh S, Shaffer DJ, Roopenian D: Customized molecular phe-notyping by quantitative gene expression and pattern recog-nition analysis. Genome research 2003, 13:1719-1727.
48. Haller F, Kulle B, Schwager S, Gunawan B, von Heydebreck A, Sult-mann H, Fuzesi L: Equivalence test in quantitative reverse tran-scription polymerase chain reaction: confirmation of reference genes suitable for normalization. Analytical biochem-istry 2004, 335:1-9.
49. Robinson TL, Sutherland IA, Sutherland J: Validation of candidate bovine reference genes for use with real-time PCR. Veterinary immunology and immunopathology 2007, 115:160-165.
50. Spinsanti G, Panti C, Lazzeri E, Marsili L, Casini S, Frati F, Fossi CM:
Selection of reference genes for quantitative RT-PCR stud-ies in striped dolphin (Stenella coeruleoalba) skin biopsstud-ies.
BMC molecular biology 2006, 7:32.
51. Bas A, Forsberg G, Hammarstrom S, Hammarstrom ML: Utility of the housekeeping genes 18S rRNA, beta-actin and glyceral-dehyde-3-phosphate-dehydrogenase for normalization in real-time quantitative reverse transcriptase-polymerase chain reaction analysis of gene expression in human T lym-phocytes. Scandinavian journal of immunology 2004, 59:566-573. 52. Dheda K, Huggett JF, Chang JS, Kim LU, Bustin SA, Johnson MA, Rook
GA, Zumla A: The implications of using an inappropriate ref-erence gene for real-time reverse transcription PCR data normalization. Analytical biochemistry 2005, 344:141-143. 53. Tricarico C, Pinzani P, Bianchi S, Paglierani M, Distante V, Pazzagli M,
Bustin SA, Orlando C: Quantitative real-time reverse tran-scription polymerase chain reaction: normalization to rRNA or single housekeeping genes is inappropriate for human tis-sue biopsies. Analytical biochemistry 2002, 309:293-300.
Pre-publication history
The pre-publication history for this paper can be accessed here: