R E S E A R C H
Open Access
Microbiome and ecotypic adaption of
Holcus lanatus
(L.) to extremes of its soil pH
range, investigated through transcriptome
sequencing
Ellen Young, Manus Carey, Andrew A. Meharg and Caroline Meharg
*Abstract
Background:Plants can adapt to edaphic stress, such as nutrient deficiency, toxicity and biotic challenges, by controlled transcriptomic responses, including microbiome interactions. Traditionally studied in model plant species with controlled microbiota inoculation treatments, molecular plant-microbiome interactions can be functionally investigated via RNA-Seq. Complex, natural plant-microbiome studies are limited, typically focusing on microbial rRNA and omitting functional microbiome investigations, presenting a fundamental knowledge gap. Here, root and shoot meta-transcriptome analyses, in tandem with shoot elemental content and root staining, were employed to investigate transcriptome responses in the wild grassHolcus lanatusand its associated natural multi-species eukaryotic microbiome. A full factorial reciprocal soil transplant experiment was employed, using plant ecotypes from two widely contrasting natural habitats, acid bog and limestone quarry soil, to investigate naturally occurring, and ecologically meaningful, edaphically driven molecular plant-microbiome interactions.
Results:Arbuscular mycorrhizal (AM) and non-AM fungal colonization was detected in roots in both soils. Staining showed greater levels of non-AM fungi, and transcriptomics indicated a predominance of Ascomycota-annotated genes. Roots in acid bog soil were dominated byPhialocephala-annotated transcripts, a putative growth-promoting endophyte, potentially involved in N nutrition and ion homeostasis. Limestone roots in acid bog soil had greater expression of other Ascomycete genera and Oomycetes and lower expression ofPhialocephala-annotated transcripts compared to acid ecotype roots, which corresponded with reduced induction of pathogen defense processes, particularly lignin biosynthesis in limestone ecotypes. Ascomycota dominated in shoots and limestone soil roots, butPhialocephala-annotated transcripts were insignificant, and no single Ascomycete genus dominated. Fusarium-annotated transcripts were the most common genus in shoots, withColletotrichumandRhizophagus (AM fungi) most numerous in limestone soil roots. The latter coincided with upregulation of plant genes involved in AM symbiosis initiation and AM-based P acquisition in an environment where P availability is low.
Conclusions:Meta-transcriptome analyses provided novel insights intoH.lanatustranscriptome responses, associated eukaryotic microbiota functions and taxonomic community composition. Significant edaphic and plant ecotype effects were identified, demonstrating that meta-transcriptome-based functional analysis is a powerful tool for the study of natural plant-microbiome interactions.
Keywords:Holcus lanatus, Eukaryotic microbiome, Meta-transcriptomics, Community composition, Gene expression, Gene function, Edaphic stress
* Correspondence:[email protected]
Institute for Global Food Security, Queens University Belfast, David Keir Building, Belfast BT9 5BN, Northern Ireland, UK
Background
Extremes of soil pH present strong selection pressures, particularly relating to nutrient availabilities. Soils with pH < 5.5 cause Al, Fe, Mn and H toxicities and simultan-eous P, N and base cation deficiencies, resulting in inhib-ition of root growth and poor productivity [1]. Neutral to alkaline soils are limited in Fe, Mn and P availability [1]. Decreasing soil bacterial activity with increasing soil acidity regulates N availability, with nitrate dominating at neutral to high pHs, ammonium at low pHs, and amino acids at extreme low pH [2]. Soil pH also influ-ences edaphic bacterial and fungal community composi-tions, including root-colonizing arbuscular mycorrhiza (AM) and non-AM fungi, with disparate edaphic condi-tions driving differences in root colonization within the same host species [3–5]. Non-AM fungi are abundant in all soils, including acid peatland [4], while AM fungi have been shown to occur at lower frequency in lower pH and waterlogged soils [5].
Components of the soil microbiome interact with plants in beneficial, neutral or pathogenic manners. AM and root endophytes have been shown to increase nutrient uptake, particularly P [6–8], and plants can actively encourage AM fungal colonization under low nutrient stress condi-tions [9]. Equally, fungi can influence gene expression in plants. Fungal induction of plant lipoxygenase and its as-sociated pathway has been linked to fungal-mediated tolerance traits, and plant defenses primed or boosted by fungi include antioxidant, phenol and flavonoid produc-tion and toxic metal chelation [10–13]. Fungal colonization can improve plant resistance to pathogen in-fection [13], salt stress [12] and toxic metal(loid) stress [11,13,14], the latter of which is common on acidic soils due to higher bioavailability of Al, Fe and Mn [2, 15]. Pathogenic fungal elicitors cause initiation of plant defen-sive responses upon detection [16, 17], but necrotrophic fungi can in turn manipulate plant defenses to facilitate initial infection, with further manipulation of the oxidative burst response to continue colonization [18].
Given these interactions, characterizing host-microbiome relationships therefore require analysis of gene expression and functional responses from both components, plant and fungal. Furthermore, given that plant-microbiome interactions are strongly influenced by edaphic factors, they can be considered key to the un-derstanding of plant edaphic stress response and crucial for our understanding of plant adaptation to environ-mental change [19]. Assessment of soil and root micro-biomes has traditionally been taxonomy based, using amplicon sequencing of the rRNA operon [20, 21], which, as normally DNA based, cannot distinguish be-tween metabolically active and dormant components of the plant-microbiome system or provide information
about functional roles. Furthermore, as
plant-microbiome interactions involve multiple microbial spe-cies, there must be a high level of functional redun-dancy, with a range of species fulfilling the same or similar functions in different environmental niches, which a gene expression-based investigation can address. For prokaryotes, PICRUSt (phylogenetic investigation of communities by reconstruction of unobserved states) analysis [22] allows inference of metagenomes and meta-bolic potential from amplicon sequencing data, but simi-lar analyses are not available for fungi and other eukaryotic microbes. Even for prokaryotes, gene expres-sion data is the only way to measure true activity. As next-generation sequencing (NGS), via sequencing of polyA-selected RNAs, provides a technology that can capture gene expression of all eukaryotes in any one sample, this is a convenient way to investigate host and eukaryotic microbiomes in tandem. Published annotated genomes and protein databases for plants, fungi and protists facilitate a functional meta-transcriptomic ap-proach that can uncover eukaryotic microbiome func-tion in the context of plant transcriptome analysis. Such integrated analyses can further the holistic understand-ing of edaphic stress, plant ecotype adaptation and eco-system function [23,24].
Traditionally, microbial genome alignment is used to remove contaminating non-plant transcripts for a plant-centered analysis, but gene expression and func-tion of the host and microbes are increasingly being in-vestigated in tandem [25]. However, this typically involves the study of model plants in controlled inter-actions with specific fungi, to facilitate alignment of reads to published genomes for assignment of plant versus microbiome transcripts [26–32]. Studies of more complex, ecologically relevant and genetically diverse non-model plant-microbiome functional interactions are lacking. This current investigation addresses this gap in our knowledge. Using a meta-transcriptomics approach, we have analysed distinct genotypes of Holcus lanatus (L.) selected from two widely contrast-ing edaphic environments.
beneficial environment-specific plant-microbiome inter-actions. Because of its inherent plasticity, H. lanatus is an ideal species to study plant-microbiome adaptations to edaphic stress, including simultaneous investigation of plant and eukaryotic microbiome responses to varia-tions in soil characteristics influenced by pH, as pre-sented in this study. Extremes of pH present a wide range of challenges to plants [41], and H. lanatus is tolerant of a wide soil pH range, from at least 3.5 to 8 [33, 34]. This is exemplified by the populations used in this current study, collected from an acid bog of pH 3.5 (mainly composed of organic material) and a limestone quarry soil of pH 7.5 (calcareous clay, with low level of organic matter content). Biotic factors, particularly soil fungal communities, will contrast in these habitats and will involve beneficial, neutral and detrimental soil-specific plant-microbial interactions [1].
In this study, 10 H.lanatusgenotypes, 5 acid bog and 5 limestone quarry, were investigated using a full factor-ial reciprocal soils of origin transplant experiment. The aim was to capture the natural genetic diversity in the host and microbiome via RNA-Seq analysis of root and shoot of this species. Root staining was employed to val-idate AM and non-AM fungal colonization levels, and shoot elemental content to aid interpretation in the con-text of nutrient ion homeostasis and edaphic stress re-sponse. To our knowledge, no other study to date has investigated the overall functional and taxonomic diver-sity of ecologically relevant plant root and shoot eukaryotic microbiomes within the ecological context of ecotype plasticity and edaphic stress adaptation.
Methods
Plants and soils
Intact H. lanatusplants (shoot and root ball) were col-lected along with topsoil from two locations in Northern Ireland; a disused limestone quarry, pH 7.5, Map. Ref. NR 23472 02816; and an acidic peat bog, pH 3.5, Map. Ref. NW 02918 19660. Plants were collected at least 2 m apart, ensuring each plant represents a unique genotype of that particular habitat. H. lanatuscan be propagated from unrooted tillers as roots develop from tiller basal nodes. Unrooted tillers were planted into compost (John Innes no.2) and maintained in a growth chamber (Memmert, Germany) at 20 °C, 10000 LUX light inten-sity and 12 h day:night cycle, irrigated to water holding capacity. Therefore, all tillers used in subsequent experi-mentation originated from under the same conditions.
For the full factorial reciprocal transplant experiment, individual unrooted tillers from 5 acid bog and 5 lime-stone quarry ecotypes were transplanted onto acid bog and limestone soils, in a fully reciprocal transplantation design. Replication was at genotype level, allowing repre-sentation of natural population variation. These
soil-grown plants were kept under the same growth chamber conditions as for tiller generation. Treatment coding is as follows: lowercase “a” is for plant ecotype collected from acid bog soil, and “l” from limestone soil. Upper-case“A” indicates acid bog peat as the growth medium, and “L” for limestone soil medium. Plants were har-vested after 7 weeks, roots and shoots separated, rinsed in deionized water, frozen in liquid nitrogen and stored at−80 °C.
Physiochemical analysis of the soils and plants
Soils were oven dried (70 °C) and milled. Milled soil was compacted into 32-mm cylindrical disks of ≥6 mm width and processed using a Rigaku NEXCG energy dis-persive X-ray fluorescence spectrometer (Rigaku, Japan), in the presence of helium, to ascertain elemental con-tent. Inductively coupled plasma-mass spectroscopy (ICP-MS analysis), using an iCAP Qc ICP-MS (Thermo-Fisher Scientific, USA), was used to compliment XRF analysis, as XRF better quantifies macro-elements and ICP-MS micro-elements. For ICP-MS, dried and milled soils were treated with two acid mixes: 5 ml of 69% ni-tric acid or 3 ml 69% nini-tric acid plus 2 ml 37% hydro-chloric acid, both acids of Aristar grade. Samples were digested in a Mars6 240/250 microwave (CEM Corpor-ation, USA) at 200 °C for 30 min after a one-stage 15 min heating ramp to 165 °C. Element recovery was compared to a soil certified reference material (CRM), NCS ZC73007 and ISE921, (LGC Standards), and the best quantification method for each element, according to CRM recovery, was reported. ICP-MS was also con-ducted on soil-grown shoot material. Shoots were freeze-dried, milled and digested in a nitric acid and per-oxide solution as detailed in Signes-Pastor et al. [42]. Organic matter content was measured via loss of igni-tion (LoI), quantifying weight loss on controlled burning of soils placed in a porcelain crucible and treated to 24 h to a temperature of 400 °C overnight in a muffle furnace. pH was determined from soil slurries produced from milled soil and distilled water using a pH probe. Statis-tical analyses using GLMs were conducted in Minitab13 (Minitab, USA). Where normality tests on residuals indi-cated non-normality, data was log2transformed.
Microscopy-based assessment of root fungal colonization
and mounted in lactoglycerol. The presence and percent colonization of AM and non-AM fungi was assessed based on 100 intersections per plant using the magnified intersection method [43] with an Olympus (Tokyo, Japan) BX43F microscope. Colonization levels were sta-tistically analysed in Minitab using ranked data due to non-normality, employing GLMs and two-samplettests and plotted using SigmaPlot (SigmaPlot, USA).
RNA extraction and sequencing
Soil-grown shoots were homogenized to a fine powder under liquid nitrogen and Lysing Matrix D (MP Biomed-icals, USA) using two 20-s runs on a Precellys 24-Dual beadbeater (Bertin Technologies, France). Soil-grown roots were pre-ground using 1.5-ml microcentrifuge pes-tles (Sigma-Aldrich, USA) and ≤106-μm acid washed glass beads (Sigma-Aldrich) before homogenization using Lysing Matrix A (MP Biomedicals) with the same bead-beater conditions as shoots. RNA was extracted using the RNeasy Plant Mini Kit (QIAGEN, Germany) incorporating on-column DNase treatment (RNase-free DNase Set, QIAGEN) following the standard protocol with the following amendments: 450μl Buffer RLT (con-taining 4.5 μl β-Mercaptoethanol) was added to the powdered plant material and processed for 5 s at 5500 rpm in the bead-beater. The lysate was transferred to a QIAshredder spin column and centrifuged for 2 min at 14000 rpm. RNA was double-eluted using the same eluate and stored at−80 °C.
RNA quality was ascertained using a Nanodrop 8000 spectrophotometer (ThermoFisher Scientific) and an Agilent 2200 Tape Station (Agilent Technologies, USA). Four samples failed quality checks and were not sequenced. Barcoded 125 bp paired-end libraries (Illu-mina TruSeq, polyA selected to enrich for eukaryotic mRNA and remove rRNA) were generated and se-quenced at the Earlham Institute (UK) on an Illumina HiSeq 2500. Samples were sequenced across four lanes (36 samples from the soil transplant experiment plus 3 additional samples; see Additional file1). The RNA-Seq data (fastq files) is publicly available in ArrayExpress under accession E-MTAB-4014 at https://www.ebi.a c.uk/arrayexpress/E-MTAB-4014.
Quality control of sequencing reads
Fastq files were quality checked using Fastqc [44] and Illumina adapters removed with seqtk [45]. Reads were trimmed to remove the first 14 bases, those with Phred quality < 20 from the end of reads, all reads containing any N bases and those with < 100 bases post-trimming using Fastq-mcf [46]. Where a read was discarded, its pair was also discarded.
Meta-transcriptome assembly, annotation and alignment
Trinity v2.0.6 [47] was used to produce multiple tran-scriptome assemblies using trimmed paired reads and default settings. Additional plants were added to the transcriptome assembly to increase meta-transcriptome coverage (see Additional file 1). Assembled sequences were sequentially annotated via basic local alignment search tool (BLASTx) [48] using a range of databases and an e value cutoff of e−08. The following databases were downloaded from NCBI reference sequences (RefSeq) [49]: plant-refseq release 71 [50], protozoa-refseq release 71 [51] and fungal-protozoa-refseq release 72 [52]. Brachypodium distachyon and Arabidopsis thaliana da-tabases were downloaded from AgriGO [53]. The follow-ing protein databases, includfollow-ing KOG (EuKaryotic Orthologous Group) annotation files for functional
annotation, were downloaded from JGI [54, 55]:
Arabidopsis lyrata [56], Rhizophagus irregularis [57], Marssonina brunnea [58], Colletotrichum graminicola [59], Agaricus bisporus [60] and Phytophthora soyae [61]. All assembled transcripts were initially BLASTed against plant-refseq, protozoa-refseq, fungi-refseq and the Rhizophagus irregularisprotein database, and anno-tated transcripts were merged with a previously pub-lished H. lanatus 454 transcriptome assembly [38]. Duplicated annotations were removed based on reten-tion of the transcript with the best BLAST score for each primary accession ID. Transcripts were assigned as plant or non-plant based on best BLAST score. Plant-assigned transcripts were further filtered to remove those with plant-refseq gene identity and sequence coverage ≤70%. Microbial-assigned transcripts were further filtered to remove those with best microbial annotation gene iden-tity≤70% and sequence coverage≤90%. This resulted in a final annotated reference transcriptome containing plant and microbially assigned transcripts. The best mi-crobial annotation was used to obtain kingdom, phylum and species level information for each microbially assigned transcript. BLASTx against various genome protein databases from the JGI (see above), using an e value cutoff of e−08, was subsequently performed, and the most relevant KOG [62] functional annotations for each plant and microbial transcript recorded. Retained
plant-assigned transcripts were BLASTed against
AgriGOB.distachyonand A.thaliana protein databases to provide identifiers for Gene Ontology (GO)-based en-richment analysis.
all 36 samples using edgeR [64] to retain only those transcripts with ≥5 counts in at least 3 out of the 36 samples. Remaining expressed microbial transcripts were further BLASTed against the NCBI non-redundant (nr) protein database [65], using an e value cutoff of e−08, for a further iteration of taxonomic annotation of micro-bial transcripts based on best BLAST score. Thus, the final taxonomic annotation for all expressed transcripts was taken from the best hit from a combined BLASTx result (NCBI plant-refseq, NCBI protozoa-refseq, NCBI fungi-refseq, JGIRhizophagus irregularisand NCBI nr).
Statistical and functional analyses
Differential expression analysis of pair-wise comparisons using the 36 soil-grown samples was conducted using DESeq2 to detect differential expression based on soil type and plant ecotype effects [66]. Separate analysis pipelines were used for identification of differentially expressed plant and microbial transcripts. For differen-tial expression of plant transcripts, one root sample was removed as it showed much lower than average counts for plant-assigned transcripts, and DESeq2 analysis was repeated with 35 samples. Following DESeq2 analysis of plant transcripts, a count of 5 was added to DESeq2 baseMeans for each pair-wise comparison and log2fold changes (log2FCs) were recalculated to aid removal of significant FC calls from expressed transcripts with low counts. Transcripts were considered significantly differ-entially expressed if false discovery rate (FDR) < 0.05 and recalculated absolute log2FC≤ −1 or≥1. Significant up-regulated and downup-regulated gene lists were submitted to DAVID using default settings [67] for gene enrich-ment analysis based on A. thaliana database annota-tions, to investigate functions and processes involved in
the response of H. lanatus to extreme soil pH
(Additional files2, 3, 4,5,6, 7,8 and 9). GO [68] terms outputted from DAVID with a Benjamini-corrected p value≤0.01 were submitted to REViGO [69] to remove redundant GO terms using default settings. Hierarchical cluster heatmaps were generated using DESeq2 [66] and gplots [70]. A Venn diagram for root and shoot signifi-cant genelists was generated using venny [71].
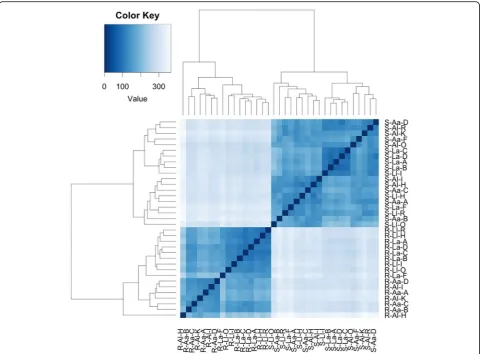
Microbial transcripts showed lower expression levels compared to plant-assigned transcripts, but all sam-ples showed similar numbers of mapped microbial-annotated reads. Therefore, all 36 samples were retained for DESeq2 [66] analysis to determine differ-ential gene expression for microbial-annotated tran-scripts. A clustering heatmap for microbial transcripts was generated in R (hclust and heatmap2). DESeq2 analysis was conducted with addition of 5 to all raw counts to aid estimation of significant log2FCs within the generally low count microbial transcriptome data. Microbial transcripts were considered significantly
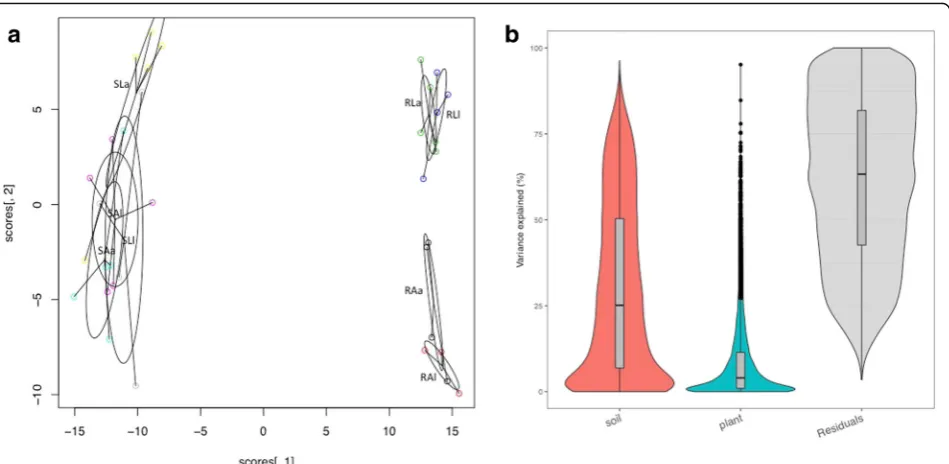
differentially expressed if FDR < 0.05, absolute log2FC≤ −1 or ≥1, and the number of mapped reads crossed a significant expression threshold. This was set as ≥5 mapped reads in at least 3 samples across each of the following 4 treatment types: (a) roots grown on acid bog soil (RA, 8 samples), (b) roots grown on limestone soil (RL, 9 samples), (c) shoots grown in acid bog soil (SA, 10 samples) and (d) shoots grown in limestone soil (SL, 9 samples) to aid identification of treatment effects. This enabled tran-scripts that passed these thresholds to be deemed as significantly expressed in the RA, RL, SA, SL tran-scriptome profiles, and was incorporated in response to low microbial read counts. Tables, piecharts and a Venn diagram [71] were subsequently generated to compare the number of significantly expressed tran-scripts in these four treatment groups. Within each of the four treatment groups (RA, RL, SA, SL), the number of microbial transcripts showing a significant ecotype effect was recorded for various taxonomic designations. Principal component analysis was per-formed in R with vegan [72] on expressed root and shoot transcripts of plants and the eukaryotic micro-biome. Variance partition analysis was performed in R with variancePartition [73] on root expressed tran-scripts of plant, the eukaryotic microbiome and Phialocephala.
Quantitative real-time PCR (qPCR)
Results
Physiochemical analysis of the soils
LoI showed theAsoil to be primarily organic (LoI 97.2%) andLsoil minerogenic (LoI 5.8%) (Additional file2). The Lsoil, primarily composed of decomposed substrate, is a clay marl. The organic versus minerogenic nature of these soils is illustrated by their mineral content, where the con-tent of every mineral element was much higher in the mineral versus organic soil, including typical soil markers such as titanium and aluminum (Additional file2).
Shoot elemental content
There was greater accumulation of As, Cu, K and Rb, and lower Ni, ina than inl(Table 1). Furthermore, ac-cumulation of K and Rb was greater inathanl in both soils, but this was more marked on A, as indicated by significant soil and ecotype interaction effects. Accumu-lation of P, Mg, As and Rb was significantly greater in plants grown onA, compared toL.
Meta-transcriptome assembly
The sequential transcriptome assembly and annotation resulted in 108,335 transcripts, of which 31,098 were annotated as plant and 77,237 as non-plant, to which each sample from the reciprocal transplant experiment aligned. After read alignment and filtering to remove lowly expressed genes, 34,906 transcripts remained, of which 22,487 were assigned as plant and 12,419 as non-plant. Retained non-plant transcripts were re-annotated based on the best score against nr or fungal/protist databases, resulting in 7716 assigned as fungi, 1141 as protist (Oomycetes) and 2254 as protist (other), while
251 transcripts were re-assigned as nematodes
(Additional file 11). Nematode transcripts and those not assigned (1057) to any of these groups were re-moved from further analyses. For assigned transcripts, KOG annotations were obtained for 16,739 plant, 6813 fungal, 1073 protist (Oomycete) and 2107 protist (other) annotated transcripts (Additional file3).
Plant gene expression and functional analysis
The hierarchical cluster heatmap (Fig.1) and PCoA plot (Fig. 2a) of plant-assigned gene expression showed clear separation of root and shoot samples, with soil type sep-aration evident within root samples, but not in shoots. For shoots and roots, 4 of 5 a grown on L clustered together, indicating a strong consistency of gene expres-sion (Fig. 1). Soil effect (L, A) in roots accounted for ~ 25% of gene expression variation, while the plant ecotype effect (l,a) accounted for ~ 4% (Fig.2b).
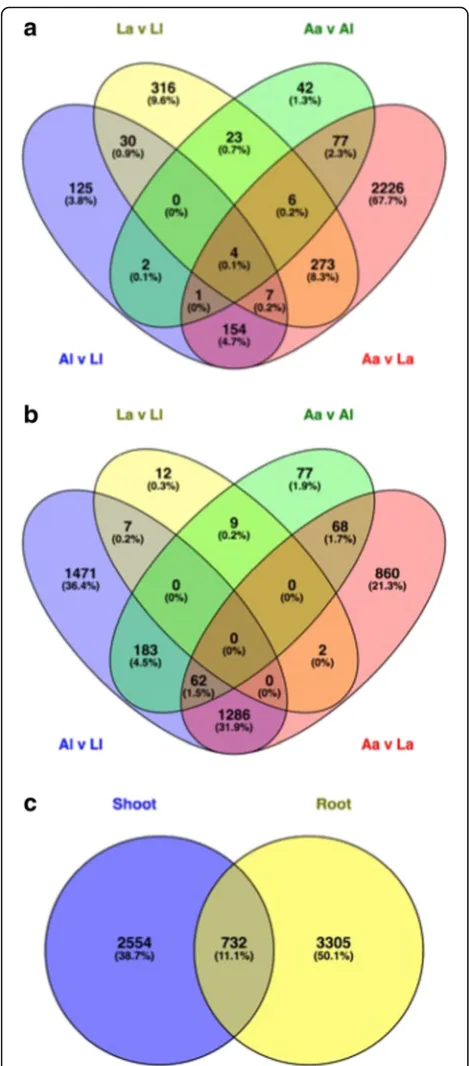
Of the 22,487 plant-assigned genes, 6591 were differ-entially expressed in at least one pairwise comparison, with fewer differentially expressed genes (DEGs) found in shoots (3286 DEGs) (Fig. 3a) than in roots (4037 DEGs) (Fig.3b), with overlap of 732 DEGs (Fig.3c). The effect of soil type on differential gene expression was consistently greater than that of plant ecotype, for both shoots (Fig. 3a) and roots (Fig. 3b); a total of 2905 soil effect vs. 781 ecotype effect DEGs were identified in shoots and 3939 soil effect vs. 420 ecotype effect DEGs in roots (Fig. 3). This trend was also reflected in the enriched GO terms obtained for each pairwise compari-son in roots and shoots (Additional files4and5).
There were marked differences in soil type response betweenaandlecotypes. In shoots,a showed a greater response to soil type thanl(2748 vs. 323 DEGs) (Fig.3a). The opposite was true in roots, wherelshowed a greater response to soil type compared to a (3009 vs. 2278 DEGs) (Fig. 3b). There were many overlapping soil re-sponses for a and l for roots (1348 DEGs), indicating common root responses to soil type in both ecotypes (Fig. 3b); this was less pronounced in shoots where only 166 DEGs overlapped betweenaandl(Fig.3a).
The shoot soil type response forainvolved GO terms cell wall and responses to stressors including salt, cad-mium, toxic substances, bacteria and wounding (Tables2 and 3, Additional files 4and 5). A number of stress re-sponse and transport-associated genes were identified as upregulated inashoots onA, compared toL, including cation-H+ antiporter 19, K transporter 16, K transporter 1 and nitrate transporter 1.5, with reported function in
Table 1Shoot mineral contents of reciprocally transplantedH.lanatusshoots as obtained using ICP-MS
pvalue Mean content (ppm) Standard error (ppm)
Element Soil effect Ecotype effect Interaction Aa Al La Ll Aa Al La Ll
Arsenic < 0.001 < 0.01 N.S. 1.9 0.76 0.37 0.09 0.63 0.16 0.13 0.013
Copper N.S. < 0.01 N.S. 12 9 11 9 0.35 0.76 1.2 0.98
Potassium N.S. < 0.01 < 0.05 64,000 17,000 49,000 40,000 7900 11,000 4000 10,000
Magnesium < 0.05 N.S. N.S. 3200 2800 2700 2200 290 240 210 7.3
Nickel 0.137 < 0.05 N.S. 2.1 4.4 3.6 6.1 0.56 1.2 0.74 1.3
Phosphorus < 0.05 N.S. N.S. 7400 6600 2900 5000 1400 760 330 1200
Rubidium < 0.001 < 0.01 < 0.01 42 24 13 12 0.82 3.4 2.1 0.98
NO3−dependent K translocation (Additional file 6, refer-ences in Additional file 7). Genes GO-annotated as involved in stress response included cinnamate beta-D-glucosyltransferase, involved in phytochelatin production and conversion of xenobiotic substances, and cadmium/ zinc-transporting ATPase HMA1, involved in cation transport, particularly of Cu (Additional file6). Also up-regulated were genes involved in pathogen defense, in-cluding plasma membrane leucine-rich repeat receptor kinase 2 (PEPR2), involved in detecting fungal effectors to initiate plant defenses (Additional file 6). Shoots of a onAcompared toLalso upregulated a transcript anno-tated as hydroxycinnamoyl-coenzyme A shikimate, re-ported to affect lignin composition (Additional file 6). Furthermore, oxophytodienoate reductase 1 and 12-oxophytodienoate reductase 7, genes reported to be in-volved in jasmonic acid (JA) biosynthesis, were upregu-lated in a shoots on A, compared to L (Additional file 6), with (hemi)biotrophic fungi known to manipulate JA
to enable colonization. Response of l shoots to soil was more limited, with fewer DEGs and enriched GO terms. Response to wounding stress was upregulated in A soil, and membrane-associated genes were enriched inL soil (Tables2and3).
Soil type responses identified inlroots included signal transduction, transport, response to stimulus and stress, phosphate starvation and acquisition, lignin production and biosynthesis and oxidation-reduction amongst others (Tables2and3, Additional files4and5). A num-ber of genes involved in lignin biosynthesis and compos-ition, such as laccases 5 and 11 and cinnamyl alcohol dehydrogenase, were upregulated inlroots onL, relative toA(Additional file6). Transport genes upregulated inl on L, compared to A, were involved in nutrient uptake and transport, particularly for N and P. These included a range of transporters that facilitate uptake of N under low N conditions, such as nitrate transporters 1.1 and 1.5, and high-affinity nitrate transporters 2.1, 2.4, 3.1
and 3.2 (Additional file 6). Nitrate transporter 1.1 is a dual-affinity nitrate transporter thought to be involved in multiple phases of nitrate uptake. With regards to P-assimilation, genes upregulated in l roots on L, com-pared to A, included purple acid phosphatases, which hydrolyse phosphomonoesters to release P and are im-plicated in phosphate use efficiency, as well as high-affinity K transporters, including K transporters PT1-11 and PT1-13, known to be important for AM symbiosis (Additional file6). Also upregulated inlonLwere genes involved in Fe uptake, including phytosiderophore-chelated Fe. The latter included iron-phytosiderophore transporter YSL15 (Additional file6). A number of genes involved in amelioration of oxidative stress were upregu-lated inlonLcompared toA, including numerous class III plant peroxidases, including peroxidases 1 and 70 (Additional file 6). The former is reported as a central component in the reactive oxygen gene network re-sponse, facilitating amelioration of oxidative stress, with the latter regulated by plant hormones JA and salicylic acid (SAc) in response to pathogen elicitors. Other pathogen defense genes were also upregulated inlonL, compared to A, including isoflavone reductase and pre-mnaspirodiene oxygenase (Additional file 6). With re-spect to K transport and homeostasis, K channel AKT2 and cation/H(+
) antiporter 15 were upregulated in l roots on L, while K transporter 18 and cation trans-porter HKT8 were upregulated on A(Additional file 6).
Far fewer genes were upregulated inlonAcompared to L, but those that were included some catalases and class III plant peroxidases, including peroxidase 70, plus the
aforementioned genes involved in K homeostasis
(Additional file6).
The soil type responses identified in a roots were broadly similar to those observed in l and included transport, response to stimulus and stress, phosphate starvation and acquisition, lignin production and biosyn-thesis and oxidation-reduction amongst others (Tables2 and 3, Additional files 4 and 5). As in l, lignin biosynthesis-related genes were upregulated in a on L compared toA, suggesting a role of lignification in theL environment in both aand l. As observed in l, P, N, Fe uptake and within-plant transport genes were upregu-lated in aon L relative to A, including upregulation of the same nitrate transporters as in l, excepting nitrate transporter 1.1, and with the addition of nitrate trans-porter 1.2 and high-affinity nitrate transtrans-porter 2.5, which plays a role in acquisition and remobilization in nitrogen-starved plants (Additional file6). As inl, there was upregulation of genes involved in uptake of phytosiderophore-chelated Fe on L compared to A, in-cluding iron-phytosiderophore transporter YSL15 with the addition of metal-nicotianamine transporter YSL12 (Additional file 6). In both ecotypes, P transport genes were upregulated on L compared to A, including P transporters PT1-11 and PT1-13, with the addition of
Fig. 2aPCoA analysis plot of shoot and rootH.lanatusplant transcriptome data generated using the vegan package in R. SAa shoot acid bog soil, acid plant; SAl shoot acid bog soil, limestone plant; SLa shoot limestone soil, acid plant; SLl shoot limestone soil, limestone plant. RAa root acid bog soil, acid plant; RAl root acid bog soil, limestone plant; RLa root limestone soil, acid plant; RLl root limestone soil, limestone plant.
PT1-10 and a high-affinity K transporter in a roots (Additional file 6). PT1-10, PT1-11 and PT1-13 are thought to be involved in the establishment of mycorrhizal symbiosis and induced during AM colonization, with PT1-11 implicated in P acquisition via the AM symbiosis. Thus, lignification and increased investment in P, N and Fe nutrient acquisition appear to be a response to L in both H. lanatus ecotypes, which is reiterated by enrich-ment of GO terms related to these processes in roots of ecotypes in response to soil type (Table2).
Other enriched GO terms shared by both roots of both ecotypes in response to soil type related to mem-brane, cell wall and oxidation-reduction (Table3). As for l, a roots were enriched in pathogen defense-related genes such as isoflavone reductase and premnaspiro-diene oxygenase, with the addition of basic
endochiti-nase A on L compared to A (Additional file 6).
Regarding genes involved in oxidation-reduction and amelioration of oxidative stress, both a andl roots up-regulated a number of class III plant peroxidases in L compared to A (Additional file 6), with production of antioxidant compounds also implicated in a. With re-spect to K transport and homeostasis genes, bothaand lupregulated K channel AKT2 and cation/H+ antiporter 15 in L, and upregulated K transporter 18 and cation transporter HKT8 in A. Additionally,aalso upregulated
K transporter 5 in L and K channel KOR2 in A
(Additional file 6). As in a shoots, PEPR2, a gene involved in detecting fungal effectors to initiate plant defenses was upregulated in a roots in A, compared to L. PEPR2 was not upregulated byl shoots or roots inA (Additional file6).
Although soil type was the overriding effect, there was also an effect of plant ecotype on differential gene ex-pression. This was greater onLthan onAin shoots (659 vs. 155 DEGs), in contrast to roots, where ecotype effect was greater on A, compared to L (399 vs. 30 DEGs) (Fig. 3). The REViGO enrichment analysis correspond-ingly showed a larger number of summarized enriched
GO terms for ecotype effect on L-grown shoots
compared toA-grown shoots, and in Acompared toL -grown roots (Table3, Additional file5).
Differences in gene expression responses between a and lshoots on Linvolved membrane, defense response and response to toxins amongst others (Tables 2 and3, Additional files 4 and 5). Stimulus and stress response-related genes upregulated on Linlshoots, as compared to a, included glutathione S-transferases, a large family with many members involved in detoxification and amelioration of oxidative stress, and pathogen defense genes such as disease resistance protein RPS2 and coronatine-insensitive protein 1, the latter known to be associated with pathogen defense and JA response (Additional file 6). Shoots of l on L also upregulated
Fig. 3Venn diagram of significantly differentially expressedHolcus lanatusplant-annotated transcripts. Significance determined as FDR≤0.05, recalculated absolute log2FC≥1 or≤ −1, BLAST report ≥70% identity and≥70% coverage.aPlant transcripts in shoot.
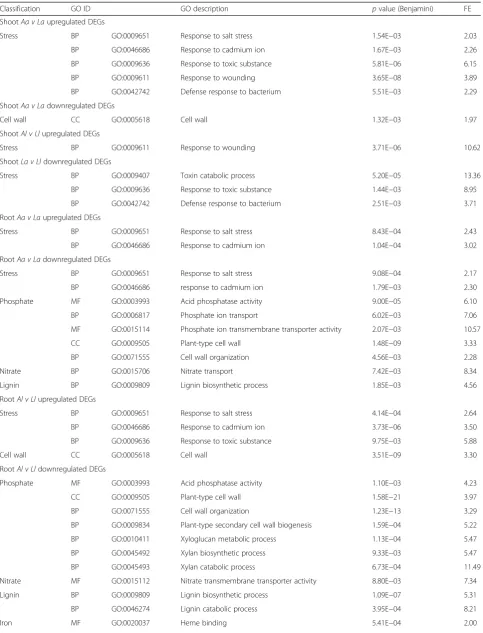
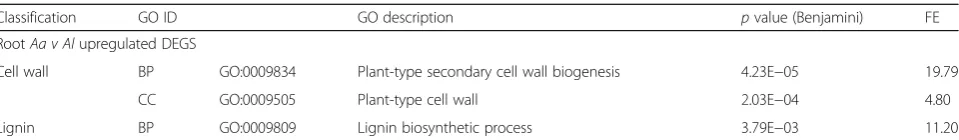
Table 2Selected significantly enriched plant-assigned GO terms obtained from DAVID, for various shoot and root pairwise comparisons
Classification GO ID GO description pvalue (Benjamini) FE
ShootAa v Laupregulated DEGs
Stress BP GO:0009651 Response to salt stress 1.54E−03 2.03
BP GO:0046686 Response to cadmium ion 1.67E−03 2.26
BP GO:0009636 Response to toxic substance 5.81E−06 6.15
BP GO:0009611 Response to wounding 3.65E−08 3.89
BP GO:0042742 Defense response to bacterium 5.51E−03 2.29
ShootAa v Ladownregulated DEGs
Cell wall CC GO:0005618 Cell wall 1.32E−03 1.97
ShootAl v Llupregulated DEGs
Stress BP GO:0009611 Response to wounding 3.71E−06 10.62
ShootLa v Lldownregulated DEGs
Stress BP GO:0009407 Toxin catabolic process 5.20E−05 13.36
BP GO:0009636 Response to toxic substance 1.44E−03 8.95
BP GO:0042742 Defense response to bacterium 2.51E−03 3.71
RootAa v Laupregulated DEGs
Stress BP GO:0009651 Response to salt stress 8.43E−04 2.43
BP GO:0046686 Response to cadmium ion 1.04E−04 3.02
RootAa v Ladownregulated DEGs
Stress BP GO:0009651 Response to salt stress 9.08E−04 2.17
BP GO:0046686 response to cadmium ion 1.79E−03 2.30
Phosphate MF GO:0003993 Acid phosphatase activity 9.00E−05 6.10
BP GO:0006817 Phosphate ion transport 6.02E−03 7.06
MF GO:0015114 Phosphate ion transmembrane transporter activity 2.07E−03 10.57
CC GO:0009505 Plant-type cell wall 1.48E−09 3.33
BP GO:0071555 Cell wall organization 4.56E−03 2.28
Nitrate BP GO:0015706 Nitrate transport 7.42E−03 8.34
Lignin BP GO:0009809 Lignin biosynthetic process 1.85E−03 4.56
RootAl v Llupregulated DEGs
Stress BP GO:0009651 Response to salt stress 4.14E−04 2.64
BP GO:0046686 Response to cadmium ion 3.73E−06 3.50
BP GO:0009636 Response to toxic substance 9.75E−03 5.88
Cell wall CC GO:0005618 Cell wall 3.51E−09 3.30
RootAl v Lldownregulated DEGs
Phosphate MF GO:0003993 Acid phosphatase activity 1.10E−03 4.23
CC GO:0009505 Plant-type cell wall 1.58E−21 3.97
BP GO:0071555 Cell wall organization 1.23E−13 3.29
BP GO:0009834 Plant-type secondary cell wall biogenesis 1.59E−04 5.22
BP GO:0010411 Xyloglucan metabolic process 1.13E−04 5.47
BP GO:0045492 Xylan biosynthetic process 9.33E−03 5.47
BP GO:0045493 Xylan catabolic process 6.73E−04 11.49
Nitrate MF GO:0015112 Nitrate transmembrane transporter activity 8.80E−03 7.34
Lignin BP GO:0009809 Lignin biosynthetic process 1.09E−07 5.31
BP GO:0046274 Lignin catabolic process 3.95E−04 8.21
genes involved in K-uptake and homeostasis and Na+ ac-cumulation, in comparison toa, in particular, cation-H+ antiporter 19, K transporter 16 and K transporter 1 (Additional file 6). Cation-H+ antiporter 19 is reported to be associated with K homeostasis in response to alka-line conditions, and other K transporters are reported to be involved in salt stress tolerance. In contrast, K chan-nel KOR2, known to be involved in K+ release into xylem sap, was upregulated in a compared to l shoots on L (Additional file 6). Overall, the ecotype effect in shoots on A was less pronounced than on L (Fig. 3a), and was restricted to membrane, signal transduction and port-translational modification-associated genes (Table3, Additional files4and5).
For roots, significant ecotype responses onA involved the cell wall, lignin biosynthesis and oxidation-reduction related genes amongst others (Tables2and3, Additional files 4 and 5). Lignin biosynthesis and composition genes, such as cinnamyl alcohol dehydrogenase, laccase 4, laccase 5 and laccase 11, were upregulated ina, rela-tive to l, suggesting lignin usage in a is related to stressors associated with A soil, which l does not repli-cate when grown onA(Additional file6). Roots ofa dis-played greater expression of a range of class III plant peroxidases compared tolroots inA, including peroxid-ase 1, central to amelioration of oxidative stress, and peroxidase 70, regulated by JA and SAc, and in response to pathogen elicitors (Additional file 6). Furthermore, a roots had higher expression of K channel AKT2 com-pared to l roots when grown on A (Additional file 6). This gene is known to be involved in phloem loading and unloading of K+
. In contrast toA, the ecotype effect in roots on L was much less pronounced (Fig. 3b), in-volving only 30 genes with no enriched GO terms (Table3, Additional file4).
Full DESeq2 results and database annotations for plant annotated transcripts are shown in Additional file 8 with corresponding sequences in fasta format in Additional file 9.
RNA-Seq gene expression verification using qPCR
The reliability of the RNA-Seq data and differential ex-pression calls was investigated using qPCR, with genes
chosen to cover a range of gene expression patterns between treatments. The qPCR results verified the RNA-Seq data well, with regressions of qPCR mean treatment log2FC against the mean recalculated RNA-Seq counterparts showing anR2of 98.2%. Furthermore, where the RNA-Seq indicated a significant difference in gene expression levels between two treatments (FDR < 0.05 and recalculated log2FC≤ −1 or ≥1), the qPCR results corroborated this (p< 0.05, log2FC≤ −1 or≥1) (Additional file 10). Primers used for qPCR are shown in Additional file10.
Microbial gene expression and functional analysis
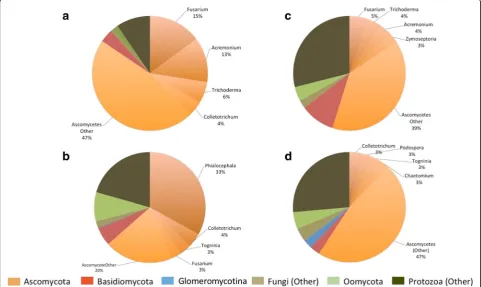
Transcripts best annotated as eukaryotic microbes were successfully assembled and functionally annotated (Additional file 3). Fungal and protist transcripts corre-sponding to all four KOG groups (cellular process and signalling, information storage and processing, metabol-ism, poorly characterized) were obtained, with the fungal transcriptome dominated by Ascomycetes and the protist transcriptome by Oomycete-annotated genes (Additional files3and12).
Fungal and protist transcripts were detected as signifi-cantly expressed in roots and shoots ofH.lanatusgrown on both A and L (Table 4, Fig. 4). Transcripts demon-strated a root vs. shoot effect on gene expression, as well as strong soil effects on gene expression in roots, with some evidence of a soil effect also identifiable in shoots (Figs. 5 and 6a, b). More transcripts were detected in roots than shoots, and in both, more were detected in plants grown on A than L (Table 4, Fig.6a). Soil is ac-counting for more variation in root microbiome gene expression than plant ecotype, but plant ecotype also ex-plains some of the variation (Fig.7a).
Fungal-annotated transcripts were more prevalent than protist-annotated transcripts in roots and shoots on both soils, with most detected fungal transcripts best annotated as non-AM fungi and mostly assigned to the Ascomycota (Table4, Fig.4). Furthermore, greater num-bers of Ascomycete-annotated genes were significantly expressed in roots than shoots, but in both, more were
detected in plants grown on A than L (Table 4).
Ascomycota-annotated genes significantly expressed in
Table 2Selected significantly enriched plant-assigned GO terms obtained from DAVID, for various shoot and root pairwise comparisons
(Continued)
Classification GO ID GO description pvalue (Benjamini) FE
RootAa v Alupregulated DEGS
Cell wall BP GO:0009834 Plant-type secondary cell wall biogenesis 4.23E−05 19.79
CC GO:0009505 Plant-type cell wall 2.03E−04 4.80
Lignin BP GO:0009809 Lignin biosynthetic process 3.79E−03 11.20
roots grown on A were dominated by the genus Phialocephala, with many of these showing upregulation ina, compared to l roots (Table4, Fig. 4b). In contrast, there was no single dominant Ascomycete genus signifi-cantly expressed in roots or shoots on L, although Colletotrichum-annotated transcripts were most numer-ous in roots and Fusarium-annotated transcripts in shoots (Table 4, Fig. 4). These genera, plus others
including Acremonium and Trichoderma showed higher expression levels in roots of l compared to a, in both soils, particularlyL(Table4).
While most non-AM-assembled transcripts were an-notated as Ascomycota, transcripts identified as other fungal phyla including Basidiomycota, Chytridiomycota, Cryptomycota and Zygomycota were identified, with greater prevalence in roots compared to shoots (Table4,
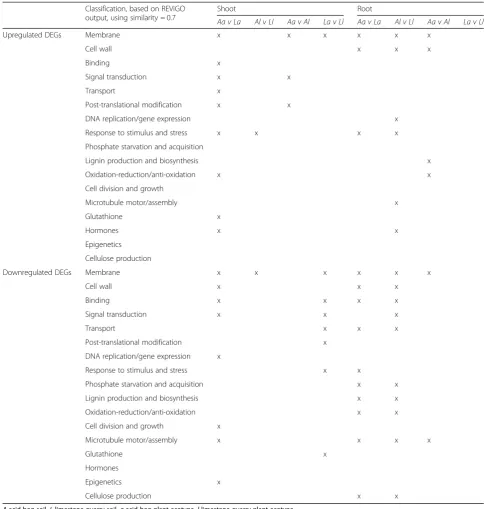
Table 3Summarized overview of enriched GO terms based on complete REViGO simplification results, following DAVID GO analysis, for all shoot and root pairwise comparisons
Classification, based on REViGO output, using similarity = 0.7
Shoot Root
Aa v La Al v Ll Aa v Al La v Ll Aa v La Al v Ll Aa v Al La v Ll
Upregulated DEGs Membrane x x x x x x
Cell wall x x x
Binding x
Signal transduction x x
Transport x
Post-translational modification x x
DNA replication/gene expression x
Response to stimulus and stress x x x x
Phosphate starvation and acquisition
Lignin production and biosynthesis x
Oxidation-reduction/anti-oxidation x x
Cell division and growth
Microtubule motor/assembly x
Glutathione x
Hormones x x
Epigenetics
Cellulose production
Downregulated DEGs Membrane x x x x x x
Cell wall x x x
Binding x x x x
Signal transduction x x x
Transport x x x
Post-translational modification x
DNA replication/gene expression x
Response to stimulus and stress x x
Phosphate starvation and acquisition x x
Lignin production and biosynthesis x x
Oxidation-reduction/anti-oxidation x x
Cell division and growth x
Microtubule motor/assembly x x x x
Glutathione x
Hormones
Epigenetics x
Cellulose production x x
Table 4The number of significantly expressed microbial transcripts in root and shoot for each soil
SAexpressed at≥5 reads in 3 out of 10 samples
SLexpressed at≥5 reads in 3 out of 9 samples
RAexpressed at≥5 reads in 3 out of 8 samples
RLexpressed at≥5 reads in 3 out of 9 samples
All Plant effect All Plant effect All Plant effect All Plant effect
Up ina up inl Up ina Up inl Up ina Up inl Up ina Up inl
Protists (Oomycetes) 7 0 0 7 0 0 490 8 365 239 0 12
Protists (other) 49 0 0 50 0 0 1183 68 443 1254 19 80
Ascomycetes 437 0 0 95 2 4 3646 421 166 2804 20 1139
Basidiomycetes 19 0 0 17 0 0 309 8 62 139 1 6
Glomeromycotina 1 0 0 1 0 0 12 1 2 122 0 1
Fungi (other) 4 0 0 3 0 0 108 5 31 188 0 10
Ascomycota (selected)
Phialocephala 3 0 0 0 0 0 1886 289 3 21 0 4
Colletotrichum 22 0 0 2 0 0 63 2 8 166 2 65
Fusarium 76 0 0 9 0 3 105 1 24 104 0 25
Acremonium 66 0 0 6 0 0 47 1 10 39 0 11
Trichoderma 31 0 0 7 0 0 58 5 8 66 0 22
The number of significantly expressed microbial transcripts (All) is defined as the number of transcripts that obtained≥5 aligned reads in at least three samples from each of the following treatments: root acid bog soil (RA), root lime-stone soil (RL), shoot acid bog soil (SA) and shoot lime-stone soil (SL). Significant ecotype effects (absolute log2FC≤ −1 or≥1, FDR < 0.05) as identified by DESeq2 analysis are reported in subsequent columns for each treatment group under the heading plant effect
Fig.4, Additional file12). Basidiomycetes showed greater activity from A-grown roots thanL, and withinA, more Basidiomycete-annotated transcripts were upregulated in l roots than a (Table 4). Basidiomycete-annotated tran-scripts upregulated inl roots compared to aroots in A soil were predominantly annotated as KOG translation and energy production (Additional file13).
Most Ascomycota transcripts significantly expressed at a level of≥5 counts in≥3 samples in roots fromAwere KOG annotated as involved in metabolism, including en-ergy production and conversion and transport and me-tabolism of carbohydrates, amino acids and lipids (Table 5). Roots from Lwere mainly KOG annotated as information storage and processing, particularly transla-tion, ribosomal structure and biogenesis. This was also the case for shoots from A and L, although transcripts KOG annotated as metabolism were also well repre-sented in shoots from A, and cellular processes and signalling in shoots from L. In all categories, fewer
Ascomycota transcripts were annotated in shoots, due to lower overall transcript detection compared to roots (Tables4and5).
Other Ascomycota-annotated KOGs of interest in-cluded intracellular trafficking, inorganic ion transport and metabolism, signal transduction mechanisms and replication and recombination and repair. Some of these are putatively involved in fungal virulence and infectiv-ity, with others likely to be involved in nutrient acquisi-tion, uptake and homeostasis, likely with functions related to stresses associated with A or L. For roots grown onA, many significantly expressed transcripts an-notated with these KOG functions and putative uses were also annotated asPhialocephala(Additional file11, references in Additional file 7). A total of 225 A-grown root Phialocephala genes were upregulated in a com-pared to l, with 24 of these KOG annotated as amino acid transport and metabolism (Table6), including argi-nase, involved in amino acid breakdown to release N
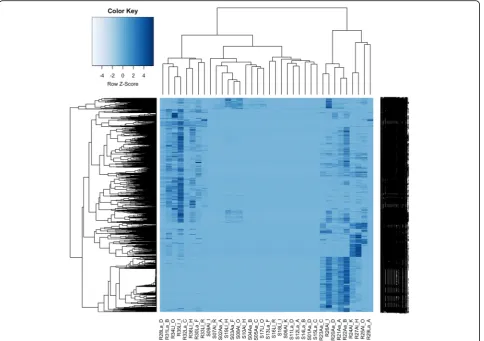
Fig. 5Heirarchical cluster heatmap of microbial-annotated transcripts, generated using microbial RNA-Seq count data, using hclust and heatmap2 in R. Transcripts are clustered by row, and samples by column. The first letter refers to plant (S shoot, R root), the second to soil type (Aacid bog soil,L
(Additional file 11). Phialocephala-annotated genes in-volved in metal(loid) homeostasis, P transport, and stress tolerance were more numerous in roots grown on A compared toL(Additional file11). Furthermore, a num-ber of these transcripts were upregulated in roots of a,
compared to l, on A, including a Zn transporter, inor-ganic P transporters, a K+/H+-antiporter and aldehyde dehydrogenases, with many of the latter upregulated in both ecotype roots when grown onAcompared toL; al-dehyde dehydrogenases are associated with energy
Fig. 6aVenn diagram of significantly expressed transcripts in root and shoot in each soil; root acid bog soil (RA), root limestone soil (RL), shoot acid bog soil (SA) and shoot limestone soil (SL). The number of significantly expressed transcripts is defined as the number of microbial-annotated transcripts that obtained≥5 aligned reads in at least 3 samples in each of the treatments RA (total 8 samples), RL (total 9 samples), SA (total 10 samples), SL (total 9 samples).bPCoA analysis plot of the shoot and root microbial data generated using the vegan package in R. SAa shoot acid bog soil, acid plant; SAl shoot acid bog soil, limestone plant; SLa shoot limestone soil, acid plant; SLl shoot limestone soil, limestone plant. RAa root acid bog soil, acid plant; RAl root acid bog soil, limestone plant; RLa root limestone soil, acid plant; RLl root limestone soil, limestone plant
production and oxidative stress tolerance. Transcripts annotated as these were also expressed by Ascomycete genera other than Phialocephala on both soils, with a significant number of transcripts in l roots showing increased expression compared to a in both soils (Additional file 11). A greater number of Ascomycota
genes involved in stress tolerance and repair were de-tected inAthanL, including those involved in oxidative stress response and DNA damage detection and repair, many of which were best annotated as Phialocephala. Fungal virulence and infectivity related genes, particu-larly casein kinases, transport protein Sec61 and
GTP-Table 5Significantly expressed KOG-annotated Ascomycota transcripts in root and shoot in each soil
SAexpressed at≥5 reads in 3 out of 10 samples
SLexpressed at ≥5 reads in 3 out of 9 samples
RAexpressed at≥5 reads in 3 out of 8 samples
RLexpressed at≥5 reads in 3 out of 9 samples
Ascomycetes All Plant effect All Plant effect All Plant effect All Plant effect
Up ina Up inl Up ina Up inl Up ina Up inl Up ina Up inl
Cellular processes and signaling 71 0 0 28 2 0 769 89 30 729 6 274
Cell motility 0 0 0 0 0 0 1 0 0 0 0 0
Cell wall/membrane/envelope biogenesis 1 0 0 0 0 0 36 2 0 45 0 21
Cytoskeleton 7 0 0 7 2 0 96 13 7 74 1 19
Defense mechanisms 2 0 0 0 0 0 13 0 0 8 0 1
Extracellular structures 4 0 0 0 0 0 5 0 0 3 0 0
Intracellular trafficking, secretion, and vesicular transport
0 0 0 2 0 0 114 15 3 77 0 28
Nuclear structure 0 0 0 0 0 0 9 1 0 7 0 4
Posttranslational modification, protein turnover, chaperones
50 0 0 17 0 0 334 30 14 355 3 128
Signal transduction mechanisms 7 0 0 2 0 0 161 28 6 160 2 73
Information storage and processing 137 0 0 35 0 0 918 51 57 785 4 348
Chromatin structure and dynamics 7 0 0 4 0 0 40 2 2 35 0 22
Replication, recombination and repair 1 0 0 0 0 0 46 1 0 1 0 0
RNA processing and modification 1 0 0 0 0 0 128 13 2 34 1 14
Transcription 3 0 0 31 0 0 90 8 2 61 0 28
Translation, ribosomal structure and biogenesis 125 0 0 0 0 0 614 27 51 654 3 284
Metabolism 134 0 0 16 0 4 1083 113 50 763 3 319
Amino acid transport and metabolism 10 0 0 0 0 0 149 26 1 97 0 45
Carbohydrate transport and metabolism 16 0 0 4 0 0 179 32 7 162 2 91
Cell cycle control, cell division, chromosome partitioning
0 0 0 0 0 0 77 3 1 42 0 17
Coenzyme transport and metabolism 1 0 0 1 0 0 38 1 2 27 0 4
Energy production and conversion 65 0 0 8 0 4 309 19 35 267 0 88
Inorganic ion transport and metabolism 13 0 0 0 0 0 66 8 0 61 0 23
Lipid transport and metabolism 11 0 0 1 0 0 125 12 0 51 0 26
Nucleotide transport and metabolism 1 0 0 0 0 0 42 2 0 20 0 9
Secondary metabolites biosynthesis, transport and catabolism
17 0 0 2 0 0 98 10 4 36 1 16
Poorly characterized 31 0 0 1 0 0 434 67 8 253 0 96
Function unknown 2 0 0 0 0 0 85 6 0 13 0 4
General function prediction only 29 0 0 1 0 0 349 61 8 240 0 92
Total KOG annotated, expressed 373 0 0 80 2 3 3204 320 145 2528 13 1037
binding ADP-ribosylation factor Arf1, were expressed in both Aand L and annotated by a range of Ascomycete genera. Many of these, particularly those annotated as Phialocephala, were more strongly expressed in A (Additional file 11). Casein kinases are known to be
essential for cell integrity and fungal virulence and Arf1 may be involved in fungal morphogenesis and virulence.
Roots grown on L showed a greater number of
Ascomycota-annotated ferric reductases, known to be involved in Fe acquisition than those on A. Of these,
Table 6Significantly expressed KOG annotatedPhialocephalatranscripts in root and shoot in each soil
SAexpressed at≥5 reads in 3 out of 10 samples
SLexpressed at≥5 reads in 3 out of 9 samples
RAexpressed at≥5 reads in 3 out of 8 samples
RLexpressed at≥5 reads in 3 out of 9 samples
Phialocephala All Plant effect All Plant effect All Plant effect All Plant effect Up ina Up inl Up ina Up inl Up ina Up inl Up ina Up inl
Cellular processes and signaling 1 0 0 0 0 0 370 61 0 6 0 2
Cell motility 0 0 0 0 0 0 1 0 0 0 0 0
Cell wall/membrane/envelope biogenesis 0 0 0 0 0 0 23 1 0 0 0 0
Cytoskeleton 0 0 0 0 0 0 37 6 0 0 0 0
Defense mechanisms 0 0 0 0 0 0 10 0 0 0 0 0
Extracellular structures 0 0 0 0 0 0 5 0 0 0 0 0
Intracellular trafficking, secretion, and vesicular transport
0 0 0 0 0 0 73 14 0 1 0 0
Nuclear structure 0 0 0 0 0 0 6 1 0 0 0 0
Posttranslational modification, protein turnover, chaperones
1 0 0 0 0 0 114 18 0 5 0 2
Signal transduction mechanisms 0 0 0 0 0 0 101 21 0 0 0 0
Information storage and processing 1 0 0 0 0 0 322 35 0 8 0 2
Chromatin structure and dynamics 0 0 0 0 0 0 18 1 0 0 0 0
Replication, recombination and repair 0 0 0 0 0 0 43 1 0 0 0 0
RNA processing and modification 0 0 0 0 0 0 86 10 0 0 0 0
Transcription 0 0 0 0 0 0 64 7 0 0 0 0
Translation, ribosomal structure and biogenesis 1 0 0 0 0 0 111 16 0 8 0 2
Metabolism 1 0 0 0 0 0 601 81 2 4 0 0
Amino acid transport and metabolism 0 0 0 0 0 0 117 24 0 1 0 0
Carbohydrate transport and metabolism 0 0 0 0 0 0 91 19 0 0 0 0
Cell cycle control, cell division, chromosome partitioning
0 0 0 0 0 0 46 2 0 0 0 0
Coenzyme transport and metabolism 0 0 0 0 0 0 25 1 0 0 0 0
Energy production and conversion 1 0 0 0 0 0 93 11 1 1 0 0
Inorganic ion transport and metabolism 0 0 0 0 0 0 38 7 0 0 0 0
Lipid transport and metabolism 0 0 0 0 0 0 85 6 0 0 0 0
Nucleotide transport and metabolism 0 0 0 0 0 0 33 2 0 1 0 0
Secondary metabolites biosynthesis, transport and catabolism
0 0 0 0 0 0 73 9 1 1 0 0
Poorly characterized 0 0 0 0 0 0 319 48 1 0 0 1
Function unknown 0 0 0 0 0 0 78 5 0 0 0 0
General function prediction only 0 0 0 0 0 0 241 43 1 0 0 1
Total KOG annotated 3 0 0 0 0 0 1612 225 3 18 0 5
eight genes, including two annotated as Colletotrichum, were upregulated in roots ofl, compared toa, onL (Add-itional file11). Ascomycete-annotated genes from a range of genera proposed to be involved in fungal K homeostasis were detected in both soils, with a Phialocephala -anno-tated K+/H+-antiporter and Na+/K+ transporter showing greater expression on A, while those upregulated in L roots were annotated with a range of other Ascomycota genera, including aColletotrichum-annotated K+/H+ -anti-porter. K+/H+-antiporters influence the plasma membrane potential of fungi, thereby increasing pH tolerance.
In roots on A, 1612 of 3204 significantly expressed genes with Ascomycete KOG annotations were anno-tated as Phialocephala, in contrast to roots on L, where only 18 of 2530 were annotated as Phialocephala (Tables5 and 6). No expression ofPhialocephala- anno-tated genes was identified in shoots on L, and only 3 Phialocephala-annotated genes were shown to be expressed in shoots on A, highlighting this organism as a root endophyte characteristic of A (Table 6). Accord-ingly, due to stronger expression onA, soil accounts for most of the Phialocephala expression variance, further to that a small proportion is explained by plant ecotype (Fig. 7b). Coupled with the greater gene expression of Phialocephala-annotated transcripts in roots ofa, com-pared to the l, when grown on A, this presents the hypothesis thatH.lanatusplants native to Ahave plant-microbiome interaction adaptations to A. This adapta-tion involves a close associaadapta-tion with an Ascomycete of the genus Phialocephala, or closely related to Phialoce-phala, perhaps with various roles in P and N acquisition, cation transport, metal(loid) tolerance and stress and pathogen resistance for this soil.
For roots on L, 166 significantly expressed genes were annotated as Colletotrichum, 65 of which were upregu-lated inl, compared to a(Table4). This compares with only 63 significantly expressed genes annotated as Colletotrichum expressed in roots on A, few of which show an ecotype-specific effect onA(Table4). Again, this could point to ecotype-specific plant-microbiome interac-tions with Colletotrichum or related organisms on L -adapted H. lanatus plants, with the interaction perhaps having a beneficial role in aiding Fe acquisition inL.
A total of 144 transcripts best annotated as Glomero-mycotina with KOG annotations were assembled and expressed (Additional file 3), with 108 of these signifi-cantly expressed in roots on L, and only 11 in A (Additional file14). Furthermore, there was little differ-ence in root Glomeromycotina expression due to plant ecotype in either soil (Table 4, Additional file 14), indi-cating greater AM fungal activity in L, compared to A roots in both ecotypes. As expected, no significant expression of Glomeromycotina-annotated genes was observed in shoots (Table4, Additional file14, Fig.4).
Of the 108 Glomeromycotina KOG-annotated tran-scripts significantly expressed in L, 43 were annotated as involved in cellular process and signalling (posttransla-tional modification, signal transduction), 22 in information storage and processing (translation), 38 in metabolism (amino acid, carbohydrate, lipid, secondary metabolite, in-organic ion transport, energy production), and 5 anno-tated as poorly characterized (Additional file 14). These included 3 ferric reductases, which may be involved in Fe acquisition (Additional file11). Of the 11 Glomeromyco-tina KOG-annotated transcripts shown to be significantly expressed on A, 4 were KOG annotated as cellular cessing and signalling, 6 as information storage and pro-cessing and 1 as metabolism (Additional file 14). Overall, the number of transcripts identified as expressed by Glomeromycotina was lower than expected, possibly due to there being only one AM fungal genome for annotation of AM fungal transcripts, making it likely that a number of AM fungal expressed transcripts, in particular those AM more distantly related to R.irregularis, were missed during the iterative annotation procedure.
Protist-annotated transcripts were assembled and KOG annotated, with 1073 of these assigned as Oomy-cete and 2107 as protists (other) (Additional file 3). Detection of transcripts best annotated as protists (other) and protists (Oomycete) was greater in roots than in shoots, with Oomycetes making up ~ 29% of all root expressed protists onA, and ~ 16% onL, indicating that Oomycetes were more active in roots on A(Fig. 4, Table 4, Additional file 12). More protist-annotated genes were upregulated in roots inl, compared toa, on both soils (Table 4). This was most pronounced on A, with 365 out of 490 root expressed Oomycete-annotated transcripts upregulated in l compared to a, while in L only 12 out of 239 significantly expressed Oomycete-annotated transcripts were upregulated inlcompared to a(Table 4, Additional file 12). A similar trend could be observed for protists (other) annotated transcripts where 443 out of 1183 significantly root expressed transcripts inAwere upregulated inl, compared toa, and 80 out of 1254 on L (Table 4, Additional file 12). Of the 365 Oomycete-annotated transcripts upregulated in l roots compared to aroots in Asoil 119 were KOG annotated with cellular process and signalling, 108 with informa-tion storage and processing and 88 with metabolism. Most of these genes were associated with transcription and translation-type processes (49 of these annotated with post-translational modification, 51 with signal transduction, 23 with RNA processing, 17 with tran-scription, 62 with translation)) (Additional file12).
Fungal colonization rates assessed using microscopy
Roots of all plants were colonized with both AM and non-AM fungi, whether grown in the reciprocal transplant experiment on A or L (Fig. 8a, c, Additional file 16) or maintained on their soils of origin (Fig. 8b, d). Hyphal colonization by AM fungi was significantly greater in roots on L thanA in plants maintained on their soil of origin (Fig.8b) (two-samplet test, t=−4.9, df = 5, p< 0.01), as well as in plants grown on L in the reciprocal transplant experiment (Fig. 8a, Additional file 16) (post hoc Tukey test,p< 0.001 following ANOVA,F(1, 21)= 65.51,p< 0.001). In contrast, hyphal colonization with non-AM fungi was significantly greater in roots fromAthanL in plants kept on their soils of origin (Fig.8b) (two-samplettest,t= 4.38, df = 6,p< 0.01), as well as in plants grown onAin the re-ciprocal transplant experiment (Fig.8a, Additional file16) (post hoc Tukey test,p< 0.001 following ANOVA,F(1, 20) = 72.66, p< 0.001). Furthermore, in the reciprocal trans-plant experiment, l showed significantly greater non-AM fungal hyphal colonization compared toawhen grown on A(two-sample ttest,t=−2.54, df = 8, p< 0.05) (Fig. 8a). This is corroborated by a significant interaction effect be-tween soil type and plant ecotype (ANOVA,F(1, 20)= 6.06,
p< 0.05), which indicated that the difference in non-AM hyphal colonization between soil types is greater inlthan in a (Additional file 16). In the transplant experiment, vesicles were only detected in roots grown on L (Fig.8c, Additional file16). In contrast, arbuscules were detected in roots grown on both soils, with significantly more detected in roots grown on L than A(ANOVA, F(1, 21)= 37.05, p < 0.001; post hoc Tukey test, p< 0.001) (Fig. 8c, Add-itional file16). Images of AM and non-AM fungal struc-tures identified in stained H. lanatus roots from the reciprocal transplant experiment can be seen in Additional file17.
Discussion
In this study, the response of H. lanatus ecotypes adapted to acid bog or and limestone quarry soil was characterized via meta-transcriptome analysis, comple-mented by chemical and root staining characterization, to evaluate plant and associated eukaryotic microbiota responses to edaphic stress. The approach is novel, as it assesses natural, multi-species colonization, in distinct genotypes of two disparate H. lanatus ecotypes, in a reciprocal transplant experiment. This provides insights
into edaphic, ecotypic and ecotype-microbiome
interaction effects. While RNA-Seq-based analysis of eukaryotic microbiome taxonomies is subject to some limitations, due to the conserved nature of protein cod-ing sequences, and the limited number of fully genome-sequenced fungal and protist species [25], it has the advantage that it can capture information on the active, functional aspects of the microbiome. Incorporation of
host and microbiome responses is crucial to understand-ing plant survival in harsh environments as host-microbe interactions contribute to plant survival, providing symbiont-mediated nutrient acquisition and protection against metal(loid) toxicity and pathogens [75,76].
The iterative annotation strategy employed, using high-quality protein databases in the absence of a H. lanatusgenome, enabled successful taxonomic and func-tional assignment of plant and microbe de novo assem-bled transcripts, based on the closest related organisms present in the database. This enabled us to perform a meta-transcriptome-based gene expression analysis to quantify plant and eukaryotic microbiome responses to extremes of soil, as they differ across the pH range from acid bog to calcareous limestone soil. This approach proved successful in identifying significant soil and eco-type effects, with respect to H. lanatus root and shoot expressed transcripts. It also provided a means to assess the activity of specific fungal subgroups and Oomycota inH.lanatusroots and shoots in each soil. Furthermore, it incorporated insights into microbial community com-position, but unlike DNA-based amplicon sequencing, it measured fungal and protist microbiome activity in root and shoot rather than presence/absence. Additionally, the approach demonstrated proposed functional redun-dancy within the microbial community, as demonstrated by the expression of particular genes by multiple genera, such as aldehyde dehydrogenases and ferric reductases.
K content inacompared tolshoots onA. Maintenance of K homeostasis is well recognized as a stress tolerance
mechanism in plants, including acid soil-grown
plants, and high-affinity K transporters employed under K starvation have been shown to be regulated by genes responsive to low pH stress and associated toxicities [1, 78]. Increased investment into K homeo-stasis, and accumulation of K in shoots, therefore, characterizes acid bog soil adapted H. lanatus.
Plants can implement various defensive measures to prevent colonization by pathogenic organisms [79]. Initial plant defense involves recognition of fungal elici-tors that trigger plant immune responses to prevent colonization. Elicitor signalling involving receptor-like kinases and pattern recognition receptors (PRRs), including PEPR2 [17], that sense either
pathogen-associated molecular patterns (PAMPs) or endogenous damage-induced molecular patterns (DAMPs). The ob-served upregulation of PEPR2 in roots and shoots of a on A compared to L may, therefore, indicate induction of defensive mechanisms in response to pathogen attack inaonA. Furthermore, lignin biosynthesis is involved in plant response to biotic and abiotic stresses, including nu-trient stress and prevention of pathogenic colonization [31,80]. The stronger expression of lignification genes in both ecotypes onLcould be in response to limestone soil-specific stressors, such as low P, Fe and N availability as well as biotic factors [80]. In addition to lignification genes, both ecotypes upregulated other pathogen defense-related genes, onLcompared toA. Gene responses affect-ing the cell wall may have been contributaffect-ing factors to the observed lower fungal activity in roots on Lcompared to
Ain both ecotypes. Alternatively, the observed lower fun-gal activity inLcould simply be due to lower presence of these organisms in this soil. Given the role of root lignifi-cation in preventing pathogenic infection [31,80], upregu-lation of lignin biosynthesis-related genes ina compared to l onA, could relate to a greater ability of the a, than thel, to limit soil and pathogen-induced cell damage and infection on A, backed up by the use of defensive genes such as PEPR2 in roots and shoots ofaonAcompared to L. The limestone ecotype, on the other hand, as not adapted to A, may be less able to induce this response when grown on this soil type. This hypothesis is based on the observed lower induction of plant genes involved in cell wall lignification, but greater detectable Ascomyctete, Basidiomycete and Oomycete activity inlcompared toa roots in A. Most of the Oomycete-annotated transcripts were best annotated asPhytophthora and were more ac-tive in A compared to L. Phytophthora are major plant pathogens, and cell wall strengthening has previously been proposed as a key method of defense against colonization of these organisms [77], with lignin conferring rigidity to cell walls [80]. Hence, greater expression of lignin biosynthesis-associated genes inamay play a role in limit-ing fungal and Oomycete pathogenic activity in a com-pared tolroots, when grown inA.
Phialocephala-annotated genes were identified as the dominant fungal genera in root gene expression profiles of both ecotypes inA, with this genus near absent in roots in L. Root endophytes within this genus have previously been reported [81, 82] and can protect against pathogens such as the Oomycete Phytophthora[82] which was more ac-tive inAthan inL. Within roots grown onA, many Phia-locephala-annotated transcripts were upregulated in a compared tol, while the opposite effect was observed for Oomycetes and Basidiomycetes, and some other Asco-mycete genera. Whether this is mediated via Phialoce-phala-induced cell wall strengthening to prevent
pathogen infection, as has been observed in
Glomeromycotina-induced pathogen resistance [83], is worth investigation; greaterPhialocephalaexpression ina compared tol onA coincided with increased expression of plant lignin-associated genes inacompared tolonA.
Colletotrichum-annotated transcripts were more prevalent inL-grown roots compared toA-grown roots. Within roots from L, many Colletotrichum and some other Ascomycete genera (includingFusarium, Acremo-nium and Trichoderma) annotated transcripts were up-regulated inl compared toa. The genusColletotrichum contains mostly pathogenic, but some mutualistic endo-phytes [84], with symbiotic interactions shown to involve improved P nutrition [85] or production of anti-fungal compounds [86]. It is worth investigating the role of these fungi in plant nutrition and defense inH. lanatus roots on limestone quarry soil and whether they
contribute to plant nutrition in this low P availability en-vironment, particularly since some Fusarium species have been identified as endophytes in some plants, in-cludingH.lanatus[27,87].
Just as plants respond to their edaphic environment, so do fungi, initiating nutrient uptake and other stress response measures [75]. Calcareous soils are typically limited in bioavailable Fe [88], so the greater prevalence of Ascomycota ferric reductases in roots from L, could be an adaptation to stresses associated with this soil type. Whether the non-AM fungi then provide Fe to the plant would be worth further investigation. Both non-AM and non-AM displayed clear soil type effects on colonization and gene expression activity, with greater numbers of significantly expressed Glomeromycotina annotated transcripts and AM hyphae identified in roots grown in Lcompared toA soil. H.lanatus colonization percentages of 25–50% found here by staining in the L are consistent with other studies [39]. Lower levels of AM colonization in roots from A (~ 10%), plus lower levels of Glomeromycotina activity identified by RNA-Seq are typical, as AM fungi are less prevalent in highly acidic soil such as the acid bog soilAused here [5,89], with some studies indicating sometimes no presence of AM fungi in highly acidic soil [89]. AM fungi have been shown to occur in a wide variety of soil types ranging from pasture to acid peat, with community composition most strongly influenced by pH, rain and soil type [90]. BothH. lanatusecotypes responded to low P availability on the L by upregulating genes involved in P uptake, transport and increased P use efficiency, suggesting this as an adaptation to L in both ecotypes, with low P also known to stimulate colonization and symbiotic action by AM [91]. With further additions of Glomeromycotina ge-nomes to publicly available databases, metatranscriptome analysis as presented here, will most likely become more effective with respect to the identification of functional re-sponses in AM fungi. That Glomeromycotina were con-tributing to P acquisition in both ecotypes in L is displayed by upregulation of genes involved in forming and maintaining the symbiosis, plus genes directly in-volved in P acquisition from the interaction. Furthermore,
the gene expression profile of