R E S E A R C H
Open Access
Atomic force microscopy in vitro study of surface
roughness and fractal character of a dental
restoration composite after air-polishing
Marco Salerno
1*, Luca Giacomelli
2, Giacomo Derchi
2, Niranjan Patra
1,3, Alberto Diaspro
1* Correspondence: marco. [email protected]
1Italian Institute of Technology, via
Morego 30, I-16163 Bolzaneto (Genova), Italy
Abstract
Background:Surface roughness is the main factor determining bacterial adhesion, biofilm growth and plaque formation on the dental surfaces in vivo. Air-polishing of dental surfaces removes biofilm but can also damage the surface by increasing its roughness. The purpose of this study was to investigate the surface damage of different conditions of air-polishing performed in vitro on a recently introduced dental restorative composite.
Methods:Abrasive powders of sodium bicarbonate and glycine, combined at different treatment times (5, 10 and 30 s) and distances (2 and 7 mm), have been tested. The resulting root mean square roughness of the surfaces has been measured by means of atomic force microscopy, and the data have been analyzed statistically to assess the significance. Additionally, a fractal analysis of the samples surfaces has been carried out.
Results:The minimum surface roughening was obtained by air-polishing with glycine powder for 5 s, at either of the considered distances, which resulted in a mean roughness of ~300 nm on a 30 × 30μm2 surface area, whereas in the other cases it was in the range of 400-750 nm. Both untreated surfaces and surfaces treated with the maximum roughening conditions exhibited a fractal character, with comparable dimension in the 2.4-2.7 range, whereas this was not the case for the surfaces treated with the minimum roughening conditions.
Conclusions:For the dental practitioner it is of interest to learn that use of glycine in air polishing generates the least surface roughening on the considered restorative material, and thus is expected to provide the lowest rate of bacterial biofilm growth and dental plaque formation. Furthermore, the least roughening behaviour identified has been correlated with the disappearance of the surface fractal character, which could represent an integrative method for screening the air polishing treatment efficacy.
Background
Dental caries is the most widespread disease, since it affects about 95% of the world population at some point during their lives [1]. Caries follow bacterial plaque formation, which arises after the increase in surface area accessible for bacterial adhesion due to the surface roughness associated with defects or damage of the dental structures [2-5]. In fact, the predominant role of surface roughness for bacterial adhesion with respect to other cofactors such as surface energy has already been clarified in the literature [6].
Traditional hand instruments or oscillating scalers used to remove dental plaque usually cause a significant increase in roughness of the underlying dental surfaces [3,7] made of either pristine or restorative material, causing in turn a faster re-growth of plaque in the time period following the treatment. Therefore, air-polishing (AP) with simultaneously ejected water and pressurized air containing abrasive powders has been introduced in dental cleaning, and is now routinely applied [8-10]. Sodium bicarbonate powder is largely used for AP [10]. Recently, glycine powder has also been tested in several in vitro, ex vivo and in vivo studies, demonstrating a good clinical efficacy and low abrasive effect [7,9,11-14].
Despite being the least invasive technique for the dental surfaces, even AP may result in surface damage [3,15], when the working parameters of type of abrasive powder, spraying time and distance are not correctly set. To date, AP surface effects have been studied by means of laser scanners or profilometers. One recognized advantage of these techniques lies in their ability to allow large areas characterization containing both untreated and AP treated regions. This makes it possible to measure the resulting defect depth and the absolute loss of material, and thus evaluate the integrity of the dental structures [12]. However, laser scanners and profilometers do not permit high-resolution measurement of the surface roughness. In this work we have performed an in vitro analysis on the effect of AP on the surface of a commer-cial material used in dental restoration using atomic force microscopy (AFM), which allows for a high resolution, direct quantitative characterization of the surface rough-ness [16,17]. Firstly, the AP treatment conditions resulting in the lowest dental structure damage - i.e. surface roughening - have been identified. Secondly, the effect of the different AP treatment conditions on the possible fractal character of the sur-face roughness has been analyzed. Sursur-face feature patterns exhibit a fractal character when they are self-affine, meaning that similar patterns can be found when zooming in or out to different orders of magnitude of the lateral field of view. The fractal analysis has already been applied to dental surfaces for classification of dental terns of different species in zoology [18] and for characterization of the wear pat-terns of bruxism [19], but to our knowledge has never been used in the analysis of AP of dental composite surfaces. This mathematical tool can provide a new way to account for the complexity of the topographical pattern of the treated material sur-face, which can in turn depend on the AP conditions. In fact, it is generally accepted that the measures of roughness from the distribution of heights z alone without any information on their spatial localization on the (x, y) plane is insufficient to comple-tely describe the surface roughness [16].
Methods
Material used
Specimen preparation
Slabs of the selected material were prepared in ambient air, by placing the material in rectangular plastic hollows used as a mold (5 mm × 5 mm lateral dimensions and 2 mm depth) and covering them with acetate strips. Exceeding material was pushed away by applying pressure over the strips with a quartz slide. The polymer composite was cured by irradiation for 40 s through the quartz slide with a blue LED lamp (Star-light Pro, Mectron, ITA), with total 5 W irradiation power across the emission spec-trum (440-480 nm wavelength).
Air-polishing
AP was performed using a standard commercial unit (Air Flow Handy 2, EMS SA, Nyon, Switzerland), with service air pressure of 3.5-4 bar (i.e. 51-58 psi) and instru-ment nozzle perpendicular to the specimen surface. Spraying distance was kept con-stant by means of a holding post, while spraying time was set via electronic control of an aperture. The instrument powder chamber was refilled after each AP run, to ensure maximum reproducibility of the powder jet.
The cured composite slabs were subjected to AP with either sodium bicarbonate powder or glycine powder (Air Flow Air and Air Flow Subgingival Perio, both from EMS SA, Switzerland). All possible combinations of different AP application times (t = 5, 10 or 30 s), and distances (d = 2 or 7 mm), were tested. These times and distances were chosen according to a previous study [11], after rescaling the time period to the treated surface area, which was kept constant to ~25 mm2, in order to obtain compar-able treatment doses (in terms of time over unit area). Overall, 8 slabs (4 treated with bicarbonate and 4 treated with glycine) were prepared for each combination of time and distance, and 4 untreated slabs were used as the reference controls.
Atomic force microscopy
The relative height maps of the sample surfaces, both for controls and AP treated spe-cimens, have been acquired in air with a commercial AFM instrument (MFP-3D, Asy-lum Research, USA) operating in tapping mode. The used probes (NSG10, NT-MDT, Russia) had nominal spring constant and resonance frequency values of ~10 N/m and ~250 kHz, respectively. Optimum scan size was estimated to be S = 30 μm (i.e. scan area 30 × 30 μm2), chosen on the basis of the dimension of the typical bacteria that are expected to adhere to the dental composite surface in vivo [20]. The surface rough-ness of each specimen has been evaluated as the root mean square (RMS) value Rqof
the distribution of heights in the AFM topographical images.
Statistical analysis of the roughness
The Rqvalues have been analyzed with descriptive statistics. Comparison between different
combinations of times and distances, and between powders, have been performed by means of ANOVA procedure with Bonferroni’s post-hoc test, using SPSS software (SPSS 14, SPSS Inc, USA). A significance p value < 0.05 was considered to be statistically relevant.
Fractal analysis of the texture
Generally, the Rqvalue of surfaces with fractal profile can scale with both the image
appears due to the limited field of view on the macroscopically wide surface. Dependence on t appears when the surface is associated with a physically evolving phenomenon, such as material deposition [22]. The general form of Rq(S,t) is the Family-Vicsek scaling law
[23] Rq= tb·f(S/tb/a), where f, called scaling function, includes all the dependency on S,
andaandbare the roughness and growth exponent, respectively. f should saturate to a constant for very high S values, such that Rq~tb. For low S values, in turn, it should be
f~Sa[23,24]. In our context we have investigated only the dependence of roughness Rqon
the AFM scan size S. We aimed to determine the Rq(S) relationship for three different
lim-iting cases, namely untreated samples, and samples having the surface treated with AP in a way typically resulting in the lowest and highest Rq, that means‘least AP damaged’and
‘most AP damaged’surfaces, respectively. For each specimen, the S in the imaging sequence has been increased in a 3× geometric ratio, from a minimum of 370 nm to the maximum allowed value of 90μm (instrumental limit), for a total of 6 data-points.
Results and discussion
Considerations on the spatial resolution
In the AFM approach, while the best attainable resolution can reach the molecular scale, the main issue is the trade-off between resolution and scope, the latter being the scan size S. In fact, differing from optical and electron microscopy, the AFM images are digital maps where the measured quantity (cantilever deflection or oscillation amplitude) is serially sampled point by point at discrete spatial positions. Since the scan speed is relatively low due to the feedback response time (typically between 4 and 40μm/s), a limited number of data-points is set, to maintain the overall image acquisi-tion time to acceptable values (typically 2 to 20 min). Therefore, setting a given S value means setting the lower limit of achievable resolution to the value of S/√N, where N is the number of acquired data-points (i.e. image pixels). Details smaller than the pixel linear size S/√N are low-passed in the spatial frequency domain, and averaged out into the value measured at the considered position. In our case, with S = 30 μm and √N = 512, the smallest roughness features considered had linear size ~60 nm.
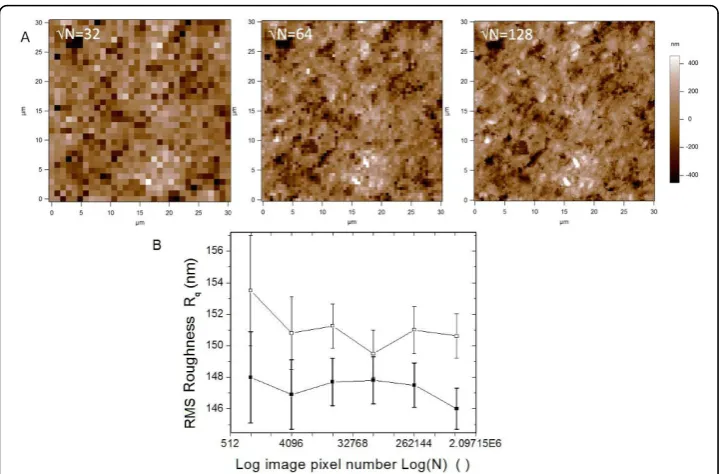
In order to verify whether this limit may affect our measurements, we have preliminarily analyzed control samples by repeating AFM imaging in the same region with√N increas-ing from 32 to 1024, in a geometrical ratio 2×, for a total of 6 data-points. This process has been repeated three times in different regions. The obtained sequences of Rqhave all
shown similar behavior. A representative case is reported in Fig. 1A, where the initial images (with lowest√N = 32, 64, and 128) of one such sequence are shown, which better describe the effect of insufficient and increasingly improved sampling of the surface fea-tures. In Fig. 1B the respective Rqvalues of the whole sequence have been plotted versus
the actual number of sampling points N. As N is rapidly increasing on doubling√N, a logarithmic scale (with base 10) has been used for the corresponding axis.
Two traces have been plotted in Fig. 1B, with Rqvalues measured both from the
between the two traces in Fig. 1B. In any case, the difference observed between the two traces is below 3%, with lower values for the flattened images (filled squares), as expected.
The error bars included in Fig. 1B are related to the difference between forward and backward scans of the same surface area. Despite the relatively large errors, lines have been traced that join consecutive data-points, which serve as guides to the eye. For both flattened and unflattened image data, these lines show a similar, roughly flat trend with Log(N), and comparable Rqvalues but for the highest N points, for which
the error bars of flattened and unflattened value do not overlap. Concerning the error bars, they appear larger for the two leftmost data-points of both plots in Fig. 1B, (i.e. for the two lowest N values). Indeed, when the real surface is properly sampled, the fluctuations are expected to decrease both in spatial frequency (i.e. N spacing) and amplitude (i.e. Rqvalue and the respective standard deviation around its mean). In Fig.
1B both the mean Rqvalues of flattened and unflattened images, their difference,
dif-ference, and the respective standard deviations (error bar lengths) reach a minimum at N = 2562.(fourth data-point starting from the left end of the plots). Therefore, our choice of N = 5122 for all the AFM images in the subsequent analysis guarantees that no Rqinformation from the analyzed surfaces is lost.
Change in roughness upon air-polishing
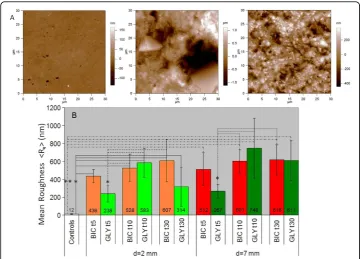
5 s with bicarbonate and glycine powders, respectively. It may be qualitatively observed that the control is smoother than both treated specimens. Moreover, the specimen treated with glycine is smoother than the specimen treated with bicarbonate. In parti-cular, sodium bicarbonate determined large depressions on the surface (typically 5-10
μm wide), whereas glycine was associated to smaller surface defects (typically 1-2μm wide). These observations were consistent throughout most combinations of treatment distance and time.
Quantitative analysis of Rqvalues confirmed these findings. The Rqvalues resulting
from the AFM images after AP for different t are represented in the Fig. 2B. The left half (light color bars) and the right half (dark color bars) of Fig. 2B refer to d = 2 and 7 mm, respectively.
For sodium bicarbonate (light and dark red bars) a trend towards an increase in Rq
over t can be observed; on the other hand, for glycine (light and dark green bars) the Rqvalue reaches a maximum for the intermediate time t = 10 s, after which it seems
to either decrease (for d = 2 mm, left half of Fig. 2B) or remain constant (d = 7 mm, right half of Fig. 2B). Overall, for both d = 2 and 7 mm, Rqincreased in all groups
The difference in Rqbetween treated specimens and controls was significant at all
times for both powders (p < 0.01 for bicarbonate at all times and glycine for 10 s, p < 0.05 for glycine for 30 s), with the exception of glycine sprayed for t = 5 s. The appli-cation of glycine for t = 5 s was associated to the lowest Rqvalue among all the treated
samples, reaching a significant difference in most comparisons (p < 0.05 vs bicarbonate at all times and vs glycine for t = 10 s).
Even if a trend towards an increase of surface damage with the increase of d was observed as in previous studies [12,14], this difference was only significant for glycine sprayed for t = 30 s (p < 0.05). This can be partly due to the adjustment of the jet aperture cone at different spraying distance d, which was made to keep the treated area constant.
Overall, we have confirmed on a composite material used for dental restoration the observation previously made in the literature only for natural teeth surfaces [11] -that during the AP process glycine powder determines less surface erosion than bicar-bonate. Two different patterns for bicarbonate and glycine in the variation of Rqover
the treatment time have also been identified in our measurement. In principle, and according to a previous study [14], an increase in surface damage may be expected over time, at constant distance. This effect has been observed for bicarbonate powder, at both considered distances, but not for glycine. In fact, particularly at a spraying dis-tance d = 2 mm a maximum of damage after AP for t = 10 s has been observed with this powder. Such an effect may be attributed either to a loss in power of the AP device over time when using glycine powder [14], which was not observed during the experimental process, or to the lower particle size of glycine. Indeed, glycine particles are about four times smaller than sodium bicarbonate particles [11]. On the basis of visual assessment by AFM, we may speculate that the larger bicarbonate particles remove larger portions of composite surface, thus resulting in a linear increase of Rqat
the adopted scan size S. On the other hand, glycine may determine smaller but most diffuse surface defects, determining a faster kinetics of damage, that may give rise to full surface coverage of defects, and thus result in a smoothing effect after removal of a whole material layer, within the considered treatment time (t = 30 s).
Concerning the clinical relevance of our measurements, comparison with the existing literature suggests that the RMS values reported in Fig 2 probably span the roughness range across which bacterial growth may indeed be activated or not, this step being found typically between ~200 nm and 800-2000 nm [24].
Fractal character of the surfaces
Material surface features usually exhibit a fractal character right after growth [24,25], (for example, thermal evaporated metal films normally evolve in clusters with cauli-flower-like structure, which is a typical form of fractal geometry [24,26]). Alternatively, a fractal character can arise as a consequence of surface treatment by physical or che-mical methods [20,27-30]. In the present case, both conditions of as deposited material (after preparation of the composite slab) and material that has undergone a surface treatment (namely AP) appear as the candidates for occurrence of a fractal character.
measurement will possibly be checked against the clinical results of the obtained sur-faces, such as the rate of bacterial growth.
In a Log-Log scale plot of Rq(S) for a fractal surface, it is possible to identify a
(roughness exponent) as the slope (see subsection “Fractal analysis of the surface”), which for the function Rq(S) can be identified with the Hurst exponent H [21,24]. This
coefficient can provide the fractal dimension D of the surface, if fractal in character, since it is D = DE-H, with DEdimension of the Euclidean space in which the
consid-ered object is embedded [21,25]. In our case it is DE= 3, as the AFM height images
are 3D surfaces z(x, y).
As an illustrative example of our measurements, a subset of a sequence of images with increasing S has been included in Fig. 3A. For each sample, two specimens out of 6 were chosen, and for each specimen two different regions were imaged. The data-points in the plot are the mean of all the measurements at a given scan size, and the error bars represent ±1s(standard deviation) ranges around them. Similar to the preli-minary analysis of the effect of image resolution on Rq (i.e. Fig. 1B), in all cases two
curves, for raw data and for flattened images, have been plot.
In Fig. 3B the Rqvalues for the control (untreated) specimens are reported with
respect to S, in a Log-Log plot, (log base 10). Clearly Rqincreases over the whole S
range considered, without reaching a plateau. With some deviation for the lowest S data-point, the measurements can be well fit by a straight line, with a common slope over more than three orders of magnitude for S. Therefore the surface displays a
space-invariant relationship of its topographical features as they reflect in the Rq(S)
function, and appears to be fractal.
As the slopes from the fits in Fig. 3B are in the range 0.31 ± 0.02, the fractal dimen-sion is Dcontrol= 2.69 ± 0.02.
Similar sequences of AFM images have been acquired also for selected cases of AP treated samples, and the respective processing has been performed. In order to find possible differences associated with the AP conditions, samples with the most different resulting Rq have been selected, according to statistical analysis. The ‘least AP
damaged’(i.e. lowest Rq) sample was the set of specimens treated with glycine at d = 2
mm and t = 5 s, whereas for the ‘most AP damaged’(i.e. highest Rq) sample the
speci-mens treated with bicarbonate at d = 7 mm and t = 10 s were selected. Same as for the control sample, the measurement has been repeated on two specimens from each sample, and on two different regions for each specimen. For each of the above four sets similar results were obtained, and in Fig. 4A and 4B representative sets for the ‘most AP damaged’and for the‘least AP damaged’sample are reported, respectively. In these images the error bars only refer to the semidispersion of the forward and backward images on the same area.
It can be seen that the for the‘most AP damaged’sample set (Fig. 4A) the Log-Log Rq(S) data-points followed also a roughly linear trend as for the control sample, which
means that a fractal character is preserved throughout the respective AP treatment. In fact, the residual-square correlation coefficients Δ2 between data-points and fitting lines in Fig. 4A is still as close to 1 as for the control data fits (see Fig. 3B). The slopes turn out to be 0.61 and 0.63 for the raw and for the flattened data in Fig. 4A, respec-tively, and 0.6 ± 0.1 for all the four sets altogether, such that the fractal dimension evaluated for this sample is DmostDamage= 2.4 ± 0.1. This is lower than the Dcontrol≅2.7
obtained for the control sample, possibly meaning that while still preserving the fractal character, the specimen surfaces treated in the considered AP conditions have under-gone some loss of the complex structure arising from material deposition.
On the contrary, data-points in the‘least AP damaged’sample set (Fig. 4B) cannot be properly fit by a straight line. The slope values of the fitting straight line would be in
the range of 0.45 ± 0.15 (for all the four sets altogether), corresponding to a DleastDamage=
2.55 ± 0.15, intermediate to DmostDamageand Dcontroland compatible with both of them.
However, theΔ2 values of 0.91 and 0.93 show that no more fractal character of the surfaces appears over the whole S range considered, but this property has been removed by the optimized AP treatment.
In a previous work on fractal analysis of worn human dental surfaces [19], an increase in D appeared upon the decay of the surface quality, which was accompanied by an increase in Rq. In our case, one could expect that conditions of minimum Rqbe
associated with minimum D. In fact, the ‘least AP damaged’ sample cannot be com-pared with the‘most AP damaged’sample to this extent, as the former shows no frac-tal dimension at all. In turn, when comparing the control sample with the ‘most AP damaged’ sample a decrease in D, opposite to the increase in Rq, appears; however,
one should keep in mind that Dcontrolarises from material deposition, whereas D
most-Damage arises from its later treatment, so they can be hardly correlated. Obviously AP
destroys the former kind of fractal character, and, when not optimized, induces a new, generally not correlated fractal character.
Conclusions
In this work we have determined in vitro the conditions for AP treatment of a given commercial composite for dental restoration (Venus Diamond) that, within a given set of combinations of working parameters (two abrasive powders of bicarbonate and gly-cine, two spraying distances of 2 and 7 mm, and three times of 5, 10, and 30 s) result in the lowest roughening of the composite surface. It is speculated that the same treat-ment applied to the same material in vivo should result in a reduced bacterial coloni-zation rate. The best (i.e. least surface damage) AP conditions found are 5 s treatment with glycine powder at a distance of 2 mm. Glycine performed better than bicarbonate also at the other considered distance of 7 mm. Roughening resulting from AP at treat-ment times of 10 and 30 s was overall comparable for bicarbonate and glycine.
Three differently ranked AP conditions (untreated, ‘least AP damaged’, and‘most AP damaged’) were further characterized by means of a fractal analysis of the spatial distri-bution of the surface roughness features. As a result, it was found that whereas the effect of the most damaging AP procedure is only a decrease in fractal dimension of the surface, the least damaging AP procedure destroys the correlation among the sur-face features, resulting in a disappearance of their fractal character. This finding sug-gests that the fractal analysis can be a helpful tool for a deeper characterization of dental surfaces.
The absence of experimental data on bacterial growth on our samples is one limita-tion of the present work. Such investigalimita-tions are currently in progress in our labora-tory, and will be the subject of a forthcoming report as soon as statistically relevant data will be available.
Acknowledgements
Dr. Annamaria Genovesi of Tirrenian Stomatologic Institute and Dr. Pierpaolo Paganin of EMS Italia (Milano) are gratefully acknowledged for fruitful discussions.
Author details 1
Authors’contributions
LG conceived of the study, participated in its design, and performed the statistical analysis of Rq. GD carried out the specimen preparation and the AP treatment. MS participated in the design of the study and coordinated it, participated in the AFM measurements, performed the AFM image analysis to extract Rq values and fractal character, and drafted the manuscript. NP participated in the AFM measurements and helped draft the manuscript. AD revised the manuscript substantially.
All authors read and approved the final manuscript.
Competing interests
The authors declare that they have no competing interests.
Received: 30 June 2010 Accepted: 12 October 2010 Published: 12 October 2010
References
1. Estévez M, Vargas S, Castaño VM, Rodríguez JR, Hagg Lobland HE, Brostow W:Novel wear resistant and low toxicity dental obturation materials.Materials Letters2007,61:3025.
2. Berasategui E, Canalda C, Brau E, Miquel C:Surface roughness of finished composite resins.J Prosthet Dent1992,
68:742.
3. Arabaci T, Ciçek Y, Ozgöz M, Canakçi V, Canakçi CF, Eltas A:The comparison of the effects of three types of piezoelectric ultrasonic tips and air polishing system on the filling materials: an in vitro study.Int J Dent Hyg2007,
5:205.
4. Kantorski KZ, Scotti R, Valandro LF, Bottino MA, Koga-Ito CY, Jorge AO:Surface roughness and bacterial adherence to resin composites and ceramics.Oral Health Prev Dent2009,7:29.
5. Hahnel S, Rosentritt M, Bürgers R, Handel G:Adhesion of Streptococcus mutans NCTC 10449 to artificial teeth: An in vitro study.J Prosthet Dent2008,100:309.
6. Teughels W, Van Assche N, Sliepen I, Quirynen M:Effect of material characteristics and/or surface topography on biofilm development.Clin Oral Imp Res2006,17:68.
7. Petersilka GJ, Tunkel J, Barakos K, Heinecke A, Häberlein I, Flemmig TF:Subgingival plaque removal at interdental sites using a low-abrasive air polishing powder.J Periodontol2003,74:307.
8. Frankenberger R, Lohbauer U, Tay FR, Taschner M, Nikolaenko SA:The effect of different air-polishing powders on dentin bonding.J Adhes Dent2007,9:381, Erratum in: J Adhes Dent 2007, 9:442.
9. Flemmig TF, Hetzel M, Topoll H, Gerss J, Haeberlein I, Petersilka G:Subgingival debridement efficacy of glycine powder air polishing.J Periodontol2007,78:1002.
10. Johnson WW, Barnes CM, Covey DA, Walker MP, Ross JA:The effects of a commercial aluminium airpolishing powder on dental restorative materials.J Prosthodont2004,13:166.
11. Petersilka G, Faggion CM Jr, Stratmann U, Gerss J, Ehmke B, Haeberlein I, Flemmig TF:Effect of glycine powder air-polishing on the gingiva.J Clin Periodontol2008,35:324.
12. Petersilka GJ, Bell M, Häberlein I, Mehl A, Hickel R, Flemmig TF:In vitro evaluation of novel low abrasive air polishing powders.J Clin Periodontol2003,30:9.
13. Petersilka GJ, Steinmann D, Häberlein I, Heinecke A, Flemmig TF:Subgingival plaque removal in buccal and lingual sites using a novel low abrasive air-polishing powder.J Clin Periodontol2003,30:328.
14. Petersilka GJ, Bell M, Mehl A, Hickel R, Flemmig TF:Root defects following air polishing.J Clin Periodontol2003,30:165. 15. Pikdoken ML, Ozcelik C:Severe enamel abrasion due to misuse of an air polishing device.Int J Dent Hyg2006,4:209. 16. Assender H, Bliznyuk V, Porfyrakis K:How Surface Topography Relates to Materials’Properties.Science2002,297:973. 17. Kakaboura A, Fragouli M, Rahiotis C, Silikas N:Evaluation of surface characteristics of dental composites using
profilometry, scanning electron, atomic force microscopy and gloss-meter.J Mater Sci Mater Med2007,18:155-163. 18. Stone J, Telform M:Fractal dimensions characterizing mammal teeth: a case study involving Elephantidae.Mammal
Rev2005,35:123.
19. Restrepo C, Pelaez A, Alvarez E, Paucar C, Abad P:Digital imaging of patterns of dental wear to diagnose bruxism in children.Int J Paediatric Dentistry2006,16:278.
20. Kang MC, Kim JS, Kim KH:Fractal dimension analysis of machined surfaces.Surf Coat Technol2005,193:259. 21. Mandelbrot BB:The fractal geometry of natureFreeman 1982.
22. Vicsek T:Fractal growth phenomenaWorld Scientific 1992.
23. Family F, Vicsek T:Scaling of the active zone in the Eden process on percolation networks and the ballistic deposition model.J Phys A: Math Gen1985,18:L75.
24. Bollen CML, Lambrechts P, Quirynen M:Comparison of surface roughness of oral hard materials to the threshold surface roughness for bacterial plaque retention: A review of the literature.Dent Mater1997,13:258.
25. Sun X, Fu Z, Wu Z:Fractal processing of AFM images of rough ZnO films.Materials Character2002,48:169. 26. Peitgen HO, Saupe D:The Science of Fractal ImagesSpringer 1989.
27. Chadzynski GW, Staszczuk P, Sternik D, Blachnio M:Studies of physico-chemical properties and fractal dimensions of selected high-temperature superconductor surfaces.J Thermal Analysis and Calorimetry2008,94:623.
28. Arnault JC, Knoll A, Smigiel E, Cornet A:Roughness fractal approach of oxidized surfaces by AFM and diffuse X-ray reflectometry measurements.Appl Surf Sci2001,171:189.
29. Shinshokovsky I, Morozov Y, Smurov I:Nanostructural self-organization under selective laser sintering of exothermic powder mixtures.Appl Surf Sci2009,255:5565.
30. Cheng KM, Liu XY, Guan DB, Xu T, Wei Z:Fractal Analysis of TATB-Based Explosive AFM Morphology at Different Conditions.Propellants, Explosives, Pyrotechnics2007,32:301.
doi:10.1186/1475-925X-9-59