R E S E A R C H
Open Access
Automatic tracking of cells for video
microscopy in patch clamp experiments
Helton M Peixoto
1,3, Hermany Munguba
1, Rossana MS Cruz
2, Ana MG Guerreiro
3and Richardson N Leao
1,4**Correspondence:
[email protected] 1Brain Institute, Federal University of Rio Grande do Norte, 2155, 59056-450 Natal - RN, Brazil 4Department of Neuroscience, Uppsala University, Uppsala, Sweden
Full list of author information is available at the end of the article
Abstract
Background: Visualisation of neurons labeled with fluorescent proteins or compounds generally require exposure to intense light for a relatively long period of time, often leading to bleaching of the fluorescent probe and photodamage of the tissue. Here we created a technique to drastically shorten light exposure and improve the targeting of fluorescent labeled cells that is specially useful for patch-clamp recordings. We applied image tracking and mask overlay to reduce the time of fluorescence exposure and minimise mistakes when identifying neurons.
Methods: Neurons are first identified according to visual criteria (e.g. fluorescence protein expression, shape, viability etc.) and a transmission microscopy image Differential Interference Contrast (DIC) or Dodt contrast containing the cell used as a reference for the tracking algorithm. A fluorescence image can also be acquired later to be used as a mask (that can be overlaid on the target during live transmission video). As patch-clamp experiments require translating the microscope stage, we used pattern matching to track reference neurons in order to move the fluorescence mask to match the new position of the objective in relation to the sample. For the image processing we used the Open Source Computer Vision (OpenCV) library, including the
Speeded-Up Robust Features (SURF) for tracking cells. The dataset of images (n = 720) was analyzed under normal conditions of acquisition and with influence of noise (defocusing and brightness).
Results: We validated the method in dissociated neuronal cultures and fresh brain slices expressing Enhanced Yellow Fluorescent Protein (eYFP) or Tandem Dimer Tomato (tdTomato) proteins, which considerably decreased the exposure to fluorescence excitation, thereby minimising photodamage. We also show that the neuron tracking can be used in differential interference contrast or Dodt contrast microscopy.
Conclusion: The techniques of digital image processing used in this work are an important addition to the set of microscopy tools used in modern electrophysiology, specially in experiments with neuron cultures and brain slices.
Keywords: Neurons, Fluorescent proteins, Photodamage, Patch-clamp, Image tracking, Mask overlay
Introduction
Patch-clamp experiments in cultures or brain slices require a careful assessment of tar-geted cells before placing the patch electrode [1]. Consequently, the microscope stage is constantly moved in both xy axis as in z (focus) and targeted cells can often be missed during the patch electrode lowering. In addition, with the discovery and cloning of the green fluorescent protein (GFP) [2], fluorescence optical imaging permits not only the identification of genetically distinct neuronal populations but also queries for intracel-lular changes of ion concentrations or membrane potential in subcelintracel-lular compartments that are unreachable to electrodes [3-5]. The rapid development and widespread usage of fluorescent probes demand the creation and optimisation of fluorescent microscopy techniques. To minimise bleaching and photodamage, modern microscope objectives have a very high numerical aperture and more sensitive detection systems that virtually approach the ideal photon detection limit by converting every photon reaching the sensor into an electron. For example, some back-illuminated cooled EM-CCD (Electron Multi-plying Charge Coupled Device) cameras can have quantum efficiencies (the ratio between electron-hole pairs produced by photons colliding with the sensor and the total number of photons that actually collided with the sensor) very close to 100%. In addition to the optimisation of objectives and detectors, modern emission and excitation filters achieve sharp and efficient cut off of unwanted wavelengths, while passing almost with no loss the desired light spectrum. Yet, detection of fluorescence emanating from synthetic com-pounds or proteins still requires high intensity excitation, which damages the tissue (when applied for long periods) especially in epifluorescence systems, often used in patch-clamp experiments [6,7].
development was also performed using C++ programming language and Open Source Computer Vision (OpenCV) library. This allowed a considerable reduction of the expo-sure time of the tissue to excitation light and an easier manipulation of target cells, providing improvements in experiments with fluorescent guided patch-clamp.
Materials and methods
Experiments using C57B6, or Gad2tm2(cre)Zjh/J (Jackson Labs) crossed with Gt(ROSA)26Sortm14(CAG−tdTomato)Hze (Allen Brain Institute) (Gad2tdTom) were con-ducted in accordance with the Uppsala University and Federal University of Rio Grande do Norte guidelines for care and use of laboratory animals. All efforts were made to minimise the suffering and the number of animals used.
Cell culture
Primary cultures of hippocampal neurons for transfection with the genetic encoded cal-cium indicator yellow cameleon (gift from Takeharu Nagai, Sapporo University) [12] were prepared from mouse pups 0–2 days old. Hippocampi were dissected in ice-cold PBS 10mMglucose and transferred to a similar solution containing 0.5mg/mlpapain and 10ul/mlDNase for 30 min at 37°C. The hippocampi were triturated with glass pipettes and the resulting cell suspension was seeded in plates with coverslips precoated with both poly-L-lysine and laminin.
Cultures were plated in Neurobasal-A Medium, supplemented with 2% B27 (NB/B27), 1mMNa-pyruvate, 2mML-glutamine, and 100U/mlpenicillin + 100mg/ml strepto-mycin (1x PEST). Cultures went through calcium phosphate transfection 4–6 days after plating. The cells were allowed to grow until analysis of expression or electrophysiology.
Hippocampus slices
P21-P28 hippocampal slices were obtained as described in [13]. In summary, brains were rapidly removed and placed in ice-cold sucrose/artificial cerebrospinal fluid (ACSF), in mM:KCl, 2.49;NaH2PO4, 1.43;NaHCO3, 26; glucose, 10; sucrose, 252;CaCl2, 1.0;MgCl2, 4.0. Horizontal slices containing the hippocampus were obtained using a vibratome and subsequently moved to a submerged holding chamber containing ACSF (in mM:NaCl, 124;KCl, 3.5;NaH2PO4, 0.25;MgCl2, 1.5;CaCl2, 1.5;NaHCO3, 30; glucose, 10), bubbled with 95%O2/5%CO2, where they were kept until being moved to the microscope stage.
Video microscopy
Dodt contrast tube between the transmission light source and the condenser (Luigs and Neumann, Germany).
Image processing techniques
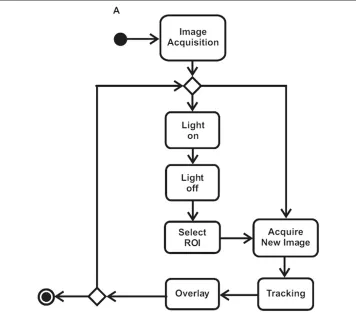
The computational algorithms utilized in this work were implemented with C++ pro-gramming language and OpenCV for real time computer vision. Figure 1 shows an activity diagram UML (Unified Modeling Language) indicating the steps for image mask overlay and neuron tracking. For mathematical purposes, consider an image as a function of two variablesf(x,y)wherexandyare spatial (plane) coordinates and the value at a given point I(x,y)is the amplitude of the pixel.
Tracking with SURF
SURF method is a scale and rotation-invariant detector and descriptor used in object recognition. This technique that shows high repeatability, distinctiveness and is compu-tationally efficient [11]. The operation of SURF initially consists in selects interest points at different locations within the images (e.g. blobs). Subsequently, it creates a feature
vector which includes characteristics of points neighboring the region of interest. Finally, matching is performed by measuring distances between vectors using formulae like the Mahalanobis or Euclidian metric.
Interest points
SURF detector is based on the calculation of the determinant of Hessian matrix (H), that allows to find blob-like structures at locations from the maximum value of the deter-minant. This can be calculated directly according to (1), but it is not computationally recommended. Thus, it can be calculated by the approximation given in (2), where the Hessian matrix is accomplished the function spacex=(x,y)andσscale.
H(f(x,y))= ⎡ ⎣
∂2f ∂x2 ∂
2f ∂x∂y
∂2f ∂y∂x
∂2f ∂y2
⎤
⎦ (1)
H(x,σ)=
Lxx(x,σ) Lxy(x,σ) Lyx(x,σ) Lyy(x,σ)
(2)
and
Lxx(x,σ)=I(x)∗ ∂ 2
∂x2g(σ) (3)
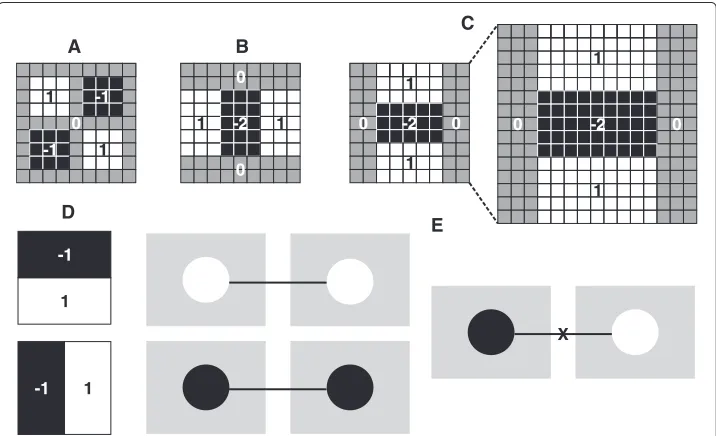
Where the Lxx(x,σ) in (3) is the convolution of the second order Gaussian deriva-tive ∂∂x22g(σ)with the image at pointI(x) and similarly toLyy andLxy. The images are represented by performing an integral calculus based on Viola and Jones method [14], and the second derivative of gaussian kernel is approximated by the box filter shown in Figure 2A-C.
Figure 2 Filters and types of matching used by SURF.(A),(B), and(C)Approximation of Gaussian second order partial derivatives using box filters:Dxyin xy-direction,Dxxin x-direction and y-direction inDyy,
respectively, with increased kernel size from (9×9) to (15×15) in(C).(D)Haar wavelet filters in response todx
Then the determinant of the Hessian matrix can be calculated by (4), andwis a weight used to balance the equation. That is, the blob response at locationI(x).
Det(H)≈DxxDyy−(wDxy)2 (4)
Surf allows to find interest points in different scales. The idea of scale-space is imple-mented by changing the size (eg. 9×9, 15×15, 21×21 and 27×27) of the kernel used in the convolutional process. Thus, to locate and map the interest points in both space and scale, it is applied the 3D Non Maximum Suppression (NMS) technique to a (3×3×3) neighborhood as sub-pixel accuracy as can be seen in [15,16].
Feature vector and Matching
The creation of a feature vector(V)64-dimensional (5) is based on information from descriptors of a area around the interest point. These descriptors are the result of applying filters (Haar wavalets) Figure 2D centered around (4×4 regular subregions) the interest points of the image, and provide the gradient inxandydirections. This allows invariance to rotation, translation and brightness during matching [15].
V = dx, dy, |dx|, |dy|
(5)
In matching step, it is verified the sign of the Laplacian matrix (6) with no extra compu-tational cost, since this information is previously known. This allows the comparison of two similar types of contrast (ie dark or clear blob-types) Figure 2E.
∇2L=tr(H)=L
xx(x,σ)+Lyy(x,σ) (6)
The Laplacian of a Hessian matrix is the sum of the diagonal elements. Finally, the algo-rithm seeks for the smallest Euclidean distance between the vectors, that is, the pairs most likely to be similar.
Alpha blending
Two-dimensional domain pixel transforms are performed in one or more input images, producing an output image. This operation is given by:
g(x,y)=h(f0(x,y),. . .,fn(x,y)) (7)
whereg(x,y)is the result of the transform applied on the input imagesf(x,y).
Alpha blending technique can perform blending between 2 images of different sizes, for example, a ROI and an image frame. In this way, it is possible to combine the two images and overlay one over another. Alpha blending expression is shown in (8):
g(x,y)=αf0(x,y)+(1−α)f1(x,y) (8)
whereα must be a value between 0 and 1 and it represents the blending opacity level. f0(x,y)is a ROI andf1(x,y)is the image [17].
Results
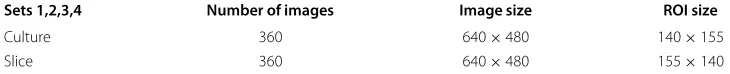
As shown in Table 1, the dataset of analyzed images consists of eight sets equally divided between neuron cultures and brain slices. Each set is composed by a series of 90 images, totalizing 360 images of each type. The computer used in the experiments is a 64-bit (x64) Intel Core i5 with 8 GB of RAM, OS Ubuntu linux 12.04.
Image acquisition environment
The diversity of the environment where images were obtained requires that image pro-cessing techniques are reliable to the point of allowing the user to maintain the position of the ROI in real time during the patch-clamp experiments, which can be difficult just by performing a simple live acquisition. Figure 3 exemplifies the use of SURF for tracking a ROI in adverse environment conditions, such as displacement, defocusing and brightness, during image acquisition.
The open source software was implemented in C++ and OpenCV with no restriction for distribution and there are future plans to include electrophysiology data acquisition routines in the imaging package described here. This software is released under the GNU General Public License and the latest development sources are available online (https:// github.com/neurodynamics/neuronTracking).
Neuron tracking using SURF and ROI overlay
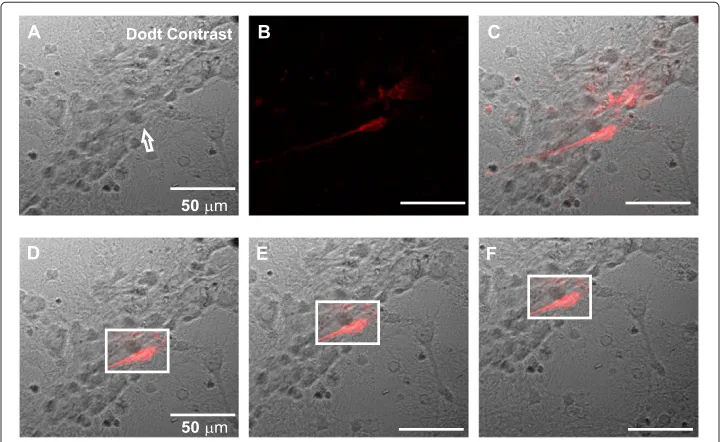
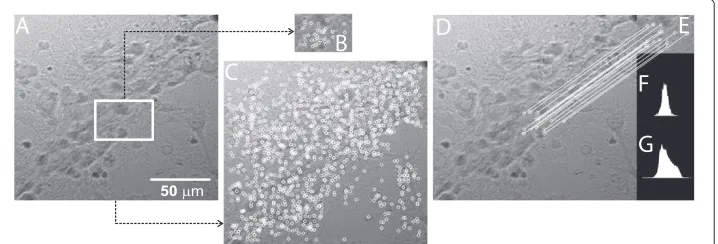
To maintain fluorescence information available during live preview, it is necessary to find fluorescent cells. This is accomplished by a manual search in the xyz axis in alterna-tion with the on/off procedure at the light source for excitaalterna-tion in the desired region. Figure 4A and 4B show a region that is responding to light excitation appropriately. Figure 4C presents blending between fluorescence information of Figure 4B (Light on) and the image of the same region in Figure 4A (Light off ). Figure 4D and 4F show the blending proccess according to a ROI (white square) tracking using SURF in displaced images.
The Operation of SURF in images of cell cultures is shown in Figure 5. The ROI is selected in Figure 5A, for the subsequent detection of interest points (keypoints) at the ROI in Figure 5B and full frame in Figure 5C. In this way, we can compare the feature vector selected (normalized in white circles) in both Figure 5D and 5E, and thus select the best matches.
SURF performance
Some metrics were applied to the images of the built dataset to test operation under conditions similar to those found in patch-clamp experiments. Focus changes can be accomplished by applying linear filters in images. For this purpose, we used Gaussian blur technique that consists in convolving an imagef(x,y)with a Gaussian functionh(k,l), according to (9) [19].
g(x,y)= k l
f(x+k,y+l)h(k,l) (9)
Table 1 Image dataset
Sets 1,2,3,4 Number of images Image size ROI size
Culture 360 640×480 140×155
A
B
C
D
Figure 3 Images of brain slices in different conditions.(A)Slice image used as a template for the selection of a ROI.(B)ROI tracking during microscope displacements (xy axis).(C)ROI tracking during image defocusing.(D)ROI tracking under high brightness conditions due gamma increase.
In a simplified form:
g(x,y)=f(x,y)∗h (10)
The brightness and contrast adjustments in an imagef(x,y)can be performed from the multiplication (α) and addition (β) of constants, as shown in (11) [17].
g(x,y)=αf(x,y)+β (11)
It is important to test SURF method in adverse conditions to validate its use in microscopy experiments, more specifically during patch-clamp. Frequently, video acqui-sition is noisy and suffers from changes in brightness or focus that can interfere with the tracking algorithm. To test the consistency of the SURF algorithm in such situations, we emulate changes in brightness and focus by changing gamma and blur levels of slice and culture images. For these analysis, we randomly selected 10% of our data set (Table 1). A ROI was attributed to each single image and up to 13 levels of gaussian blurring or 100
A
B
D
E
F
G
C
Figure 5 SURF algorithm.(A)Image with a ROI selected (white square) acquired by user.(B)and(C)SURF keypoints detected in the images.(D)and(E)Matching of the best keypoints.(F)and(G)Histograms of 8-bits grayscale images (EandD, respectively).
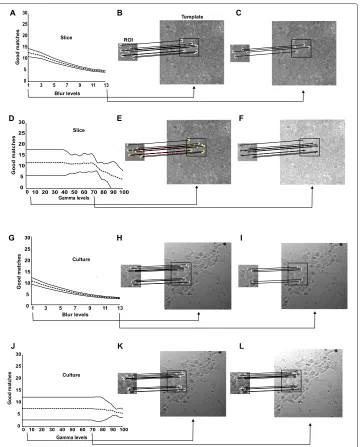
levels of gamma were applied to the image. Figure 6 shows a selected ROI and its match-ing with templates in normal conditions (Figure 6B and 6C), with gaussian blurrmatch-ing at 13 levels (Figure 6H and 6I), using gamma at 5 levels (Figure 6E and 6K), and high gamma level (factor 70) (Figure 6F and 6L). Figure 6A and 6G represent the mean amount of good matches (black line) and the 95% confidence interval (CI) (dashed lines) during blurring increase in slice and culture images, respectively, using (10). Figure 6D and 6J represent the mean amount of good matches (black line) and the 95% CI (dashed lines) during brightness increase in slice and culture images, respectively, using (11). The reliability of the SURF algorithm decayed monotonically when blur levels were increased in both slice and culture image sets (Figure 6). On the other hand, changes in SURF performance was just observed in gamma levels greater than 70 in slices while, in culture images, the perfor-mance was not affected by gamma changes (Figure 6). This data shows that ROI tracking remains uncompromised during typical changes in brightness and focus in patch-clamp experiments.
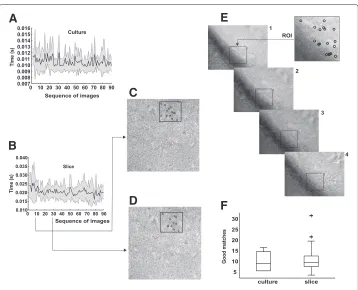
We then applied the SURF algorithm to hippocampus culture and slice images of the entire data set (Table 1). In both cultures and slices, the ROI was rapidly retrieved within an image (Figure 7A-D). Figure 7E is a sample of ROI detection in 4 levels of manual focus changes. Figure 7F shows the boxplot graphs of medians of good matches to both types of images analysed under normal conditions. The time necessary for ROI tracking in live image is sufficient for allowing live video preview at video rate with no perceivable jerking (Figure 7A-D). While detection time was shorter in culture images compared to slices, SURF performance was similarly reliable in slice and culture videos (Figure 7F). In all tests performed, the ROI is maintained within the field of view, however, it is possible to use a minimal amount of keypoints to estimate whether the ROI is present or not.
Discussion and conclusions
Figure 6 SURF robustness in adverse image conditions.(A)Mean amount of good matches (black line) and 95% CI (dashed lines) at different bluring. Examples of ROI detection for 1(B)and 13(C)levels of blurring. levels for slice images;(D)mean amount of good matches (black line) and 95% CI (dashed lines) at different levels of gamma (brightness).(E),(F)Examples of ROI detection in levels 5 and 70 of brightness, respectively.(G-L)Same as A-F for culture images.
B
A
C
D
F
E
Figure 7 Video-rate frame by frame detection using SURF.(A),(B)Mean time (black line) and 95% CI (gray shadow) for the detection of keypoints in culture and slice images sequences, respectively.(C),(D) Examples of ROI detection (black square) and good matches (black circles) at different time points.(E) Examples of ROI detection in 4 levels of manual focus changes.(F)Mean amount of good matches in culture and slice image sequences.
image. It is important to note here that acute slices used in patch-clamp experiments are very thick (> 200μm), therefore, the image sensor register a mixture of focused cells with blurred structures from defocused planes. Hence, the detection algorithm deals with complex images containing high contrast regions blended with low-contrast ones. Changes in focus shift sharp regions as new structures enter the focal plane and blur the region (cell) of interest, creating, statistically, a whole new image. The SURF method is known to overcome affine transformations (scaling and in-plane rotation) [21], brightness and small levels of focus. Yet, this technique does not support large differences in focus. This weakness of the SURF in relation to object recognition in conventional computer vision task represent an advantage of the method applied to imaging of live thick slices as the incapacity of the SURF to detect the targeted neuron when the focus is changed indicate that that neuron is out-of-focus. Besides its computational cost is demonstrably reduced when compared with similar techniques as SIFT [22] making it very appropriate for real time image analysis.
in the display at the user’s discretion. Fluorescence tagging is commonly for a priori identification of cell types in the patch-clamp laboratory [23]. An uncountable number of transgenic animals displaying various fluorescent proteins in different cell types can be purchased from commercial or public organisations and these animals are extremely important tools in modern neurophysiology [23,24]. In addition, there are a variety of synthetic fluorescence compounds that can also be used for the identification of glia or specific neuron types that might have a greater affinity for particular compounds, allow-ing specific labelallow-ing [4]. There are also various fluorescent indicators that can be used to isolate projection neurons following a previous in vivo injection of a tracer [25]. Patch-clamp recordings of labeled cells require the constant switching between fluorescence and transmission modes [26]. If the patch-clamp setup is fitted with DIC optics, the switching between fluorescence and DIC modes normally involves removing at least two optical components and/or a filter set above the objective [23]. Mechanically removing components during patch-clamp experiments often causes vibrations that can destroy established cell/electrode seals. This problem can be more traumatic when executing multiple-cell patch-clamp recordings. The Dodt contrast method does not require optical components above the objective; however, the definition of neurons, especially neurites, is generally inferior to the one obtained with DIC optics [27]. Moving a virtual fluorescence mask according to xy-plane changes in the field of view eliminates the need to switch to fluorescence mode once a field of interest is determined.
Optogenetic activation of neurons is a technique that is becoming customary in almost every neuroscience lab [10]. In general, optogenetic constructs carry the coding for flu-orescent proteins to indicate cells that are expressing the rhodopsins. The excitation wavelength often coincides with the wavelength that triggers light-activated channels (e.g. channelrhodopsin 2 tagged with yellow fluorescent protein [7,10]. Inspection of the tis-sue using fluorescence can, therefore, cause unwanted activation of rhodopsin-expressing neurons by the microscope light source, generating overexcitation of the tissue that leads to damage [7]. Hence, in vitro patch-clamp experiments involving optogenetics can greatly benefit from a neuron tracking software.
In summary, we have demonstrated a new tool for tracking neurons in electrophysiol-ogy experiments. The ability of the software to detect neurons of interest was illustrated using DIC and Dodt contrast imaging of primary neuronal cultures and acute brain slices typically used in patch-clamp experiments. Besides, technique allows for the overlaying of a fmask (fluorescence) without the need to rexposure to epifluorescence illumination.
Abbreviations
3D: Three dimensional; ACSF: Artifcial cerebrospinal fluid; CAPES: Brazilian coordination for the improvement of higher education; DIC: Diferential interference contrast; EM-CCD: Electron multiplying charge coupled device; eYFP: Enhanced yellow fluorescent protein; GFP: Green fluorescent protein; NMS: Non maximum suppression; OpenCV: Open source Computer vision; RNA: Ribonucleic acid; ROI: Region of interest; ROS: Reactive oxygen species; SURF: Speeded-up robust features; tdTomato: Tandem dimer tomato; UML: Unified modeling language.
Competing interests
The authors declare that the research was conducted in the absence of any commercial or financial relationships that could be construed as a potential conflict of interests.
Authors’ contributions
HMP, HM, RNL performed the experiments; HMP and RNL designed the experiments; HMP, RMSC, AMGG and RNL wrote the paper. All authors read and approved the final manuscript.
Acknowledgements
This work was supported by the Kjell and Märta Bejers Foundation and the Brazilian Coordination for the Improvement of Higher Education (CAPES).
Author details
1Brain Institute, Federal University of Rio Grande do Norte, 2155, 59056-450 Natal - RN, Brazil.2Federal Institute of
Education, Science and Technology of Paraiba, Joao Pessoa - PB, Brazil.3Department of Computer Engineering and Automation, Federal University of Rio Grande do Norte, Natal - RN, Brazil.4Department of Neuroscience, Uppsala University, Uppsala, Sweden.
Received: 2 April 2014 Accepted: 6 June 2014 Published: 20 June 2014
References
1. Neher E, Sakmann B, Steinbach J:The extracellular patch clamp: a method for resolving currents through individual open channels in biological membranes.Pflugers Archiv1978,375(2):219–228.
2. Tsien RY:The green fluorescent protein.Annu Rev Biochem1998,67:509–544.
3. Perron A, Mutoh H, Launey T, Knopfel T:Red-shifted voltage-sensitive fluorescent proteins.Chem Biol2009, 16:1268–1277.
4. Paredes RM, Etzler JC, Watts LT, Zheng W, Lechleiter JD:Chemical calcium indicators.Methods2008,46(3):143–151. 5. Leao RN, Reis A, Emirandetti A, Lewicka M, Hermanson O, Fisahn A:A voltage-sensitive dye-based assay for the
identification of differentiated neurons derived from embryonic neural stem cell cultures.PLoS One2010, 5(11):e13833.
6. Dixit R, Cyr R:Cell damage and reactive oxygen species production induced by fluorescence microscopy: effect on mitosis and guidelines for non-invasive fluorescence microscopy.Plant J2003,36:280–290. 7. Leão RN, Mikulovic S, Leão KE, Munguba H, Gezelius H, Enjin A, Patra K, Eriksson A, Loew LM, Tort AB, Kullander K:
OLM interneurons differentially modulate CA3 and entorhinal inputs to hippocampal CA1 neurons.Nat Neurosci2012,15(11):1524–1530.
8. Murphy DB, Davidson MW:Differential interference contrast (DIC) microscopy and modulation contrast microscopy.Fundamentals of Light Microscopy and Electronic Imaging,Second Edition 2001:173–197. 9. Dodt HU, Zieglgänsberger W:Visualizing unstained neurons in living brain slices by infrared
DIC-videomicroscopy.Brain Res1990,537:333–336.
10. Boyden ES, Zhang F, Bamberg E, Nagel G, Deisseroth K:Millisecond-timescale, genetically targeted optical control of neural activity.Nat Neuroscii2005,8(9):1263–1268.
11. Bay H, Ess A, Tuytelaars T, Gool LV:Speeded-Up Robust Features (SURF).Comput Vis Image Understand2008, 110:346–359.
12. Horikawa K, Yamada Y, Matsuda T, Kobayashi K, Hashimoto M:Spontaneous network activity visualized by ultrasensitive Ca(2+) indicators, yellow Cameleon-Nano.Nat Methdos2010,7:729–732.
13. Hilscher M, Leao KE, Leao RN:Synchronization through nonreciprocal connections in a hybrid hippocampus microcircuit.Front Neural Circ2013,7:120.
14. Viola P, Jones M:Rapid object detection using a boosted cascade of simple features.InProceedings of the 2001 IEEE Computer Society Conference on Computer Vision and Pattern Recognition. CVPR 2001.Volume 1; 2001:511–518. 15. Evans C:Notes on the OpenSURF Library.University of Bristol. Technical Report CSTR-09-001. January; 2009. 16. Neubeck A, Gool LV:Efficient non-maximum suppression.In18th International Conference on Pattern Recognition
(ICPR’06). IEEE 2006.Volume 3; 2006:850–855.
17. Szeliski R:Computer Vision - Algorithms And Applications. New York: Springer; 2010.
19. Russ JC:The Image Processing Handbook, 6th edition. USA: CRC Press; 2011.
20. Stanciu SG, Hristu R, Stanciu GA:Influence of confocal scanning laser microscopy specific acquisition parameters on the detection and matching of speeded-up robust features.Ultramicroscopy2011, 111(5):364–374.
21. Gossow D, Decker P, Paulus D:An evaluation of open source SURF implementations.InRoboCup 2010: Robot Soccer World Cup XIV: Springer Berlin Heidelberg; 2011:169–179.
22. Lowe D:Distinctive image features from scale-invariant keypoints.Int J Comput Vis2004,2:91–110. 23. Borgius L, Restrepo CE, Leao RN, Saleh N, Kiehn O:A transgenic mouse line for molecular genetic analysis of
excitatory glutamatergic neurons.Mol Cell Neurosci2010,45:245–257.
24. Enjin A, Leao KE, Mikulovic S, Merre PL, Tourtellotte WG, Kullander K:Sensorimotor function is modulated by the serotonin receptor 1d, a novel marker for gamma motor neurons.Mol Cell Neurosci2012,49:322–332. 25. Clarke JD:Using fluorescent dyes for fate mapping, lineage analysis, and axon tracing in the chick embryo.
Methods Mol Biol2008,461:351–361.
26. Schiefer J, Kampe K, Dodt HU, Zieglgansberger W, Kreutzberg GW:Microglial motility in the rat facial nucleus following peripheral axotomy.J Neurocytol1999,28:439–453.
27. Davie JT, Kole MH, Letzkus JJ, Rancz EA, Spruston N, Stuart GJ, Hausser M:Dendritic patch-clamp recording.Nat Protoc2006,1:1235–1247.
28. Bartosz G:Oxidative stress in plants.Acta Physiol Plant1997,19:47–64.
29. Foyet CH, Lelandais M, Kunert KJ:Photooxidative stress in plants.Physiol Plant1994,92:696–717. 30. Wright A, Bubb WA, Hawkins CL, Davies MJ:Singlet oxygen-mediated protein oxidation: evidence for the
formation of reactive side chain peroxides of tyrosine residues.Photochem Photobiol2002,76:35–46. 31. Halliwell B, Gutteridge JMC:Free Radicals in Biology and Medicine. Oxford: Claredon Press; 1989.
doi:10.1186/1475-925X-13-78
Cite this article as:Peixotoet al.:Automatic tracking of cells for video microscopy in patch clamp experiments. BioMedical Engineering OnLine201413:78.
Submit your next manuscript to BioMed Central and take full advantage of:
• Convenient online submission
• Thorough peer review
• No space constraints or color figure charges
• Immediate publication on acceptance
• Inclusion in PubMed, CAS, Scopus and Google Scholar
• Research which is freely available for redistribution