R E S E A R C H
Open Access
Visual fatigue caused by watching 3DTV: an fMRI
study
Chunxiao Chen
1*, Jing Wang
1, Kun Li
1, Yuping Liu
2, Xin Chen
2* Correspondence: ccxbme@nuaa. edu.cn
1Department of Biomedical Engineering, Nanjing University of Aeronautics & Astronautics, Nanjing, 210016, China
Abstract
The objective of this study is to observe the visual fatigue caused by watching 3DTV using the method of functional magnetic resonance imaging (fMRI). The data of fMRI during three kinds of visual stimulation tasks were obtained from twenty subjects. At first, blood-oxygen-level dependent (BOLD) signal changes during stimuli of
checkerboard task were compared before and after one-hour watching 3D/2DTV, and subjective evaluation was conducted based on the questionnaire simultaneously. Then 3D and 2D images were used to stimulate healthy individuals to measure brain activities that correlated with stereoscopic vision. Finally, the relationship between front or back depth of field images and visual fatigue was investigated. The results reveal that the 3D group shows more significant differences of brain activities in BA8, BA17, BA18 and BA19 than the 2D group during the checkerboard stimulation. BA5, BA6, BA7 and BA8 were testified to have close relationship with stereoscopic perception via the 2D/3D images stimulation. Furthermore, the front depth of field image was proven to impose a more serious impact on visual fatigue than the back one. These conclusions are useful for healthy and reasonable 3DTV watching as well as properly designing of 3D scenes.
Introduction
Three-dimensional television (3DTV) is perceived as an innovative invention, since this piece of new technology boosts the viewing experience by showing stereoscopic images. Nevertheless, some viewers have experienced a series of physical discomfort after a pro-longed watching of 3DTV, such as severe headache, diplopia and esotropia [1]. Among all of these discomforts, visual fatigue is the most adverse reaction [2]. During the stereo-scopic display, the observer’s left and right eye will receive the 2D offset image separately. These two images will then combine in the observer’s brain to give the perception of 3D depth [3]. The uncoupling of convergence and accommodation that reduces one’s ability to fuse the binocular stimulus is the main cause of visual fatigue. Moreover, serious visual fatigue can lead to changes in fusional vergence limit and its hysteresis, persistent head-aches, muscle pain in the head, neck and upper back, as well as long term problems like myopia [4,5].
Researchers have paid more and more attention on the potential risks to human health brought by watching 3DTV. In reference [6], the visual fatigue was compared between watching high-definition TV and stereo TV with the method of Single-Stimu-lus Continuous Quality Evaluation (SSCQE), and it indicated that the degree of visual fatigue was correlated with the depth of information. However, visual fatigue is an
essentially subjective feeling based on the personal sense [7]. In order to establish the health standard for 3DTV and develop the 3DTV fatigue countermeasure, objective and quantitative evaluation criteria should be built by the physiological signal analysis. Various methods, such as electrooculogram (EOG), electrocardiogram (ECG) and elec-troencephalogram (EEG) have been applied in the recent studies of visual fatigue. In reference [8], EEG was used to detect a typical of P300 by event-related potential (ERP) during watching stereo images. Signal apparently became clear after the stimula-tion of 700 milliseconds, which turned out that there was a correlastimula-tion between visual fatigue and viewing stereo images. In our previous study, the energy of EEG in the four wavebands, namely alpha, beta, theta, delta, and four fatigue related algorithms were compared after watching 2DTV and 3DTV. Combining with the subjective eva-luation, we gave an objective indicator to evaluate the level of fatigue [9]. In recent years, functional magnetic resonance imaging (fMRI) has become a powerful method in brain mapping research due to its non-invasion, non-radiation and high spatial reso-lution [10]. The brain regions activated by specific stimuli can be detected using the blood-oxygen-level dependent (BOLD) contrast. For instance, fMRI demonstrates the association between the feelings of mental fatigue and the BOLD responses by a men-tally fatiguing cognitive task [11]. Gaebler M [12] compares the brain activity of sub-jects when freely watching the same movie in both 2D and 3D, and observes significantly higher intersubject correlations with cortical networks when watching the 3D version. Based on our knowledge, there is no report using fMRI to study the visual fatigue caused by stereoscopic viewing.
In this study, we have investigated the relationship between the visual fatigue and BOLD responses during watching 3DTV. In section 2, checkerboard stimuli and classi-cal block stimuli schemes are illustrated while watching 3D/2DTV. In section 3, sub-jective questionnaire and fMRI response before and after watching 3D/2DTV are given. Finally, the relationship between visual fatigue and BOLD response areas is dis-cussed in section 4, and our preliminary results suggest that prolonged watching of 3DTV could result in more serious visual fatigue than watching 2DTV.
Materials and methods Participants
Experimental design Stimuli of checkerboard
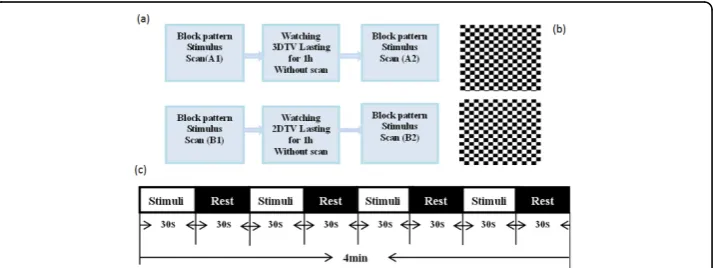
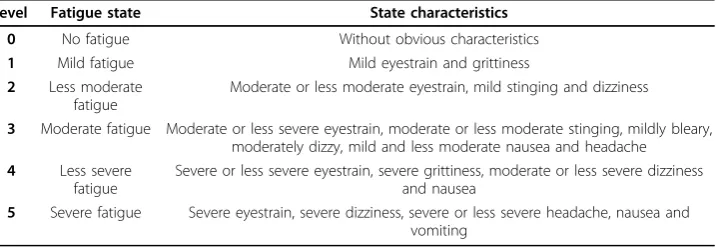
The block design task on checkerboard stimuli is performed before and immediately after watching 2DTV or 3DTV (Figure 1a). Stimulus is black-white checkerboard made by equal-sized squares of black and white colors as showed in Figure 1b. Each small square in the checkerboard changes from white to black and then black to white in 8Hz. The fMRI data are acquired only in the periods of A1, A2, B1 and B2, and no scanning is conducted during the one-hour 2D/3DTV watching. The condition for suc-cessive blocks alternates between blank screen for rest and black-white checkerboard for stimulation (Figure 1c). Each block lasts for 30s and the total presentation time is 4min. Subjective questionnaire form (Table 1) is filled by the participant after scanning A2 and B2 immediately. Table 2 defines the description of each fatigue level. 40 Bold data sets (2D and 3D in total) have been collected from 2D group and 3D group, and the changes of brain activation before and after watching 2D/3DTV are analyzed by comparing A1 and A2 as well as B1 and B2 respectively.
Stimuli of 3D and 2D images
Materials needed: 10 plane images and 20 stereo images, whose depth of field are 1/2 in front of and 1/2 behind the focus point.
In addition to justify the visual fatigue produced by watching 3D images, this pro-gram will also explore the variation of brain activation caused by the depth of field. The scheme of block design is shown in Figure 2. Ten stereoscopic images are dis-played one by one, with each lasting for 3 seconds in part A and the same procedure is applied for 2D-images in part B. In part C, the blank screen stimuli is tested as a benchmark/calibration of the brain activation. There is a 9s-blank stimuli at the begin-ning for preparation, and then three conditions are presented alternately for four times. Therefore, the experiment lasts for 6 min 9s, and 123 acquisitions are obtained. The experiment is repeated twice, one for viewing the stereo images with front depth of the field, and another with back depth of the field.
MRI acquisition and analysis
Participants lay supinely with their head snugly fixed by a belt and foam pads to mini-mize head movement, and no participant had head motion more than 2.0mm. Scans were obtained on GE-HDx 3.0T MR system in Guangdong Province Traditional
Chinese Medical Hospital. T1-weighted structure images of the whole brain were acquired from FLASH scans. TR = 25 ms; TE = 6 ms; flip angle = 30°; FOV = 240 mm × 240 mm; matrix = 256 × 256; slice thickness = 2 mm. Functional images with asym-metric spin-echo EPI were obtained according to the schemes designed before. TR = 3000 ms; TE = 35 ms; FOV = 240 mm × 240 mm; matrix = 64 × 64 × 36; flip angle = 90°; slice thickness = 4 mm; spatial resolution = 4 mm × 4 mm × 4 mm.
Post-processing and statistical analysis of the fMRI data are carried out by Statistical Parametric Mapping (SPM8, Wellcome Department of Cognitive Neurology, London, UK). The“Realignment” in SPM8 is first used to either retrospectively or prospectively compensate for the effects of motion on the image data. In this experiment, all volumes are realigned to the first volume to correct for artifact induced by head move-ment between scans. The functional images are registered to the corresponding T1-weighted structural images, normalized to the MNI standard brain, and smoothed with a Gaussian kernel of full width at half maximum (FWHM) 8 mm.
A general linear model (GLM) approach is applied to analysis of fMRI time-series for indicating where the brain has been activated in response to the stimuli [14]. For each single factor, such as checkerboard stimuli before or after watching TV and stimuli of 2D or 3D images with the front and back depth of field, activation maps are calculated using one sample t-test. Cluster detection is performed and the cluster with its size above 5 is determined to be significantly activated (P < 0.05) [15]. Two sample t-test is then run to compare differences in activation between pre- and post-watching TV, sti-mulation of 2D and 3D images as well as 3D displays with the front depth of field and back depth of field. Activation maps are set by clusters above 10 and the peak activity Table 1 Subjective questionnaire for watching 3DTV
Nothing Mild Less moderate Moderate Less severe Severe
Headache Watery eyes Stinging Bleary Double vision Nausea Grittiness Dizziness Eyestrain Difficult focusing Vomiting
Table 2 Subjective fatigue evaluation
level Fatigue state State characteristics
0 No fatigue Without obvious characteristics
1 Mild fatigue Mild eyestrain and grittiness
2 Less moderate fatigue
Moderate or less moderate eyestrain, mild stinging and dizziness
3 Moderate fatigue Moderate or less severe eyestrain, moderate or less moderate stinging, mildly bleary, moderately dizzy, mild and less moderate nausea and headache
4 Less severe fatigue
Severe or less severe eyestrain, severe grittiness, moderate or less severe dizziness and nausea
of P < 0.01 [16]. The anatomical labels of brain activations and their corresponding Brodmann Areas (BA) are found using MNI standard brain.
Results
Subjective analysis
Based on the subjective questionnaire in Table 1 fatigue evaluation was conducted according to the criteria shown in Table 2. The comparison of subjective fatigue level between 2D and 3D groups are shown in Figure 3. Obviously, compared with the 2D group, the mean value of the subjective fatigue level is significantly larger in the 3D group, indicating that continuous watching of 3DTV will lead to more serious visual fatigue.
Neuron activity
According to different experimental purposes, three studies have been analyzed as the following: 1) checkerboard stimulus performance before and after watching 3D/2DTV;
Figure 2Illustration of 3D and 2D images stimulus.
2) differences of activation between watching 3D and 2D images; 3) differences of acti-vation between watching front depth of field 3D images and back depth of field 3D images.
Checkerboard stimulus performance before and after watching 3D/2D TV
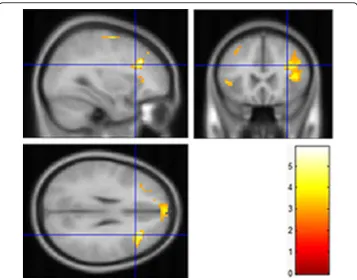
The differences of activated regions obtained by checkerboard stimulus pre- and post-watching 3D/2DTV are mapped using two sample t-test. Compared to 2DTV group, the 3DTV group’s result reveals statistically significant differences in frontal and subcu-taneous besides temporal, parietal, occipital, limbic lobe. The 3D group results are shown in Figure 4a and Table 3 where R and L represent right hemisphere and left
Figure 4Differences of activation caused by checkerboard stimulus between pre- and post-watching TV. (a) watching 3DTV; (b) watching 2DTV.
Table 3 Location of peak activation analysis of watching 3DTV
Activation site(L/R) MNI coordinate (mm) BA K t value
x y z
temporal lobe gyrus temporalis medius (R) 42 6 -27 38 21 7.4
gyrus temporalis superior (R) 54 9 -18 38 105 4.33
gyrus temporalis superior (L) -36 9 -21 38 72 4.91
parietal lobule precuneus (L) -6 -42 45 18/19 331 6.78
inferior parietal lobule (L) -57 -45 21 40 39 6.65
supramarginal gyrus (L) -63 -51 27 40 42 4.29
frontal lobe superior frontal gyrus (L) -15 42 33 8/9 77 4.19
superior frontal gyrus (R) 3 24 57 17 4.17
middle frontal gyrus (L) -30 33 30 8/9 109 5.04
middle frontal gyrus (R) 42 45 15 32 5.24
gyrus frontalis inferior (R) 38 11 -18 47 33 4.33
cuneus (L) -12 -75 9 17/18/23 48 3.36
cuneus (R) 12 -87 21 18/19 22 3.82
Subcutaneous caudate nucleus (R) 6 6 3 31 3.79
lobus insularis (R) 45 -18 12 13 27 5.15
temporal lobe anterior cingutate (L) -6 21 21 24/32 396 5.54
gyrus cinguli (R) 9 -45 42 23/29/30/31 147 6.43
parahippocampal gyrus (L) -24 -33 -15 15 3.37
hemisphere individually. BA is a region in the brain cortex defined in many species based on its cytoarchitecture. K is the number of activated voxels. 2D group results are shown in Figure 4b and Table 4. From Table 3 and Table 4 the obvious differences exist in BA8, BA17, BA18, BA 19, BA32 and BA40. The phenomena imply that more functional areas of brain are involved to view 3D scenes than that of 2D scenes. As expected, checkerboard inductive stimulus have caused significant differences in visual cortex (BA17 and BA18) both in 2D group and 3D group, but the change of activated area in 3D group is greater than that of 2D group.
Differences of activation between watching 3D and 2D images
Brain activation indicated the differences between watching 3D and 2D images in Figure 5 and Table 5. Compared to the stimuli task of 2D images, 3D images task have presented more significant relative activation in frontal lobe, limbic lobe as well as par-ietal lobe (p < 0.01). Specifically, there are stronger activations in superior frontal gyrus (R: 12, 48, 42, L: -21, 21, 57), middle frontal gyrus (L: -45, 18, 48, R: 24, 12, 48),
Table 4 Location of peak activation analysis of watching 2DTV
Activation site(L/R) MNI coordinate (mm) BA K t value
x y z
occipital lobe Inferior occipital gyrus(R) 33 -90 -9 18 32 3.17
lingual gyrus(L) -15 -90 -9 17/18 12 2.18
cuneus(L) -15 -99 -3 17 5 1.95
parietal lobe inferior parietal lobule(L) -54 -48 48 40 25 2.78
limbic lobe anterior cingulate cortex(L) 0 21 21 32 13 2.22
temporal lobe superior temporal gyrus(L) -66 -36 18 40/42 13 2.27
Note: cluster size = 10,p< 0.01, uncorrected.
cingulate gyrus (R:15, -39, 21), precentral gyrus (L: 0, -48, 33, R: 30, -15, 54), postcen-tral gyrus (L: -18, -42, 63, R: 21, -36, 60), superior parietal lobule (L: -18, -51, 60, R: 24, -51, 63), inferior parietal lobule (L: -33, -45, 60) thalamus(12, -15, 9) and dorsome-dial nucleus (-6, -15, 9). Moreover, in terms of brain function, these regions mainly include general sensory area (BA3), somatosensory cortex (BA5, BA7), premotor cortex (BA6, BA8), frontal association cortex (BA19) and posterior cingulate cortex (BA31). This experiment demonstrates the relationship between the human brain activity and the stereoscopic stimulus.
Activated differences on the depth of field in front of and behind the focus point
In order to further investigate different effects of the depth of field front and behind the focus point on visual fatigue, the task of different image pattern were analyzed. And the results are revealed in Figure 6 and Table 6. Compared to the back depth of field task, the front depth of field task has shown greater activation in superior frontal gyrus (L: -30, 9, 60, BA8/9), middle frontal gyrus (L: -42, 9, 54, BA6/8/10, R: 39, 30, 33, BA6/8/9), inferior frontal gyrus (R: 45, 6, 33, L: -45, 21, 3), cingulate sulcus (R: 9, 9, 39, BA24/32, L: -3, 9, 39, BA24) as well as precuneus (R: 6, -54, 54, BA7). Thus it can add weight to the ideas that 3D display makes contributions to visual fatigue, and the front depth of field has more profound influences on visual fatigue.
Discussion
As we know, there are significant increases in oxyhemoglobin and deoxyhemoglobin while watching TV. This should be attributed to the increase of cerebral blood flow (CBF) in response to the brain’s energy demands. When the brain is activated in response to a visual task, the global CBF increases [17]. Conversely, when the meta-bolic rate became lower, such as under the mental fatigue, CBF decreases [18]. This is based on the fact that tissue ischemia increases the oxygen consumption, and thereby decreasing the venous oxyhemoglobin. Meanwhile, the decrease of venous oxyhemo-globin will lead to the reduction of BOLD signal.
Table 5 The more strongly activated sites produced by watching 3D images compared to 2D images.
Activation site(L/R) MNI coordinate (mm) BA K t value
x y z
frontal lobe superior frontal gyrus (R) 12 48 42 8/9 161 5.78
middle frontal gyrus (R) 24 18 48 8/9 292 5.34
middle frontal gyrus (L) -45 12 48 6/8 102 4.33
superior frontal gyrus (L) -21 21 57 8 30 3.86
limbic lobe cingulate gyrus (R) 15 -39 21 31 136 5.45
central gyrus precentral gyrus (L) 0 -48 33 31 23 3.99
precentral gyrus (R) 30 -15 54 6/7 72 4.08
postcentral gyrus (L) -18 -42 63 3/5 68 4.93
postcentral gyrus (R) 21 -36 60 3/4 70 3.81
parietal lobule superior parietal lobule (L) -18 -51 60 5/7 12 4.82 inferior parietal lobule (L) -33 -45 60 40 21 3.99
superior parietal lobule (R) 24 -51 63 5/7 15 4.58
Subcutaneous thalamus (L/R) 12 -15 9 94 4.28
dorsomedial nucleus (L/R) -6 -15 9 36 4.13
Visual fatigue induced by the conflict between accommodation and convergence has already been reported in previous studies [19,20]. Based on the results of checkerboard stimulus performance before and after watching 3DTV or 2DTV, it has been testified that long time 3DTV watching will produce significant effects on brain function when subjects are required to process visual information in different depth. Compared directly to 2D group, the 3D group has shown more significant differences of brain activation, especially in BA8, BA17, BA18, BA19, BA32 and BA40. In these regions, activations of the visual cortices (BA17, BA18 and BA19) are associated with visual search [21]. Benjamin Backus et al. [22] have testified that occipital lobe (V3A, BA19) and parietal lobe (MT+, BA19) are sensitive to binocular disparity by fMRI experi-ments. There are obvious differences in occipital lobe (V3A, BA19) for stereoscopic
Table 6 The more strongly activated sites produced by watching front depth of field images compared to that of the back one
Activation site(L/R) MNI coordinate (mm) BA K t value
x y z
frontal lobe middle frontal gyrus (L) -42 9 54 6/8/10 138 5.87
superior frontal gyrus (L) -30 9 60 8/9 80 5.74
middle frontal gyrus (R) 39 30 33 6/8/9 111 4.84
gyrus frontalis inferior (R) 45 6 33 6 3.12
gyrus frontalis inferior (L) -45 21 33 34 3.65
anterior central gyrus (R) 36 -18 58 20 3.28
limbic lobe gyrus cinguli (R) 9 9 39 24/32 17 3.87
gyrus cinguli (L) -3 9 39 24 10 2.78
parietal lobe precuneus (R) 6 -54 54 7 12 3.52
Note: cluster size = 10,p< 0.01, uncorrected.
task between macaque monkeys and human [23]. Beackus [22] has reported that BA19 (V3) is very sensitive to binocular vision disparity, and intimated with visual fatigue. Our research also demonstrates that there are huge differences in BA8, BA 17, BA18 and BA19. Other regions such as BA32 and BA40 indirectly associated with visual sense will not be discussed here. The changes of activated areas induced by checker-board stimulus between pre- and post- 3DTV watching can be attributed to the fact that neuron activities are inhibited when the fatigue is increasing. After 1-hour watch-ing, the level of excitement of checkerboard stimulus in 3D group is weaker than in 2D group. In consequence, the prolonged watching of 3DTV leads to more changes of activated areas than 2D group, which can be used to reflect the level of visual fatigue. In short, the response signals in BA8, BA17, BA18 and BA19 can be considered as main indicators to visual fatigue caused by watching 3DTV.
The frontal eye field (FEF, BA8) was confirmed to not only participate in eye movement, but also relate with stereoscopic depth perception [23]. From the result of activated differ-ences between viewing 3D and 2D images, it has been testified that the premotor cortex (BA6 and BA8) has disparities because 3DTV displays a frame of video for the left eye and a frame of video for the right eye alternatively to form the stereoscopic impression. This lasting activation of BA8 is one of the reasons that watching 3DTV produces visual fati-gue. Besides, the somatosensory cortex (BA5 and BA7) combining visual and movement information is responsible for the visual-movement coordination function in the brain. The results of this task performance imply that BA5, BA6, BA7 and BA8 are directly related to stereoscopic perception. Additionally, significant differences of activation have also been observed in general sensory area (BA3), frontal association cortex (BA9), and posterior cingulate cortex (BA31). These areas are in charge of sensory stimulation, mem-ory and recognition capability respectively. Therefore, the BOLD signals in these areas can be used to report the level of mental fatigue occurred by prolonged watching of 3DTV, in which BA8 is directly related with vision.
While performing different depth of field stereoscopic image task, the result has shown that there are significant differences of brain activations in BA6, BA7 and BA8 between watching front depth field images and back depth of field images, especially in BA8. So, the front depth of field image could impose a more serious impact on visual fatigue than the back one.
Conclusion
This study has investigated the relationship between human brain activity and visual fatigue induced by long time watching of 3DTV. The results are useful for healthy and reasonable 3DTV watching as well as properly designing of 3D scenes.
Although some valuable findings have been obtained, there are still several limita-tions in this study. After assuring that the experiment will not cause irreversible damage, especially for children whose visual system have not fully developed, more kinds of subjects should be selected to evaluate the visual fatigue brought by 3DTV watching. Additionally, some other physiological signals, such as EEG and EOG are needed to provide references along with fMRI acquisitions in the future.
Competing interests
Authors’contributions
C Chen is responsible for the experimental design and overall investigation, K Li, Y Liu and X Chen are responsible for doing experiments, including subjects recruitment and data collection. J Wang and K Li are responsible for statistical data analysis. All authors 1) have made substantial contributions to conception and design, or acquisition of data, or analysis and interpretation of data; 2) have been involved in drafting the manuscript or revising it critically for important intellectual content; and 3) have given final approval of the version to be published. Each author has participated sufficiently in the work to take public responsibility for appropriate portions of the content.
Authors’information
C Chen’group has been doing research in the field of biomedical signal processing, and has published more than 40 papers in recent years.
Y Liu and X Chen are clinicians and have been working in the department of radiology for many years. They have rich experiences in terms of medical imaging analysis.
Acknowledgements
I would like to express my gratitude to Jianhai Lin who helped me during the analysis of fMRI data.
Declarations
Publication of this article was paid with funding from National Natural Science Foundation of China (Grant No. 61171059).
This article has been published as part ofBioMedical Engineering OnLineVolume 14 Supplement 1, 2015:
Cardiovascular Disease and Vulnerable Plaque Biomechanics. The full contents of the supplement are available online at http://www.biomedical-engineering-online.com/supplements/14/S1
Authors’details
1Department of Biomedical Engineering, Nanjing University of Aeronautics & Astronautics, Nanjing, 210016, China. 2Department of Radiology, Guangdong Province Traditional Chinese Medical Hospital, Guangzhou, 510006, China.
Published: 9 January 2015
References
1. Bando T, Iijima A, Yano S:Visual fatigue caused by stereoscopic images and the search for the requirement to prevent them: A review [J].Displays2012,33(2):76-83.
2. Lambooij M, Fortuin M, Heynderickx I,et al:Visual discomfort and visual fatigue of stereoscopic displays: a review [J].Journal of Imaging Science and Technology2009,53(3):30201-1.
3. Sakata H, Tsutsui KI, Taira M:Toward an understanding of the neural processing for 3D shape perception [J]. Neuropsychologia2005,43(2):151-161.
4. Kooi FL, Toet A:Visual comfort of binocular and 3D displays [J].Displays2004,25(2):99-108.
5. Emoto M, Nojiri Y, Okano F:Changes in fusional vergence limit and its hysteresis after viewing stereoscopic TV [J]. Displays2004,25(2):67-76.
6. Yano S, Ide S, Mitsuhashi T,et al:A study of visual fatigue and visual comfort for 3D HDTV/ HDTV images [J]. Displays2002,23(4):191-201.
7. Kuze J, Ukai K:Subjective evaluation of visual fatigue caused by motion images [J].Displays2008,29(2):159-166. 8. Li HCO, Seo J, Kham K,et al:Measurement of 3D visual fatigue using event-related potential (ERP): 3D oddball
paradigm [C]// 3DTV Conference: The True Vision-Capture, Display and Transmission of 3D Video, 2008.IEEE2008, 213-216.
9. Chen C, Li K, Wu Q,et al:EEG-based Detection and Evaluation of Fatigue Caused by Watching 3DTV[J].Displays
2013,34(2):81-88.
10. Irene K:Functional Brain Imaging Using Non-Invasive Non-Ionizing Methods: Towards Multimodal and Multiscale Imaging.InNeuroimaging - MethodsProf Peter Bright , ISBN: 978-953-51-0097-3, InTech.2012.
11. Cook DB, O’Connor PJ, Lange G,et al:Functional neuroimaging correlates of mental fatigue induced by cognition among chronic fatigue syndrome patients and controls [J].Neuroimage2007,36(1):108-122.
12. Gaebler M, amm F, Lamke JP,et al:Stereoscopic depth increases intersubject correlations of brain networks [J]. Neuroimage2014,100:427-434, In Progress, 15 October.
13. Craigab A, Hancocka K, Craiga M:The lifestyle appraisal questionnaire: A comprehensive assessment of health and stress.Psychology & Health1996,11(3):331-343.
14. Woolrich MW, Ripley BD, Brady M,et al:Temporal autocorrelation in univariate linear modeling of FMRI data[J]. Neuroimage2001,14(6):1370-1386.
15. Poline JB, Worsley KJ, Evans AC,et al:Combining spatial extent and peak intensity to test for activations in functional imaging[J].Neuroimage1997,5(2):83-96.
16. Tartaglia MC, Narayanan S, Arnold DL:Mental fatigue alters the pattern and increases the volume of cerebral activation required for a motor task in multiple sclerosis patients with fatigue[J].European Journal of Neurology
2008,15(4):413-419.
17. Masaaki T, Norihiro S, Tomohisa O,et al:Reduced responsiveness is an essential feature of chronic fatigue syndrome: A fMRI study.BMC Neurology2006,6(9):1-15.
18. Madsen PL, Hasselbalch SG, Hagemann LP, Olsen KS,et al:Persistent resetting of the cerebral oxygen/glucose uptake ratio by brain activation: evidence obtained with the Kety-Schmidt technique.J Cereb Blood Flow Metab1995, 15(3):485-491.
20. Hiruma N, Fukuda T:Accommodation response to binocular stereoscopic TV images and their viewing conditions. SMPTE Journal1993,102(12)::1137-1144.
21. Ukai K, Howarth PA:Visual fatigue caused by viewing stereoscopic motion images: Background, theories, and observations [J].Displays2008,29(2):106-116.
22. Backus BT, Fleet DJ, Parker AJ,et al:Human cortical activity correlates with stereoscopic depth perception[J].Journal of Neurophysiology2001,86(4):2054-2068.
23. Kim D, Jung YJ, Kim E, Ro YM, Park HW:Human brain response to visual fatigue caused by stereoscopic depth perception.Digital Signal Processing (DSP), 2011 17th International Conference on July 20111-5.
doi:10.1186/1475-925X-14-S1-S12
Cite this article as:Chenet al.:Visual fatigue caused by watching 3DTV: an fMRI study.BioMedical Engineering OnLine201514(Suppl 1):S12.
Submit your next manuscript to BioMed Central and take full advantage of:
• Convenient online submission
• Thorough peer review
• No space constraints or color figure charges
• Immediate publication on acceptance
• Inclusion in PubMed, CAS, Scopus and Google Scholar
• Research which is freely available for redistribution