CIOB Construction Conference 2012
1
M
ONETARY
R
ETENTIONS FOR
S
UBCONTRACT
W
ORK
:
A
R
ISK
-
BASED
A
PPROACH
Vasantha Abeysekera
*Faculty of Engineering and Surveying, University of Southern Queensland, Australia
and
Mohantha Soysa
Costpro Limited - Construction Cost Consultants, New Zealand
*
CIOB Construction Conference 2012
2
M
ONETARY
R
ETENTIONS FOR
S
UBCONTRACT
W
ORK
:
A
R
ISK
-
BASED
A
PPROACH
ABSTRACT
The subcontracting culture in New Zealand is such that the same retention regime imposed on contractors is imposed on subcontractors by and large. This paradoxically fair contractual practice of back-to-back terms results in high retention rates (10%) and long defects liability periods set from contractor’s practical completion which has caused concerns for subcontractors with no rational basis for resolving such concerns. This study investigates this phenomenon from a risk based perspective to understand the link between risk and retentions particularly in relation to current practice. Accordingly, it is found that current retention rates do not show an association with overall risk computed as a product of likelihood and consequence based on contractors’ perceptions. However, when risk is viewed through these two components, it is seen that trades with high default risks for either likelihood or consequence results in high retention rates. Additionally, it is also seen that high risk is associated with subcontractor-harsh retention regimes with some exceptions lowering the strength of this association suggesting the need to investigate such trades to understand whether there are other overwhelming reasons for such exceptions. Thus, it is concluded that risk and retention regimes are linked to this extent although for a given level of risk, subcontractor friendly or unfriendly regimes could be achieved by a mix of different retention rates and release mechanisms. In this regard, it is seen that contractors seem to prefer high retention rates than longer defects liability periods for trades which have high risk levels. A further understanding about this relationship could be developed by undertaking a study on perceived overall risk levels and perceived retention regimes.
Keywords: contracting culture, defects liability period, retentions, retainage, subcontracting
1.0
I
NTRODUCTIONThe practice of retaining a percentage of money from payments due to a subcontractor is not new. During the last few decades, subcontractors have from time to time raised their concerns about this practice particularly with regard to rates, release mechanisms, and abuse. Given the freedom to contract, the practice continues, without much differentiation with most subcontractors being treated alike irrespective of whether their performance or the type of work they do.
Retentions have been labelled as a wasteful practice (Latham, 1994, 1997). Yet, it continues to be used in formal construction. Interestingly, it is a practice that could be used by main contractors to generate a positive cash flow without having to seek funds from commercial banks using what Abeysekera (2006) has labelled as the retention differentiation strategy. From time to time, a number of authors have pointed out the beastly nature of retentions suggesting solutions such as retention bonds, trust accounts, retention-based funds, and through legislative arrangements (Abeysekera, 2003, 2005, 2008; Pearman, 2004; Robinson, 2002) which are often not readily available to subcontractors. Moreover, practices vary world over with different rates and release mechanisms.
Given this background, this study pursues a greater understanding of ways and means of dealing with retentions by attempting understand the nature of risk-retention relationship.
CIOB Construction Conference 2012
3
2.0
CONTRACTING
CULTURE
IN
NEW
ZEALAND
Most of the building construction work in New Zealand is outsourced particularly in the formal construction sector. This includes the supply of materials like pre-cast concrete products and also work that involves a component of labour with or without materials. It is for such types of work that retentions seem to be applied which raises fundamental questions on the purpose of retentions which almost all standard-form contracts have failed to define (Abeysekera, 2012) whether it is in work contracted by clients or work undertaken by subcontractors. Given that subcontracting is common and there is no indication that it will change in the near future, sometimes with almost 85% of the work subcontracted particularly in large building projects, this practice of handing work to teams specialising in various types of work needs greater attention for construction to be managed efficiently.
One common feature of such work is that imposition of retentions particularly in the formal construction sector imposing back-to-back contract terms on subcontractors meaning that quite often the same retention regime is applied to subcontractors (Abeysekera, 2012). Prima-facie this seems fair and reasonable. However, given that main contractor’s get their retentions released partly on practical completion and the rest at the end of the defects liability period, it is not surprising that subcontractors have a genuine cause for concern if and when such regimes are applied.
Interestingly, New Zealand employs a sliding retention regime in most projects (Abeysekera, 2006) with a retention rate of a high of 10% with progress claims up to NZ $ 200,000 with the percentage of deduction declining as the size of the subcontract package becomes bigger with an effective rate of around of 1.75% when the value of the work reaches $8 million whilst capping retentions at this level (i.e. no retentions once this turnover is achieved). Of course, with larger projects, the retentions used are different (see, Abeysekera, 2008). Nevertheless, the sliding retention regime is used frequently as noted above. In order to maximise retentions, some main contractors deliberately limit the monetary value of subcontract work packages to $ 200,000 so that the retention rate of 10% could be held! Although main contractors circumvent retention deductions by providing a retention-bond to clients, such facilities do not seem to be available to subcontractors. Even if it was the case, subcontractors may not wish to provide bonds as it costs money to get a bank guarantee but more importantly submission of bank bonds and guarantees tie up capital and erode lines of credit. It is also worth noting that it is rare for subcontractors to provide non-bank securities (say a guarantee from an insurance company) or for that matter performance or retention bonds. Accordingly, employing back-to-back contract terms do not seem to have manifested as a subcontractor-friendly option in New Zealand. Is subcontracting really risky…?
As noted before, subcontracting is common in New Zealand. Specialisation has advantages: when work is handled by small groups there is greater opportunity for work to be done right-the-first-time, on time, to specifications, and as per other contractual obligations and other benefits that come from similarity and familiarity of work. However, experience shows that this is not necessarily the case and subcontracting seems risky as not all subcontractors discharge their contractual and other duties diligently for one reason or the other despite years of experience and expertise of performing similar work!
CIOB Construction Conference 2012
4
3.0
RISK
AND
RETENTIONS
What types and levels of risks do contractors’ face when contracting subcontractors? It can be stated that a main contractor carries three primary risks:
Subcontractor will default; Misunderstandings due to the extent of work the subcontractor has priced and what the main contractor expected.
Subcontractor cannot perform and/or at the rate required;
In other words, a subcontractor having started could abandon the job altogether. The project could suffer due to delayed completions, quality problems (including repeat work and defects detected upon work completion), health and safety issues, non-compliance with the laws of the land, etc. Moreover, performance could also be hampered by pricing issues arising from the anticipated and perceived scope of work being different with the subcontractor which may lead to claims for extra work done or claiming for more work than what has been performed.
On the one hand if the main contractor chooses a subcontractor with mediocre skills of performance, one could argue that the responsibility should lie fairly and squarely with the main contractor. For example, the main contractor could intentionally select a subcontractor, whose quality of work is not excellent, at a cheaper price, taking upon themselves to rectify any defects. On the other hand, ground realities may be such that contractors may not have a choice given that there is a shortage of skilled subcontractors. Even if this is not the case, what if the selected subcontractor does not provide its best team to the job? What if the subcontractor having completed the work seemingly well does not return back to fix a latent defect? What if the main contractor overpays a subcontractor for one reason or the other? There is no doubt of the risks that prevail.
Main contractors may choose to accept such risks or transfer these to other parties depending on who is best suited to manage the risk. On the other hand, irrespective of who is best suited, the main contractor may choose to accept the risk for a reward (e.g. a cheaper price resulting in lower costs and greater profits) but in doing so minimise any risks by adopting other strategies, for example, by providing better supervision, seeking performance bonds, or even retaining a percentage from payments due to a subcontractor. However, what seems to occur in practice is that all subcontractors are treated alike when back-to-back contract terms are applied irrespective of their performance history, the type of work undertaken, or their risk profile (Abeysekera, 2012).
Does risk really play a role in retention rates imposed on subcontractors…? Do some trades carry more risk than other trades? Are some subcontractors riskier than others? Does a high retention rate of 10% provide a safety net against adverse consequences? Is it a blanket response? These are some questions that need to be answered to understand the risk-retention mechanism in order to develop a lasting solution to ‘retention’ concerns of subcontractors.
4.0
A
METHODOLOGY
FOR
UNDERSTANDING
THE
RISK-RETENTION
RELATIONSHIP
Given the above background, the main purpose of this study is to develop a methodology for understanding the risk-retention relationship for which purpose, it is necessary to:
understand current practice
assess level of risk of the selected building trades assess level of risk in relation and retention regime
CIOB Construction Conference 2012
5 Selection of trades:
Given that there is extensive subcontracting as noted before, it would be necessary to consider all building trades, and the trades listed in the Standard Method of Measurement of Building Works (NZS4202:1995) was used for this purpose. As there were over 35 trades, it was decided to narrow down the number to a manageable proportion focussing on typically subcontracted trades which are shown in Table 1. In all 22 trades were selected.
Sample selection:
One of the characteristics of the New Zealand construction industry is that there are only a handful of contractors who handle large scale construction work. They are well known and occupy an envious position in construction industry with each of these companies employing a large volume of subcontractors often influencing how the rest of the construction industry engages with subcontractors. All such companies operate in all the main cities with Auckland being the most populous city in New Zealand and perhaps the city with the highest volume of commercial construction work. Thus, the companies were selected from Auckland. The study focussed on these large and medium-scale construction companies and a number of construction companies were approached with 10 companies agreeing to participate in this study.
Data was collected through face to face interviews mainly as a strategy to ensure that all these companies participated. It was seen necessary to select interviewees who had the authority to fix retention regimes and who had a good understanding of the implementation of such regimes. Pursuant to a desk-top survey, it was established that the chief quantity surveyor was the best person to be interviewed.
Data collection
In order to achieve sub-objectives (noted at the beginning of this section), data were collected using two score cards, one for current practice, and the other for level of risk indicating whether the likelihood and consequence was high, medium, or low whilst keeping in mind the do’s and don’ts when conducting such interviews.
To assess the level of risk for the selected trades, interviewees were questioned on the likelihood and consequences of a performance default when working with an ‘average’ subcontractor. A qualitative scale of ‘high-medium-low’ with three responses was used for assessing likelihood and consequence (AS4360:1999). When assessing overall risk in relation to a retention regime, the same qualitative scale was used.
Data analysis
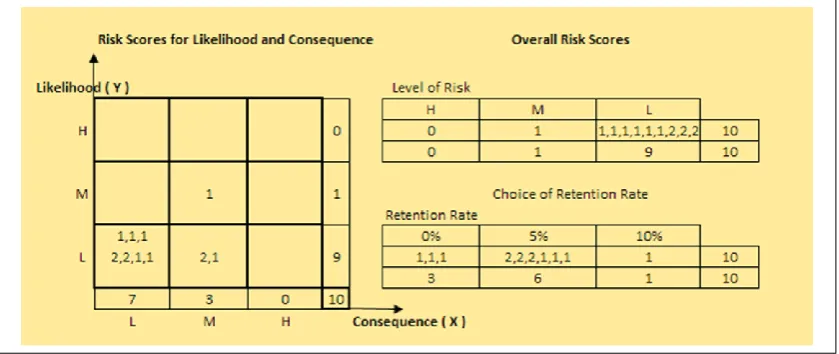
Qualitative data related to current practice was tabulated as shown in Fig. 1 and a composite retention rate was calculated as follow (see Fig 1 for data). This was repeated for the selected trades (22 in all):
Current Composite Retention Rate = (4 x 0% + 1 x 5% + 5 x 10% x 0 x 15% + 0 x 20%)/10 = 5.5%
CIOB Construction Conference 2012
[image:6.595.73.519.89.214.2]6
Fig. 1: Current practice for Demolition Trade
As mentioned before, levels of risks for different trades were assessed through a qualitative approach using high, medium, and low to assess performance default risk. Data so obtained was transferred to a matrix form with livelihood and consequence as axes (Fig. 2). Notations ‘1’ and ‘2’ were used for depicting the responses of medium-scale and large-scale contractors respectively. These responses were converted to numeric data by assigning values for high, medium, low risk as 2.5, 1.5 and 0.5 mainly as a means of comparing risks across trades than as an absolute measure of risk. The relative proportions could have been taken as 3, 2 and 1 as well or any other but in this case, distance (along the axes) to the centre of box (square) depicting a level of risk was taken as the relative weights. Data in Fig. 1 shows responses from 10 contractors consisting of 3 large scale contractors (note as ‘2’) and 7 medium scale contractors (noted as ‘1’). Accordingly, the average overall likelihood score and consequence would be as follows noting that the maximum score possible is 2.5:
Fig. 2: Tabulated data for Demolition Trade
Average Overall Likelihood (L) Score = (0 x 2.5 + 1 x 1.5 + 9 x 0.5)/10 = 0.6 Average Overall Consequence (C) Score = (0 x 2.5 + 3 x 1.5 + 7 x 0.5)/10 = 0.8
Data so converted for likelihood and consequence was multiplied to arrive at an overall risk for a particular trade as noted below:
Risk= k x La x Cb (HB436, 2004) with
‘k’ (a constant), ‘a’ and ‘b’ as powers of L and C being taken as 1. Accordingly,
[image:6.595.87.507.398.575.2]CIOB Construction Conference 2012
7
These scores relate to the second objective. It is useful at this stage to review what these mean noting that these are not absolute scores of risk. However, in comparison with the maximum score of 2.5 for L and C, the scores of 0.6 and 0.8 indicate a low performance default. Similarly, as the overall score is only 0.5 when compared with a maxim of 6.5 (2.5 x 2.5), the potential for a performance default of this trade can be concluded to be low.
Ideally, a third measure is required, i.e. an overall measure of risk as perceived by the contractors in relation to the rate and the release mechanisms they wish to apply taking risk as the main criterion (quite apart from market and other considerations). This would have been useful for validating the product measure of risk (i.e. L x C) which is not discussed in this study.
Results so computed were analysed to ascertain whether practices of large and medium scale contractors were different with respect to building trades. Additionally, trades were classified into three categories, viz. front-end trades, mid-trades, and end-trades (see Table 1) to examine whether these broad categories of trades were treated differently by main contractors.
5.0
CURRENT
RETENTION
PRACTICES
IN
SUBCONTRACTING
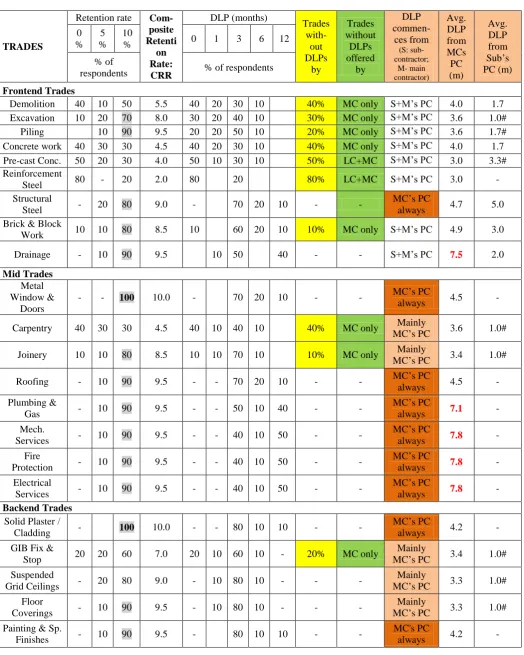
In order to describe current practice, there is a need for a number of indicators as a cursory examination of theories on retentions would provide (Abeysekera, 2008). However, in this study, this has been limited to indicators for retention regimes only. These indicators shown in Table 1 present a rich picture giving a first time understanding on existing practices in the New Zealand building industry.
Results show that two trades, namely, Metal Windows and Doors, and Solid Plaster/Cladding are significant in that all respondents stated that they hold 10% as retentions. Interestingly, there were another 12 trades with this high retention rate (see shaded values in Table 1) where over 80% of the respondents claimed usage. Excavation was another trade that had a high retention rate with a composite retention rate higher than 8%. Approximately 2/3rds of the trades fell within the above mentioned characteristics. Furthermore, defects liability period for these trades were computed mainly from contractor’s practical completion (PC) and not from SC’ PC with the exception of four trades, namely, Excavation, Piling, Drainage, and Brick/Blockwork where some contractors opted for setting DLPs from subcontractor’s PC. Interestingly, these exceptions were all frontend trades (see comment about backend trades and DLPs later). In essence, this amounts to the use of back-to-back contract terms with the exception of DLPs which is seen to be the most unfavourable/harshest retention regime for subcontractors. However, not all trades attract retentions: One such trade is Reinforcement Steel where 80% of the contractors did not claim to hold retentions. The others that followed closely are Precast Concrete (50%), Demolition (40%), Concrete Work (40%) and Excavations (30%) with such favourable retention regimes provided mainly by medium scale contractors and not by large scale contractors (Table 1). As to why this is so needs more investigation and has not been undertaken in this study.
CIOB Construction Conference 2012
[image:8.595.38.563.87.743.2]8
Table 1: Current Practice in relation to elements defining a retention regime
TRADES
Retention rate
Com-posite Retenti on Rate: CRR DLP (months) Trades with-out DLPs by Trades without DLPs offered by DLP commen-ces from (S: sub-contractor; M- main contractor) Avg. DLP from MCs PC (m) Avg. DLP from Sub’s PC (m) 0 % 5 % 10
% 0 1 3 6 12
% of
respondents % of respondents
Frontend Trades
Demolition 40 10 50 5.5 40 20 30 10 40% MC only S+M’s PC 4.0 1.7
Excavation 10 20 70 8.0 30 20 40 10 30% MC only S+M’s PC 3.6 1.0#
Piling 10 90 9.5 20 20 50 10 20% MC only S+M’s PC 3.6 1.7#
Concrete work 40 30 30 4.5 40 20 30 10 40% MC only S+M’s PC 4.0 1.7
Pre-cast Conc. 50 20 30 4.0 50 10 30 10 50% LC+MC S+M’s PC 3.0 3.3#
Reinforcement
Steel 80 - 20 2.0 80 20 80% LC+MC S+M’s PC 3.0 -
Structural
Steel - 20 80 9.0 - 70 20 10 - -
MC’s PC
always 4.7 5.0
Brick & Block
Work 10 10 80 8.5 10 60 20 10 10% MC only S+M’s PC 4.9 3.0
Drainage - 10 90 9.5 10 50 40 - - S+M’s PC 7.5 2.0
Mid Trades Metal Window &
Doors
- - 100 10.0 - 70 20 10 - - MC’s PC
always 4.5 -
Carpentry 40 30 30 4.5 40 10 40 10 40% MC only Mainly
MC’s PC 3.6 1.0#
Joinery 10 10 80 8.5 10 10 70 10 10% MC only Mainly
MC’s PC 3.4 1.0#
Roofing - 10 90 9.5 - - 70 20 10 - - MC’s PC
always 4.5 -
Plumbing &
Gas - 10 90 9.5 - - 50 10 40 - -
MC’s PC
always 7.1 -
Mech.
Services - 10 90 9.5 - - 40 10 50 - -
MC’s PC
always 7.8 -
Fire
Protection - 10 90 9.5 - - 40 10 50 - -
MC’s PC
always 7.8 -
Electrical
Services - 10 90 9.5 - - 40 10 50 - -
MC’s PC
always 7.8 -
Backend Trades Solid Plaster /
Cladding - 100 10.0 - - 80 10 10 - -
MC’s PC
always 4.2 -
GIB Fix &
Stop 20 20 60 7.0 20 10 60 10 - 20% MC only
Mainly
MC’s PC 3.4 1.0#
Suspended
Grid Ceilings - 20 80 9.0 - 10 80 10 - - -
Mainly
MC’s PC 3.3 1.0#
Floor
Coverings - 10 90 9.5 - 10 80 10 - - -
Mainly
MC’s PC 3.3 1.0#
Painting & Sp.
Finishes - 10 90 9.5 - 80 10 10 - -
MC's PC
CIOB Construction Conference 2012
[image:9.595.65.529.87.442.2]9
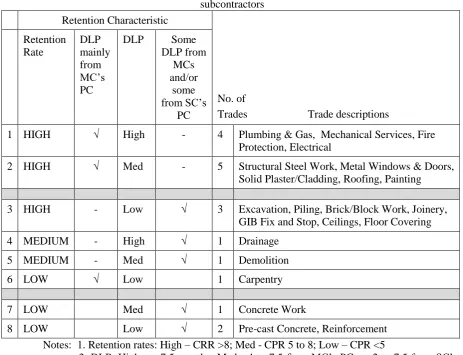
Table 2: Classifying retention regimes in practice in increasing order of favourability to subcontractors
Retention Characteristic
No. of
Trades Trade descriptions Retention
Rate
DLP mainly from MC’s PC
DLP Some
DLP from MCs and/or
some from SC’s
PC
1 HIGH √ High - 4 Plumbing & Gas, Mechanical Services, Fire Protection, Electrical
2 HIGH √ Med - 5 Structural Steel Work, Metal Windows & Doors, Solid Plaster/Cladding, Roofing, Painting
3 HIGH - Low √ 3 Excavation, Piling, Brick/Block Work, Joinery, GIB Fix and Stop, Ceilings, Floor Covering
4 MEDIUM - High √ 1 Drainage
5 MEDIUM - Med √ 1 Demolition
6 LOW √ Low 1 Carpentry
7 LOW Med √ 1 Concrete Work
8 LOW Low √ 2 Pre-cast Concrete, Reinforcement
Notes: 1. Retention rates: High – CRR >8; Med - CPR 5 to 8; Low – CPR <5
2. DLP: High - > 7.5 months; Med - 4 to 7.5 from MC’s PC, or 2 to 7.5 from SC’s PC; Low - <4 from MC’s PC, or < 2 from SC’s PC.
6.0
RISK-RETENTION
RELATIONSHIP
In order to understand whether current retention rates correlated with performance default risk, a plot between these two variables was examined as illustrated in Fig. 3. It became clear that retention rates (note: not regimes) in practice did not appear to show an association with risk, given the scatter of the distribution with no apparent relationship.
[image:9.595.140.457.577.745.2]CIOB Construction Conference 2012
10
This raises the question whether current practice when viewed holistically, i.e. from a retention regime perspective, has an association with risk. For instance, it was mentioned in Section 5 that two thirds of the trades (14 in all out of the 22 studied) had high retention rates. Of these 14 trades, according to information given in Table 2, had longer DLPs with releases tied to MCs’ PC (categories 1 and) with the most unfavourable retention regimes from a subcontractor point of view. Thus one of the questions that arise is whether the risk levels of these trades are high enough to warrant an extreme retention regime. Information in Table 4 with regards to risk levels marked within parenthesis, and Table 5 information on ‘likelihood’ (L) and ‘consequence’ (C) levels of different trades provides greater insights as discussed below.
[image:10.595.66.534.383.660.2]Firstly, consider issues related to L and C based on results in Table 5. Consider a composite retention rates (CRR) 9% and over as high. This is a reasonable choice. Focussing on the front-end trades, it is seen that all trades with a high consequence (i.e. above median), has a high CRR (see shaded cells). Similarly, with respect to mid-trades, all trades but one (Carpentry) that have high (above median) values for L or C, has high CRRs. Finally, focussing on the backend trades, unlike the frontend and mid trades, of the five trades therein, only one trade showed such an association (Solid Plaster/Cladding). As for other trades, one with a high L (GIB Fix and Stop), and three others (i.e. Suspended Grid Ceiling, Floor Coverings, Painting and Special Finishes) with high CRRs (>9%) did not show the association that a high L or C results in a high CRR. Whilst these trades need further investigation, 17 out of the 22 trades displayed this association. This is an interesting discovery about the link between risk and retention of current practice despite the lack of association with respect to retention rate and overall risk described earlier (see Fig 3).
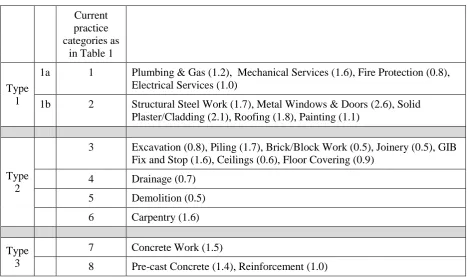
Table 4: Superimposing current Practice with risk levels
Current practice categories as
in Table 1
Type 1
1a 1 Plumbing & Gas (1.2), Mechanical Services (1.6), Fire Protection (0.8), Electrical Services (1.0)
1b 2 Structural Steel Work (1.7), Metal Windows & Doors (2.6), Solid Plaster/Cladding (2.1), Roofing (1.8), Painting (1.1)
Type 2
3 Excavation (0.8), Piling (1.7), Brick/Block Work (0.5), Joinery (0.5), GIB Fix and Stop (1.6), Ceilings (0.6), Floor Covering (0.9)
4 Drainage (0.7) 5 Demolition (0.5) 6 Carpentry (1.6)
Type 3
7 Concrete Work (1.5)
8 Pre-cast Concrete (1.4), Reinforcement (1.0)
CIOB Construction Conference 2012
11
between risk and retention regime with the exception of Piling, Carpentry, Concrete Work and Pre-cast Concrete all of which have a risk level above the median. These exceptions need to be investigated further to understand whether there are more overwhelming reasons for less than harsh and comparatively favourable retention regimes (which may be the result of market forces). Others that need further investigation are Demolition, Brick/Block work, Joinery with the lowest level of risk yet with a Type 2 regime than a Type 3 regime if risks associate with retention regimes. Could the reasons for the latter be explained through Abeysekera’s Cash Cow Theory (2008)? Only further investigations would reveal this.
Table 5: Performance default risk levels
TRADES
Perceived Risk Profile Av. (Max score 2.5 for L & C; Max score for L x C is 6.25)
Current Composite Retention Rate
Overall Likelihood (L) Av.
Overall Consequence (C)
Av.
L x C Risk 1
Frontend L x C
Demolition 0.6 0.8 0.5 5.5
Excavation 0.8 1 0.8 8
Piling 0.9 1.9 1.7 9.5
Concrete Work 1.1 1.4 1.5 4.5
Pre-cast Conc. 0.9 1.5 1.4 4
Reinforcement Steel 0.9 1.1 1.0 2
Structural Steel 0.9 1.9 1.7 9
Brick & Block Work 0.6 0.8 0.5 8.5
Drainage 0.7 1 0.7 9.5
Mid
Metal Windows & Doors 1.3 2 2.6 10
Carpentry 1.2 1.3 1.6 4.5
Joinery 0.6 0.8 0.5 8.5
Roofing 1.2 1.5 1.8 9.5
Plumbing & Gas 0.9 1.3 1.2 9.5
Mech. Services 0.8 2 1.6 9.5
Fire Protection 0.6 1.4 0.8 9.5
Electrical Services 0.7 1.4 1.0 9.5
Backend
Solid Plaster/ Cladding 1.5 1.4 2.1 10
GIB Fix & Stop 1.3 1.2 1.6 7
Suspended Grid Ceilings 0.7 0.9 0.6 9
Floor Coverings 0.8 1.1 0.9 9.5
Painting & Special
Finishes 0.9 1.2 1.1 9.5
Range
Max. 1.5
Plaster 2 Windows/Mech-anical Services* 2.6 Windows 10 Windows/ Plaster Min. 0.6
Demolition, Brick & Block Work, Joinery,
Fire Protection 0.8 Demolition, Brick/Block work 0.5 Demolition /Brick/ Joinery 2 Reinforcement
Median 0.9 1.3 1.1
CIOB Construction Conference 2012
12
Thirdly, consider the situation of Category 2 trades (Type 1b) all of which have a high risk level than Category 1 trades although with a somewhat lower DLP suggesting that contractors seem to prefer higher retention rates than longer DLPs despite higher risks without taking into consideration the nature of the trade (for instance, where a longer DLP would have been more suitable to judge performance over changing seasons). Whilst this seems to provide further evidence that retention regime has a better association with risk than retention rate, it seems that contractors appear to prefer higher retention rates than longer durations. Whilst the reasons have not been investigated, once again, Abeysekera’s Cash Cow Theory (2008) may provide an explanation.
These observations raise the question as to whether given an opportunity of setting a retention regime entirely on consideration of risk levels, would retention regimes for Concrete Work and Pre-cast Concrete etc. be different. This is a matter that needs to be investigated by seeking information from these respondents regarding their perceived levels of risk and associated retention regimes. Moreover, it would also be useful to investigate whether for a given level of risk, the trade-off between retention rate and holding/release mechanism of retentions. For instance, as to whether contractors would prefer a higher retention rate for a less than adequate defects liability period, is a connected issue. This is an important and useful exploration of this study that seeks to understand the risk-retention relationship. The study mentioned in the previous paragraph provides another measure for risk (i.e. overall risk without the product measure of ‘likelihood’ and ‘consequence’) which can then be used for validating the product measure of risk (i.e. L x C) with this overall measure based on high, medium, or low type responses for ‘overall risk’ of a trade. Collecting data for other trades (not covered in this study) could be used for checking external validity. The weights used for converting qualitative scores to numerical scores (i.e. 2.5, 1.5, and 0.5) need further investigation including whether ‘x’ and ‘y’ of the product measure of Lx x Cy should be taken as 1 (see Section 3, data analysis).
7.0
C
ONCLUSIONSAs mentioned earlier, the main purpose of this study was to investigate the risk-retention relationship by developing a methodology to understand this relationship.
In general, it was found that retention rates used in practice did not show an association with the overall (performance default) risk as current rates were primarily based on a paradoxically fair contractual practice of using back-to-back terms except with regard to holding/release mechanisms.
In contrast, when the risk-retention relationship was examined by the two components of risk, it is seen that for trades with high (above median) values of either consequence or likelihood (or both), composite retention rates used are high (over 9%), and for less than high values, the retention rates are lower thereby establishing a relationship between risk and retention to this extent with 17 out of the 22 trades studied displaying this association. The trades that did not, need further investigation to check whether there were other overwhelming reasons for these exceptions.
When examining the risk-retention relationship from a holistic approach taking retention regime as consisting of rate and release mechanisms, it may be concluded that higher the risk, harsher the retention regime. The converse is also true too but a lower level of risk or a medium level or risk, did not necessarily result in a commensurate response, i.e. low risks with favourable regimes, and medium risks with less than harsh regimes. This may be due to other overwhelming factors related to market conditions, project management convenience, or due to other considerations.
CIOB Construction Conference 2012
13
If the risk-retention relationship was examined purely from a risk perspective using perceived risks and perceived retention regimes, it should be possible to obtain a greater understanding about this relationship.
In relation to the theory of Retention Reciprocity, it appears that if contractors are to provide favourable regimes, subcontractors may need to address ways and means of reducing risk for the main contractor. However, one of the contentious issues is whether in fact, despite a high level of risk, the retention regimes imposed are fair (see Abeysekera, 2012). Finally, it needs to be mentioned that ‘risk’ as discussed herein is no doubt a beastly characteristic for the client – a characteristic the principal author had not addressed in his Beast Theory on Retentions. Understanding gained from this study would assist in developing this further vis-a-vis how best to cope with this beastly characteristic.
R
EFERENCESAbeysekera, V (2012). Resolving Retention Polarity: The Perceptions of Structural Steel Fabricators (to be published).
Abeysekera, V (2008). Building theory for the built environment: The case of monetary retentions, [Keynote
Address], CIB W89. Proceedings of the International Conference in Building Education and Research (BEAR)
organised by Salford University (UK) and EURASIA. Heritance Kandalama, Sri Lanka, February 11-15.
Abeysekera, V. (2006). Differential Regimes of Retentions: Harnessing the Power of Retentions through
Contract Retentions. The Journal of Building and Construction Management, Hong Kong, Vol. 10, pp. 20-27.
Abeysekera, V. (2005). Harnessing the Power of Retentions: The Case for a Retention Based Fund for Financing Construction Work. Construction Quarterly Information, The Journal of the Chartered Institute of
Building, UK, 7(1), pp. 10-13.
Abeysekera, V. (2003) Exploring the case for a construction guarantee fund in New Zealand, Proceedings of the Joint International Symposium on Knowledge Construction (CIB Working Commissions W55: Building Economics, W65: Organization and Management of Construction, W107: Construction in Developing Countries), Dept. of Real Estate and Building, National University of Singapore, Singapore, 22-24 October, 1-12
Latham, M. (1994). Constructing the team: final report on the government/industry review of procurement and construction arrangements in the UK construction industry. London: HMSO.
Latham, M. (1997). Giving up retentions. Building, 262, 22-28, 11 April.