R E S E A R C H A R T I C L E
Open Access
The utility of multivariate outlier detection
techniques for data quality evaluation in
large studies: an application within the
ONDRI project
Kelly M. Sunderland
1*, Derek Beaton
1, Julia Fraser
2, Donna Kwan
3, Paula M. McLaughlin
3,
Manuel Montero-Odasso
3,4,5, Alicia J. Peltsch
3, Frederico Pieruccini-Faria
3,4,5, Demetrios J. Sahlas
6,
Richard H. Swartz
7,8, ONDRI Investigators, Stephen C. Strother
1,9and Malcolm A. Binns
1,10Abstract
Background:Large and complex studies are now routine, and quality assurance and quality control (QC) procedures ensure reliable results and conclusions. Standard procedures may comprise manual verification and double entry, but these labour-intensive methods often leave errors undetected. Outlier detection uses a data-driven approach to identify patterns exhibited by the majority of the data and highlights data points that deviate from these patterns. Univariate methods consider each variable independently, so observations that appear odd only when two or more variables are considered simultaneously remain undetected. We propose a data quality evaluation process that emphasizes the use of multivariate outlier detection for identifying errors, and show that univariate approaches alone are insufficient. Further, we establish an iterative process that uses multiple multivariate approaches, communication between teams, and visualization for other large-scale projects to follow.
Methods:We illustrate this process with preliminary neuropsychology and gait data for the vascular cognitive impairment cohort from the Ontario Neurodegenerative Disease Research Initiative, a multi-cohort observational study that aims to characterize biomarkers within and between five neurodegenerative diseases. Each dataset was evaluated four times: with and without covariate adjustment using two validated multivariate methods–Minimum Covariance Determinant (MCD) and Candès’Robust Principal Component Analysis (RPCA)–and results were assessed in relation to two univariate methods. Outlying participants identified by multiple multivariate analyses were compiled and communicated to the data teams for verification.
Results:Of 161 and 148 participants in the neuropsychology and gait data, 44 and 43 were flagged by one or both multivariate methods and errors were identified for 8 and 5 participants, respectively. MCD identified all participants with errors, while RPCA identified 6/8 and 3/5 for the neuropsychology and gait data, respectively. Both
outperformed univariate approaches. Adjusting for covariates had a minor effect on the participants identified as outliers, though did affect error detection.
Conclusions:Manual QC procedures are insufficient for large studies as many errors remain undetected. In these data, the MCD outperforms the RPCA for identifying errors, and both are more successful than univariate approaches. Therefore, data-driven multivariate outlier techniques are essential tools for QC as data become more complex.
Keywords:Quality control, Multivariate outliers, Minimum covariance determinant, Principal component analysis, Visualization
© The Author(s). 2019Open AccessThis article is distributed under the terms of the Creative Commons Attribution 4.0 International License (http://creativecommons.org/licenses/by/4.0/), which permits unrestricted use, distribution, and reproduction in any medium, provided you give appropriate credit to the original author(s) and the source, provide a link to the Creative Commons license, and indicate if changes were made. The Creative Commons Public Domain Dedication waiver (http://creativecommons.org/publicdomain/zero/1.0/) applies to the data made available in this article, unless otherwise stated.
* Correspondence:[email protected]
1Rotman Research Institute, Baycrest Health Sciences, 3560 Bathurst St, Toronto, Ontario M6A 2E1, Canada
Background
As technologies advance, the collection, management, curation, and analysis of large data become increasingly feasible, and large and complex studies are more prevalent as a result. In order for analyses to generate reliable results and allow for trustworthy conclusions, it is essential that these data be of high quality. For that reason, large-scale studies often include comprehensive quality assurance (QA) protocols to minimize occurrence of errors during data collection and preservation, as well as thorough quality control (QC) protocols to ensure accuracy once data have been collected.
Previous papers have discussed the importance of quality control [1–3], though details of the process are often minimal and success rates are rarely addressed. When details are given, they are often ad hoc and domain-specific [4], as opposed to a systematic process that can be applied to a variety of data types.
Numerous large and complex studies have been initiated in recent years, including the Canadian Longitudinal Study on Aging (CLSA) [5], the Alzheimer’s Disease Neuroimag-ing Initiative (ADNI) [6], and the Parkinson’s Progression Markers Initiative (PPMI) [7]. All three of these studies are multi-site initiatives with multiple types of data (including cognitive, neuroimaging, and genomics) and have the intent to share collected data openly with other researchers. While data sharing can stimulate the development of testable hy-potheses or research designs [8] and improve reproducibil-ity [4], it also substantially restricts the ability to verify data with source documents or assessment administrators when errors are suspected.
All three studies have internal statistical groups [9–11] that monitor data during acquisition and release stages, and generally report checking for anomalies, missing data, invalid entries, and general errors. While it is noted that QA and QC processes were undertaken [5,12], there are not detailed descriptions of how they were performed, such as which techniques and approaches were used, or how these were applied to various types of data. Such informa-tion is important for consumers of these data, and would be useful to other groups collecting similarly large and complex multi-modal data.
Another such large and complex study is the Ontario Neurodegenerative Disease Research Initiative (ONDRI), a longitudinal, multi-site, and multi-cohort observational study that aims to characterize biomarkers within and between five neurodegenerative diseases [13]. The levels of disease, dysfunction, and decline are assessed for each participant across multiple measurement platforms (see
Data below). The ONDRI baseline data have been ac-quired and we report on a data quality evaluation process based on multivariate outlier detection methods that was designed and used within ONDRI to ensure that data are of the highest possible accuracy. We also
examine the sensitivity of univariate outlier detection to errors identified by the multivariate detection so that it may guide future large scale projects.
Motivation for outlier detection as data quality evaluation
Data collection protocols usually include but are not lim-ited to recording the measurement, transcribing compo-nents of the measurement, entering values into a database, calculating derived measures (e.g., standardized scores, summary scores), and subsequently distributing data. Many of these steps are performed manually and mistakes could feasibly be made during any stage, introducing erroneous values into the dataset [1]. When these steps are performed automatically human error is less likely, but errors can occur when equipment fails or through preprocessing steps, during which unstructured data may be misinterpreted (e.g., voice recordings). Herein, we consider any recorded value that does not accurately reflect the performance of the observed participant to be an error.
Common practices for ensuring data are accurate in-clude manually checking the data for errors and double entry, where data are entered into the database twice by two different people and subsequently compared for ac-curacy. However, studies of the effectiveness of these tech-niques suggest that while they are successful in identifying some errors, they are often not sufficient as many errors remain [14,15]. Also, manual procedures become increas-ingly time consuming as data grow in number of observa-tions, number of variables, and/or variety of data types.
erroneous values within the bulk of the data that would be more accurately represented outside the distribution.
Techniques for outlier detection
Some of the most common techniques for outlier detection focus on each variable independently, identifying extreme observations based on the observed univariate distribution. For example, when the distribution is assumed normal, ob-servations are often considered outlying when they are be-yond a pre-specified number of standard deviations from the mean [17, 18]. Since outliers can influence the esti-mated mean and standard deviation, their effect on these parameters could mask the degree to which they are outly-ing and they consequently may not be identified as outliers [19]. However, using robust methods for outlier detection can reduce or remove the effect of outliers on estimates of location and spread [17, 20]. One approach is truncation, where a pre-specified number of data points are excluded at both extremes of the distribution when calculating par-ameter estimates [21], consequently excluding any potential outliers and instead capturing the distribution of the major-ity of the data. Alternatively, methods based on the median, such as the Median Absolute Deviation or boxplots can be used as the extremity of an outlier is irrelevant to these robust measures of location and scale [19, 22]. However, because these approaches only consider each variable inde-pendently, they will not identify observations that are outlying given relationships between two or more variables. As a result, multivariate outlier detection methods may be valuable in most data sets.
Hadi, Rahtmatullah Imon, & Werner [23] suggest that multivariate outlier detection techniques fall into two gen-eral categories: methods based on distances and methods based on lower dimensional projections. One of the com-monly used distance metrics in the multivariate space is the Mahalanobis Distance (MD), which considers the mean and covariance of the data, and for which larger distances are returned for observations that deviate from the mean in directions with smaller covariance [24]. However the influence of outliers is an issue with multivariate methods as well [25], so there exist a number of methods that first identify the robust distribution. These methods include the Minimum Volume Ellipsoid [26, 27] and the Minimum Covariance Determinant (MCD) [26,27], where the MCD is more common and exhibits greater statistical efficiency and a faster convergence rate [28].
The goal of dimension-reduction based techniques is to extract “interesting” structure from a multivariate dataset by reducing the data to only a few informative dimensions [23]. The most well-known dimension-based technique is Principal Component Analysis (PCA) [29]. PCA has become a common tool for outlier detection as observations that do not fit the structure are exaggerated when projecting the data back onto the components.
Further, it can handle data with more variables than ob-servations, making it applicable to a more general selec-tion of datasets. While PCA can be susceptible to influential values, many robust variations that are less susceptible to these effects have been introduced in re-cent years. These techniques often use regularization in some form to mitigate the effects of outliers and provide robust estimates of covariance. Some of these include regularized PCA [30], principal orthogonal complement thresholding [31], and Candès’robust PCA (RPCA) [32]. For our data quality evaluation process we use two multivariate methods, one from each of the two general categories, and compare their selection of outliers and ensuing success in identifying errors with one another. We consider the MCD, coupled with Monte Carlo simu-lation and a corr-max transformation [33], and the RPCA, coupled with Orthogonal Distance measure-ments (see Methods). We do not propose that these are the optimal methods, but rather they are methods with which we had success. We further compare these results with two univariate methods: a simplification of the pre-viously described MCD by applying it univariately (uMCD) [34], and the commonly used univariate box-plots [22]. Further, both stem from the distance-based outlier methods described for multivariate detection.
Herein, we describe a data quality evaluation process that emphasizes the use of multiple multivariate tech-niques, communication, and visualization, and assess the sensitivity of standard univariate techniques to detect er-rors that were identified by multivariate outlier tech-niques. We describe motivation for, performance and limitations of our process for two exemplar datasets from ONDRI’s vascular cognitive impairment (VCI) cohort, i.e., the neuropsychology and gait platform data at baseline, and provide a roadmap for large or complex datasets, and especially other large-scale projects.
Methods Data
physical (e.g., unable to ambulate independently) impair-ment are not included. All ONDRI participants provide written and informed consent. Details on the ONDRI study design have been provided previously [13].
In this paper, we consider a core subset of the neuro-psychology and gait measurements of the baseline data for the VCI cohort for illustrative purposes. The VCI cohort includes 161 participants between 55 and 85 years of age who experienced an ischemic stroke, as documented by magnetic resonance imaging or computed tomography, at least 3 months prior to enrolment.
The core neuropsychology dataset has 53 variables from 13 cognitive assessments and two questionnaires. Approximately half of the variables within this dataset are raw observed scores, while the other half are the same raw scores transformed based on published educa-tion- and/or age-adjusted normative data [35]. As a re-sult, there is strong correlation between the raw and corresponding transformed scores.
The core gait dataset has 29 variables that describe walking performance over multiple experimental condi-tions (i.e., preferred walking, three types of dual task walk-ing (walkwalk-ing while countwalk-ing backwards from 100; namwalk-ing animals; and subtracting multiples of seven from 100), and fast walking) by measuring the number of steps and time required for a 6 metre walk [36]. Depending on the site, the primary source of data collection was through tri-axial accelerometers worn on both ankles and the right hip or an electronic GAITRite walkway, set up across the center portion of the walk [37]. Regardless of the data col-lection modality, administrators used tablets for tracking the walking condition and recording the time to walk completion, for data verification and in case of equipment malfunction. Unfortunately, the gait data for 13 pants (8.1%) were not properly recorded and these partici-pants are excluded from the analysis as a result, reducing the sample for the gait platform to 148 participants.
Both data platforms performed rigorous QA and QC procedures to maintain accuracy and consistency across multiple testing locations [36]. Extensive training was provided to all study coordinators on all facets of the data collection, including administering, scoring, and en-tering data into the database.
Data preparation
We conducted outlier detection on each of the afore-mentioned datasets with and without adjusting for co-variates. From a quality evaluation perspective, adjusting for covariates could illuminate or obscure errors by moving an error away from or towards the observed distribution. Therefore, we investigated whether covari-ate adjustment altered the outlier and subsequent error results, in comparison to unadjusted versions.
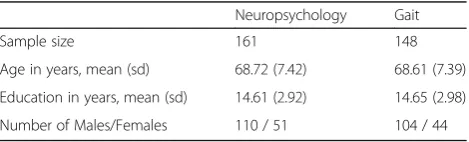
The covariate adjusted dataset was composed of the residuals from a linear regression of each variable with age, sex, years of education, and all interactions. These demo-graphic variables are common adjustment factors for stud-ies of aging or neurodegenerative diseases [38], and further are used in the analysis of many neuropsychology and gait measurements [35, 39]. Summary demographics for the preliminary data for the VCI participants in ONDRI are in Table1.
For both the adjusted and unadjusted datasets, each measure was scaled to have zero mean and unit standard deviation. This ensures that variables are comparable to one another by preventing scale differences from biasing the results. For multivariate approaches, missing values on any variable would exclude the participant so any missing values were imputed using the univariate mean.
Notation
Here we define a notation set for use throughout the paper. Upper case bold letters (e.g., X) denote matrices and lower case bold letters (e.g.,x) denote vectors. Two matrices that appear side-by-side (e.g., XY) denote standard matrix multiplication.diag(X) denotes the vec-tor of diagonal elements of matrix X, ‖X‖∗ denotes the
nuclear norm (sum of the singular values) of X, and ‖X‖1 is the l1-norm of a vectorized X. I is the identity matrix. The superscript−1denotes matrix inversion and the superscript T denotes matrix transpose. Subscripts denote different versions of a matrix or vector (e.g., xj
denotes thejthcolumn vector of matrixX, forj= 1, 2, 3, …). Lower case italic letters (e.g.,x) denote scalar values. ⌊x⌋denotes the floor function. ndenotes the number of observations, p denotes the number of variables, and raw data matrices are assumed to contain n×p elements.
Outlier detection methods
We used two multivariate methods to obtain robust esti-mates and identify multivariate outliers within each data-set: the Minimum Covariance Determinant (MCD) and Candès’ Robust Principal Component Analysis (RPCA). We assessed the sensitivity of the univariate MCD (uMCD) [34] and traditional boxplots [22] to identifying observa-tions originally identified by the multivariate techniques that were found to have errors.
Table 1Preliminary summary demographics for the ONDRI VCI cohort
Neuropsychology Gait
Sample size 161 148
Age in years, mean (sd) 68.72 (7.42) 68.61 (7.39)
Education in years, mean (sd) 14.61 (2.92) 14.65 (2.98)
Minimum covariance determinant (MCD)
The minimum covariance determinant (MCD) algorithm provides a robust estimate of the multivariate mean ð^μÞ and covariance (Σ^Þby searching for the subset ofhdata points with a minimum determinant of the covariance matrix [34], where nþp2þ1≤h≤n. The MCD relies on the Mahalanobis Distance (MD):
m¼
ffiffiffiffiffiffiffiffiffiffiffiffiffiffiffiffiffiffiffiffiffiffiffiffiffiffiffiffiffiffiffiffiffiffiffi
X−μ^
ð ÞTΣ^−1ðX−μ^Þ q
;
Since the covariance cannot be inverted whenΣ^ is singu-lar,mis undefined forh<pand thus can be calculated only for datasets with more observations than variables (n > p). To obtain the exact MCD is computationally expensive [34], and so the fast-MCD [40] is used in practice [34].
The fast-MCD begins by randomly selecting a subset ofp+ 1 observations from dataset X, producing X0 and subsequently computing m0for all n observations, with
mean, μ^0, and covariance, Σ^0. The h observations for
whichm0are smallest are then extracted to form a new subset,X1.his determined by:
h¼ 2 nþpþ1 2
−nþ2α n− nþpþ1
2
;
whereαis a user-defined parameter between 0.5 and 1 that specifies the desired robustness, with smaller values equat-ing to increased robustness but at the cost of lower effi-ciency and a potentially larger set of outliers. FromX1,m1 is computed for allnobservations and a new subset of h observations is selected, decreasing the covariance deter-minant with each new subset. This process repeats until the subset ofhobservations at a given iteration is the same subset as the previous iteration. At this point, the determin-ant of the covariance is a localized minimum. The algo-rithm is repeated for every p + 1 subset, or for some maximum number of random subsets (e.g., 100,000), and the subset ofhobservations with the (global) minimum co-variance determinant is defined as the most concentrated subset, hereafter calledXMCD. The MCD-robust parameter estimates are subsequently calculated:
μ
̂MCD¼1 h
Xh
i¼1 xMCDi
Σ ̂
MCD¼c01 h
Xh
i¼1
xMCDi−̂μMCDÞ xMCDi−̂μMCDÞT
wherec0is a scalar consistency factor to correct for the
smaller sample [41, 42], followed by the corresponding mMCDestimates.
To determine the threshold of mMCD beyond which an
observation is considered an outlier, we follow an approach similar to Dovoedo & Chakraborti [43]. First, we transform
eachmMCDto the Robust Mahalanobis Distance
Outlying-ness [43] statistic to constrain the distribution of distances to between zero and one:
rMCD¼1− 1
1þmMCD
Then, we simulate 100 multivariate normal samples of size nwith μ^MCD and Σ^MCD, calculate the outlyingness
of the simulated observations, and use theϵMCD percent-ile from these simulations as the threshold for outliers, whereϵMCDis user-defined and between 0 and 1.
Like most multivariate outlier techniques, there is no dir-ect information about the source of outlyingness for each observation. Therefore, we supplement the MCD with the corr-max transformation [33]. The corr-max transform-ation identifies a partition,W, that breaks themMCDinto a sum of p terms, where the combination of variables that contribute most to the sum are those that most influence the value ofmMCD,i.e.,m2MCD¼
Pp
j¼1w^j2. To identify this partition, we obtain the transformation matrix:
C
̂¼ð̂DMCDΣ̂
MCD̂DMCDÞ− 1 2̂DMCD;
whereffiffiffiffiffiffiffiffiffiffiffiffiffiffiffiffiffiffiffiffiffiffiffiffiffiffiD^MCD is a diagonal matrix with entries 1=
diagðΣMCDÞ^
q
. Finally, the contribution matrix is
de-rived by multiplying C^ with the vector of deviations from the mean, xi−^μMCD. The contribution matrix is
proportional to the identity matrix, and the maximum of the sum of correlations between each variable’s observed values and corresponding vector of contributions is obtained. As a result, a deviation of a given magnitude will have a larger measured contribution on variables with less noise, versus a smaller contribution on vari-ables with more noise. The resulting contribution values highlight variables that contribute the most variance to each robust MD, and can be used as a guide for deter-mining the reason each outlier is considered atypical.
Robust principal component analysis (RPCA)
Candès’ Robust Principal Component Analysis (RPCA) [32] aims to deconstruct a dataset X into two separate datasets, L and S, where X = L+S. Here L is a low-rank and robust approximation of X, and S is a generally sparse matrix with non-zero values repre-senting deviations from the robust structure. L and S are determined by optimizing:
mink kL þλk k1S s:t:X¼LþS;
where λ is a user-defined regularization parameter that controls the level of sparsity inS,commonly defined as λ¼ ffiffiffiffiffiffiffiffiffiffiffiffiffiffiffi1
maxðn;pÞ
p . However,Soften contains many non-zero
hyperparameter,τ, to allow the user to specify more dir-ectly the proportion of non-zero elements desired (e.g.,τ = 5%). In practice, RPCA can be performed in the fol-lowing five steps:
1. SetX00¼X−S00, whereS00 is an×pmatrix of zeros. 2. Apply the Singular Value Decomposition [29] such
thatX00¼U0Δ0VT0, and thresholdΔ0toΔ00 through a regularization procedure such as [44].
3. ConstructL0¼U0Δ00VT0. 4. ComputeS0¼ kX00−L0k1.
5. IfX00−L0−S0 ≈0, stop. Else return to step 2 with
X0
1¼L0þS0 .
For our work, the five steps above are repeated, decreasingλ each time until the proportion of non-zero elements are <τ.
To assess the deviation of participants and determine which are outlying, we supplement the RPCA by meas-uring the Orthogonal Distance (OD), that is, the sum of squared distance between two datasets. This was moti-vated by Hubert, Rousseeuw, & Vanden Branden’s use of the OD [45] to identify observations that change sub-stantially between two versions of the same data. We calculate the OD betweenXandS:
oXS¼ Xp
j¼1
xj−sj
2
and similarly for L and S, oLS. For each participant, the proportion between oXSand oLS represents the deviation between the robust estimates and observed values, given the sparsity in S. To determine which participants are outliers, the proportional OD estimates are ordered and theϵRPCApercentile is used as a threshold. The non-zero values inSfor each outlier are considered the contributing variables for the RPCA approach, and the proportion dictates the order of importance.
Univariate MCD
The univariate MCD (uMCD) generally follows the same process as the previously described MCD, but with some simplifications. Since the approach is applied to each variable independently, the subset ofhconcentrated data points is selected based on the variance, and the robust estimates are the mean and variance [34]. The Monte Carlo simulations of a multivariate normal distribution were replaced with simulations of a normal distribution.
Boxplots
Boxplots use the median and the two other quartiles as measures of location and spread, as opposed to the mean and standard deviation, and are consequently more robust by design. To identify outliers, the
interquartile range is calculated as the difference be-tween the first and third quartiles, and any values greater than 1.5 times the interquartile range from the third quartile, or more than 1.5 times the interquartile range less than the first quartile, are considered outlying. Visu-ally, these are represented as any values beyond the whiskers. Although the boxplot is often regarded as an informal or exploratory approach to outlier detection [28, 47], is it one of the simplest methods to identify atypical observations on the univariate scale, is not af-fected by the magnitude of outliers, and offers clear visualization.
List of outliers
It is expected that each outlier detection method will pro-duce a different subset of outliers due to the differences in technique. Further, while the multivariate methods we used consider patterns between variables when identifying outliers, they also note participants that are extreme on a single variable (i.e., univariate outliers) and therefore remain valuable when variables are fully uncorrelated. As a result, we did not include univariate techniques in our ini-tial assessment of outliers and therefore only considered the results of the multivariate approaches when selecting participants to review for accuracy.
Ultimately, participants identified as outlying with two or more of the four multivariate approaches (i.e., MCD or RPCA; adjusted or unadjusted) were compiled into a single list, based on the assumption that outliers detected at higher frequencies are more generally deviant. The contrib-uting variables were also included to guide the platforms in determining the location of potentially erroneous recorded observations. This list is forwarded to the corresponding platform team, where the recorded data for each outlying observation are verified and subsequently classified as erro-neous or atypical but correct. Values with evidence that an error occurred are corrected, while truly outlying values are left unchanged and accommodated during the analysis phase as indicated by the specific goals of the researcher. Note that the selected outliers and proposed reasons for detection are based on thresholds jointly chosen by the bio-statistics and assessment platform teams. Therefore, data highlighted in the overall list should be approached with curiosity, as they can change with additional iterations of outlier detection.
Multivariate visualization
be difficult to appreciate without also understanding the observation’s relation to the rest of the data struc-ture. Therefore, multivariate visualization was used to gain some understanding of how each outlying partici-pant deviates. Specifically, the observed values of all participants were mapped on a scatterplot for the two primary contributing variables of a given outlying par-ticipant. Where the reason for outlying did not become obvious, a colour or size gradient was used to depict a third variable.
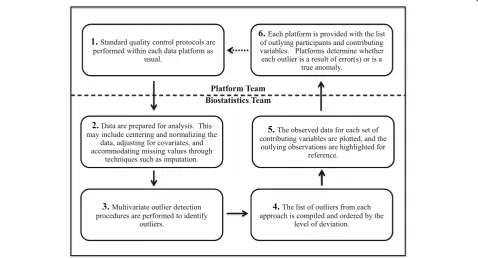
The data quality evaluation process
We have described the pieces of our proposed data qual-ity evaluation process. Figure1summarizes the steps for an iterative process that other large-scale projects can employ as part of their own data quality evaluation to identify outliers and potential errors.
A new iteration of this process should occur each time an error is identified, prompting corrections and gener-ation of a new dataset, as corrected data may alter the set of outlying observations. When none of the outlying participants are determined to be an error and the data-set remains static, the data quality evaluation process is considered complete.
In order to perform these multivariate outlier detec-tion procedures efficiently, an R package outlieRs [48] was developed. This package is available online for use by other large-scale projects.
Results
Our proposed data quality evaluation process was applied to the neuropsychology and gait core data-sets. In this section, we provide results for each of the datasets from four multivariate approaches – MCD or RPCA, with or without covariate adjust-ment – and assess the sensitivity of four univariate approaches – univariate MCD or boxplots, with or without covariate adjustment – to the errors identified.
Outliers and errors
Parameters were selected for each of the multivariate outlier detection approaches based on the number of ob-servations and variables in the dataset, the data distribu-tion, the resources that would be required to verify the resulting outlier list within platforms, and the unknown relative performance characteristics of the MCD and the RPCA. The same parameters for both the neuropsych-ology and gait datasets were used in order to compare results between different datasets: α = 0.8 and ϵMCD = 0.99 were used for the MCD, andλ= ffiffiffiffiffiffiffiffiffiffiffiffiffiffiffi1
maxðn;pÞ
p ,ϵRPCA=
0.90, and τ= 0.05 were used for the RPCA. The impact of varying α and ϵRPCA on the number of outliers for each approach, and how a change would affect the de-tection of errors, is explored in Additional file1. For the univariate approaches, the parameters for the uMCD
were set equal to those selected for the MCD (α = 0.8 andϵMCD= 0.99) for a direct comparison.
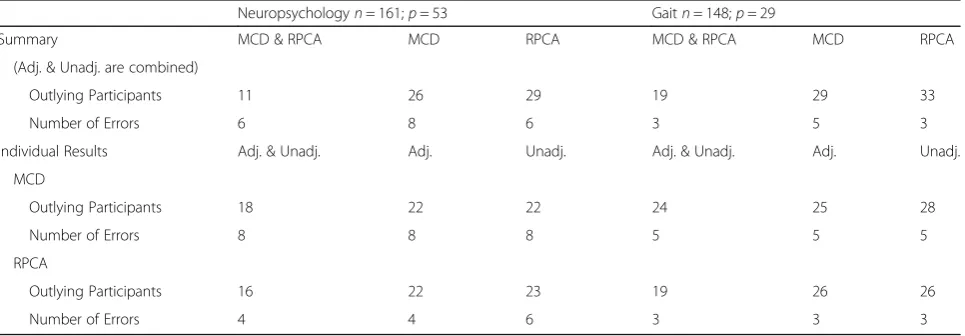
Table 2 shows the number of participants identified as outliers by multivariate methods. The summary compares the number of outlying participants identified with the two methods, regardless of whether covariates were adjusted, while the individual results compare adjusted and unadjusted within each method. The numbers of errors that were identified after verifying the values of participants identified by two or more approaches are also compared.
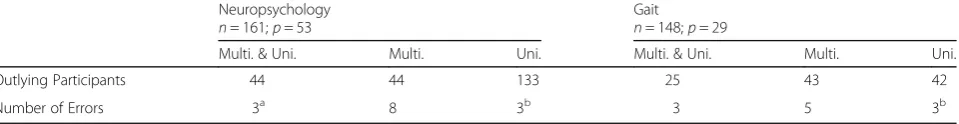
Univariate outlier detection methods were performed to assess whether the errors identified with multivariate methods could have been identified with simpler methods. The number of outlying participants and errors identified by univariate methods are in Additional file 2. Table 3
compares results between multivariate and univariate methods, regardless of adjustment. Note that while partic-ipants with an error may have been identified with a uni-variate approach, we only included them as errors if the corresponding variable was flagged. Further, only partici-pants flagged with two or more multivariate methods were verified, so we are not able to report errors identified by only univariate approaches.
Neuropsychology
On the first iteration of the quality evaluation process, 44 participants (27.3%) were identified by one or more of the four multivariate outlier approaches across 53 neuropsych-ology variables. The MCD identified 22 participants (13.7%) with each of the adjusted and unadjusted approaches, and the RPCA identified 22 participants (13.7%) with the adjusted and 23 participants (14.3%) with the unadjusted approach; 11 participants (6.8%) were identified with both the MCD and the RPCA, regardless of adjustment.
The list provided to the neuropsychology team for verification comprised the 29 participants (18.0% of all 161 participants) that were flagged by two or more multivariate approaches. For each of the listed partici-pants, the neuropsychology team compared the values stored in the database with those recorded on the paper form (how the data were originally collected) and, where possible, with the audio recordings of the participant’s responses. Values differed between the recorded and source data for eight of the 29 participants (27.6%) on the list, 5.0% of all 161 participants. The MCD was suc-cessful in identifying all eight of these participants, while the RPCA was successful in identifying six (75.0%).
Using the contributing variables identified by each of the approaches proved valuable in highlighting the vari-ables upon which to focus. With the MCD, the errone-ous variable was among the top three contributing variables for seven of the eight participants with errors, regardless of adjustment, while the erroneous variables were included among the set of contributing variables for four of the six participants with errors that the RPCA identified. The error identified despite the variable not having been a primary contributor highlights the idea that multivariate outliers are the result of relationships among all the variables, not only the first few contribu-tors, and atypical relationships may be hiding deeper.
With univariate outlier detection, all values within the subset identified by the uMCD were equal for one vari-able when covariate adjustment was not applied, result-ing in a robust variance of 0 and makresult-ing it impossible to calculate the Mahalanobis distance. As a result, this vari-able was excluded from the unadjusted approach. Never-theless, 133 of the 161 participants (82.6%) were identified by at least one approach on at least one
Table 2Comparison of outlying participants and errors identified by the multivariate outlier detection approaches during the first iteration of the data evaluation process: first, between MCD and RPCA directly, combining results with and without adjustment; then, between the adjusted and unadjusted results within each multivariate method. For each set of results, the total number of outliers/errors by each approach is reported (MCD vs. RPCA; adjusted vs. unadjusted), as well as the number that overlapped between the two approaches
Neuropsychologyn= 161;p= 53 Gaitn= 148;p= 29
Summary MCD & RPCA MCD RPCA MCD & RPCA MCD RPCA
(Adj. & Unadj. are combined)
Outlying Participants 11 26 29 19 29 33
Number of Errors 6 8 6 3 5 3
Individual Results Adj. & Unadj. Adj. Unadj. Adj. & Unadj. Adj. Unadj.
MCD
Outlying Participants 18 22 22 24 25 28
Number of Errors 8 8 8 5 5 5
RPCA
Outlying Participants 16 22 23 19 26 26
variable. One hundred twenty participants (74.5%) were flagged by the uMCD with covariate adjustment, 126 participants (78.3%) were identified by the uMCD un-adjusted approach, 80 participants (49.7%) were flagged by boxplots with adjustment, and 78 participants (48.4%) were flagged by boxplots without adjustment. We note that all 44 participants identified by the multivariate approaches were also identified by the univariate approaches on at least one variable.
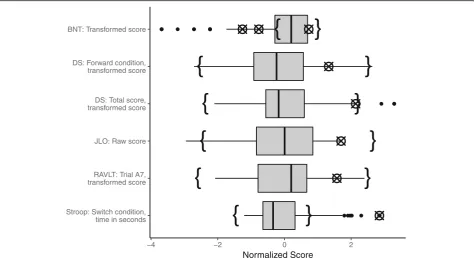
While the univariate approaches were not considered when building the list, we confirmed post hoc that using only the uMCD would have yielded only two or three of the errors identified with multivariate methods, depending on adjustment, while the boxplots would have yielded only one. Figure 2 shows boxplots for the variables on which errors were identified with the multivariate approaches, not adjusted for covariates. The crossed circles on each boxplot represent the erroneous values within the univariate distri-bution, and the curly brackets represent the non-outlying range identified by the uMCD, showing a similar span to the whiskers on the boxplots, though occasionally narrower or shifted, causing an increase in values identified as out-liers. Most errors that were not identified using either uni-variate method were errors from manually calculating transformed scores from raw scores, and so were only evi-dent when both types of scores were considered together.
After correcting the eight identified errors, the entire data evaluation process was performed again. This subsequent it-eration of the process identified four additional errors in the data that had not been identified during the first pass. Most intriguingly, one of the participants with an error identified in the initial iteration was identified again in the second iter-ation –while the initial error for this participant had been corrected, the second iteration enabled a different error to become apparent. The newly identified error had been masked during the first iteration by the original error, thus validating the use of an iterative process until errors are no longer identified and the list of outliers remains static.
Gait
On the first iteration of the quality evaluation process, 43 participants (29.1%) were identified by at least one of the multivariate outlier approaches. The MCD identified 25
participants (16.9%) with the adjusted and 28 participants (18.9%) with the unadjusted approach, and the RPCA iden-tified 26 participants (17.6%) with each of the adjusted and unadjusted approaches; 19 participants (12.8%) were identi-fied by both the MCD and RPCA, regardless of adjustment. The list provided to the gait team for verification com-prised the 29 participants (19.6% of all 148 participants) that were identified by two or more multivariate ap-proaches. For each of the listed participants, the gait team reprocessed the data using participant-specific thresholds for step detection and manually inspected each footstep. Through the manual inspection, they dis-covered erroneous step counts were calculated by the software for five of the 29 participants (17.2%) on the list, or 3.4% of all 148 participants. Again, the MCD was successful in identifying all five of these participants, and the RPCA identified three (60.0%).
The contributing variables were again effective in pointing towards the source of error, but unlike with the neuropsychology data, they did not indicate all variables affected by an error. The errors identified in the gait dataset were as a result of the pre-processing pipeline miscounting the number of steps taken by the partici-pant during the walk, and as a result affected all values for that walk. Therefore, while many of the contributing variables possessed an error, they were only those that appeared most atypical as a result of the error and were not the only values affected. In order to pinpoint these errors, the gait expert was required to examine data be-yond the top contributing variables.
With univariate outlier detection, 42 of the 148 partic-ipants (28.4%) were identified by at least one approach on at least one variable. Thirty-eight participants (25.7%) were flagged by the uMCD with covariate adjustment, 35 participants (23.6%) were flagged by the uMCD with-out adjustment, 29 participants (19.6%) were identified by boxplots with adjustment, and 26 participants (17.6%) were flagged by boxplots with the unadjusted approach. In total, 25 participants (16.9%) identified by at least one multivariate approach were also flagged by a univariate approach on any variable.
Again, while the univariate approaches were not con-sidered when building the list, it was confirmed post hoc Table 3Comparison of outlying participants and errors identified by the multivariate and univariate outlier detection approaches in the first iteration of the data evaluation process, regardless of specific method and whether covariate adjustment was applied
Neuropsychology n= 161;p= 53
Gait
n= 148;p= 29
Multi. & Uni. Multi. Uni. Multi. & Uni. Multi. Uni.
Outlying Participants 44 44 133 25 43 42
Number of Errors 3a 8 3b 3 5 3b
a
All outlying participants identified by multivariate methods were also identified by univariate methods. However, not all univariate methods identified the participant as an outlier on the variable with the error
b
that using only a univariate method would have missed some of the errors the multivariate approaches were able to find. In particular, the univariate approaches identified only two or three of the errors, depending on adjustment. Figure 3 shows boxplots for the contributing variables identified by the multivariate outlier detection approaches, with data not adjusted for covariates. Again, the crossed circles represent the erroneous values within each univari-ate distribution, and the curly brackets represent the non-outlying range identified by the uMCD. In this case, the uMCD range was almost identical to the span of the whiskers, suggesting that it would not be possible for any univariate outlier detection method to identify some of the errors the multivariate approaches could.
Subsequent iterations of the data quality evaluation process did not reveal any additional errors in the gait dataset.
Multivariate visualization
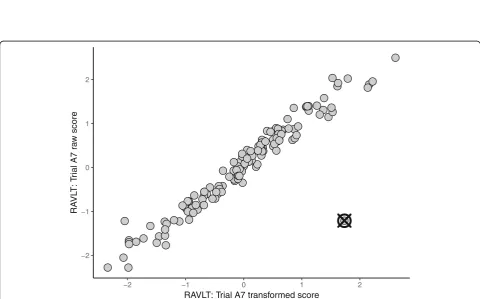
Visualization proved to be an effective diagnostic and communication tool as it allows viewing how each outly-ing participant deviated from the others. Figure4 exem-plifies a scatterplot of the top two contributing variables for an outlying participant. This representation clearly conveys that there is a correlation between the raw and transformed scores for the A7 trial of the Rey Auditory
Verbal Learning Test [35], with the exception of a single participant whose transformed score was considerably higher than that of other participants with a similar raw score. This participant appears typical on each variable individually (as exhibited by the boxplot in Fig. 2) and consequently would not be easily identified without the benefit of the scatterplot which illustrated the bivariate relationship for these variables. As a result, the plots assisted the biostatistics team in motivating the utility of multivariate outlier detection to platforms.
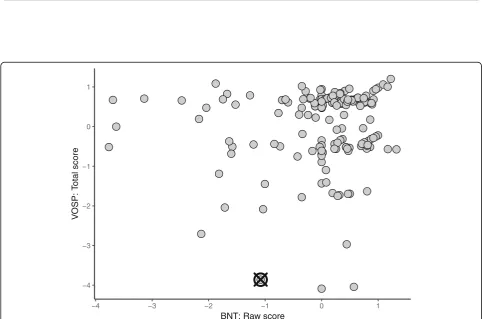
Visualization also highlighted the differences between the MCD and RPCA. Data for two primary contributing variables selected by each method are plotted in Figs. 5
and 6. Observe that the data for contributing variables identified with the MCD, plotted in Fig.5, exhibit a 1:1 re-lationship, with the exception of two observations with slightly higher transformed BNT scores given their raw BNT scores. Both of these participants were flagged as outliers and identified as erroneous on the transformed BNT score, however only the participant marked by the crossed circle was also identified by the RPCA. Further, the contributing variables selected by the RPCA did not include the transformed BNT score but a Digit Span vari-able instead. With this difference, the patterns exhibited by the contributing variables identified with the RPCA do not convey a strong correlation like the MCD, as shown
Fig. 3Boxplots for gait variables identified as primary contributing variables and on which an error was identified with the multivariate data quality evaluation process. All data were adjusted for age, sex, and years of education, and normalized to have zero mean and unit standard deviation. The range of typical values identified by the univariate MCD is represented by curly brackets. Values at which an error was identified with the data quality evaluation process are represented by crossed circles. As previously noted, errors identified in the gait dataset affected multiple variables, so two variables are included per error
Fig. 5Observed data for two measures of the Boston Naming Test (BNT). All data were adjusted for age, sex, and years of education and normalized to have zero mean and unit standard deviation. The outlier is represented by a crossed circle
in Fig.6, and the outlying participant is merely away from the cluster formed by the bulk of the observations. While this is also a valid outlier, the erroneous value for the transformed BNT score was not flagged.
Discussion
The data quality evaluation process proved effective in identifying errors in each of the neuropsychology and gait datasets. The identification of thirteen errors across both datasets on the first iteration of the process shows that typical manual curation is insufficient, and both teams revisited their processes after these results. Fur-ther, multivariate approaches are necessary as seven of the thirteen errors (53.8%) were not flagged as outliers by univariate methods, and were apparent only when multiple variables were considered together.
Identifying extreme values on each variable independ-ently is important, and it can be argued that univariate outlier detection is an important step to perform in its own right. However, we assumed that since multivariate methods identify points located away from the cluster center, not merely those with atypical relationships, that performing univariate detection separately would be re-dundant. Further, verification of participants and values identified using univariate approaches as well would have increased the outlier lists. Particularly, for the neuropsychology dataset, the list would have increased from 29 to at least 113 of 161 participants, given the overlap and large number of outliers in adjusted and un-adjusted uMCD, even if the rule of verifying participants identified with two or more approaches remained. Given the time and effort involved in the iterative error detec-tion process, we considered testing up to 70% of partici-pants for errors to be impractical and beyond our resources. Further, while the univariate thresholds were quite liberal and could have been made more stringent, many errors identified with the multivariate approaches were missed with the liberal thresholds nonetheless, so reducing the number of outliers detected would seem less optimal.
Based on communication between the biostatistics and data platform teams, it was deduced that sources of error included both human and technological mistakes. Specif-ically, errors in the neuropsychology dataset occurred as a result of incorrectly recording values in the database or in-correctly computing transformed scores manually, while errors in the gait dataset occurred as a result of the pro-cessing script misidentifying the number of steps made by the participant. Further, because many of the calculated variables for a walking task are dependent on the total number of steps recorded, an error in identifying the number of steps subsequently made the other measures for that task erroneous, and multiple values had to be recalculated for each of the affected participants.
Each of the four multivariate outlier detection ap-proaches identified slightly different subsets of outliers, and the overlap and differences between them allowed us to better understand aspects of these methods. Consider the overlap between the MCD and the RPCA, regardless of adjustment: 11 of the 44 participants (25.0%) flagged in the neuropsychology dataset were identified with both methods, while 19 of the 43 participants (44.2%) flagged with the gait dataset were identified with both methods. While we could assume that these overlaps highlight participants that are more outlying, it begs to be asked why other participants were identified with only one method. One possible explanation is offered by Figs. 5 and 6: that each method is more successful at identifying outliers with a specific type of deviation. Specifically, the contributing variables identified by the MCD suggest that the MCD is more sensitive when strong correlations exist, while the RPCA is less influenced by these correlations.
Manual QA and QC procedures occurred within each data platform, but the characteristics of any observations that were identified as erroneous (and subsequently cor-rected) at that stage were not recorded. However, the MCD had better success in identifying both errors and the contributing variables for errors than the RPCA in both the neuropsychology and gait datasets. Further, the erroneous observations missed by the RPCA typically possessed characteristics similar to those in Fig. 5, sug-gesting that errors of this nature are more difficult to identify with typical QC procedures.
Finally, if the MCD and the RPCA are effectively focusing on different types of outliers, it may not be appropriate to compile an outlier review list based on the frequency of identification, but to give more weight to visualization. This is especially true because two errors in each of the neuropsychology and gait datasets were not identified with the RPCA, regard-less of adjustment, and therefore would not have been verified had the overall list been limited to partici-pants identified by three or more approaches, as op-posed to two. Nevertheless, we do not propose that the MCD and RPCA are the most appropriate multi-variate outlier detection techniques, and encourage the reader to explore some of the many other ap-proaches available (see [18, 46, 49, 50] for reviews).
Limitations
These methods are data dependent and identify observa-tions that deviate from patterns established by other obser-vations. Therefore, while there was success in identifying previously unknown errors, erroneous observations that did not deviate from the pattern were not identified through this process. Further, systematic errors (i.e., those that occur as a result of an incorrect operation that invalidates all or a sub-set of the observed values, such as a protocol deviation) are also unlikely to be identified if a sufficient number of obser-vations with the systematic error exist. Therefore, traditional quality assurance and quality control procedures should continue to be applied a priori, as errors will distort the true pattern and may dominate the distribution.
The MCD and the RPCA are limited to datasets with exclusively continuous data. As a result, some categor-ical variables were excluded from the data quality evalu-ation process, leading to the possibility that errors may have been missed. This will be especially limiting in plat-forms with a high proportion of categorical variables (e.g., genomics). Therefore, extending the MCD and the RPCA for use with categorical and mixed data types is an area in which future research should be focused [52].
Finally, the MCD is undefined for n<p, as previously mentioned, and so the RPCA must be used with wide datasets. While some amendments have been proposed to address this limitation in the MCD [45, 53], we cannot comment on their effectiveness in relation to the RPCA.
Conclusions
We have implemented a process that effectively identifies erroneous observations using multivariate outlier detection techniques in two exemplary datasets from different data platforms of ONDRI. This framework has facilitated the improvement of data integrity as errors can be corrected, and a new dataset can be generated prior to analysis. It was imperative that multivariate approaches were used as uni-variate methods missed errors that exist only when multiple variables were considered together. In particular, the MCD proved to be more effective as the RPCA consistently missed errors that the MCD identified, though cannot be used for datasets with fewer observations than variables.
Additional files
Additional file 1:Effect of selected parameters. (DOCX 17 kb)
Additional file 2:Comparison of outlying participants and errors identified by the univariate outlier detection approaches during the first iteration of the data evaluation process: first, between uMCD and boxplots directly, combining results with and without adjustment; then, between the adjusted and unadjusted results within each univariate method. For each set of results, the total number of outliers/errors by each approach is reported (uMCD vs. Boxplots; adjusted vs. unadjusted), as well as the number that overlapped between the two approaches. (DOCX 13 kb)
Abbreviations
ADNI:Alzheimer’s Disease Research Initiative; CLSA: Canadian Longitudinal Study on Aging; MCD: Minimum Covariance Determinant; MD: Mahalanobis Distance; OD: Orthogonal Distance; ONDRI: Ontario Neurodegenerative Disease Research Initiative; PCA: Principal Component Analysis; PPMI: Parkinson’s Progression Markers Initiative; QA: Quality assurance; QC: Quality control; RPCA: Robust Principal Component Analysis; VCI: Vascular cognitive impairment
Acknowledgements
This work was completed on behalf of the Ontario Neurodegenerative Disease Research Initiative (ONDRI). The authors would like to acknowledge the ONDRI Founding Authors: Robert Bartha, Sandra E Black, Michael Borrie, Dale Corbett, Elizabeth Finger, Morris Freedman, Barry Greenberg, David A Grimes, Robert A Hegele, Chris Hudson, Anthony E Lang, Mario Masellis, William E McIlroy, David G Munoz, Douglas P Munoz, JB Orange, Michael J Strong, Sean Symons, Maria Carmela Tartaglia, Angela Troyer, and Lorne Zinman.
Funding
This research was conducted with the support of the Ontario Brain Institute, an independent non-profit corporation, funded partially by the Ontario gov-ernment. The opinions, results, and conclusions are those of the authors and no endorsement by the Ontario Brain Institute is intended or should be inferred.
DB is partly supported by a Canadian Institutes of Health Research grant (MOP 201403).
MMO is supported by grants from the Canadian Institutes of Health Research (PJT 153100), the Ontario Ministry of Research and Innovation (ER11–08-101), the Canadian Consortium in Neurodegeneration in Aging (CAN 137794), and by the Department of Medicine Program of Experimental Medicine Research Award (768915), University of Western Ontario, and a CIHR Investigator Award.
RHS is supported by the Department of Medicine at Sunnybrook Health Sciences Centre and the University of Toronto, and a Heart and Stroke New Investigator Award.
Availability of data and materials
ONDRI data will be made available at a future date, however the data presented here underwent further quality control, and only the corrected data will be released.
Authors’contributions
KMS, DB, SCS and MAB contributed to the development of methods. PMM, DK and AJP contributed to the collection and curation of neuropsychology data. JF, FP-F and MM-O contributed to the collection and curation of gait data. RHS and DJS contributed to the study design, data collection, and re-cruitment. All authors read and approved the final manuscript.
Ethics approval and consent to participate
The Ontario Neurodegenerative Disease Research Initiative has been reviewed and approved by the Baycrest Research Ethics Board. The Baycrest Research Ethics Board operates in compliance with the Tri-Council Policy Statement, ICH/GCP Guidelines and Part C, Division 5 of the Food and Drug Regulations of Health Canada. All ONDRI participants provided written and informed consent.
Consent for publication Not applicable.
Competing interests
SS is the Chief Scientific Officer of ADMdx, a medical diagnostics company specializing in neuroimaging of neurodegenerative disorders.
Publisher’s Note
Springer Nature remains neutral with regard to jurisdictional claims in published maps and institutional affiliations.
Author details
Waterloo, 200 University Ave W, Waterloo, Ontario N2L 3G1, Canada. 3Schulich School of Medicine and Dentistry, University of Western Ontario, 1151 Richmond St, London, Ontario N6A 5C1, Canada.4Gait and Brain Lab, Parkwood Institute, 550 Wellington Rd, London, Ontario N6C 0A7, Canada. 5Lawson Health Research Institute, 750 Base Line Rd E, London, Ontario N6C 2R5, Canada.6Department of Medicine, McMaster University, 1280 Main St W, Hamilton, Ontario L8S 4L8, Canada.7Department of Medicine (Neurology), Sunnybrook Health Sciences Centre, 2075 Bayview Ave, Toronto, Ontario M4N 3M5, Canada.8Faculty of Medicine, University of Toronto, 1 King’s College Cir, Toronto, Ontario M5S 1A8, Canada.9Medical Biophysics Department, University of Toronto, 101 College St, Suite 15-701, Toronto, Ontario M5G 1L7, Canada.10Dalla Lana School of Public Health, University of Toronto, 155 College St, Toronto, Ontario M5T 3M7, Canada.
Received: 23 November 2018 Accepted: 22 April 2019
References
1. Westervelt HJ, Bernier RA, Faust M, Gover M, Bockholt HJ, Zschiegner R, et al. Data quality assurance and control in cognitive research: lessons learned from the PREDICT-HD study. Int J Methods Psychiatr Res. 2017;26: 1534.https://doi.org/10.1002/mpr.1534.
2. Barchard KA, Verenikina Y. Improving data accuracy: selecting the best data checking technique. Comput Hum Behav. 2013;29:1917–22.https://doi.org/ 10.1016/j.chb.2013.02.021.
3. Rahbar MH, Wyatt G, Sikorskii A, Victorson D, Ardjomand-Hessabi M. Coordination and Management of Multisite Complementary and Alternative Medicine (CAM) therapies: experience from a multisite reflexology intervention trial. Contemp Clin Trials. 2011;32:620–9.https://doi.org/10. 1016/j.cct.2011.05.015.
4. Weng C, Kahn MG. Clinical research informatics for big data and precision medicine. IMIA Yearb Med Inform. 2016:211–8. https://doi.org/10.15265/IY-2016-019.
5. Raina PS, Wolfson C, Kirkland SA, Griffith LE, Oremus M, Patterson C, et al. The Canadian longitudinal study on aging (CLSA). Can J Aging. 2009;28:221. https://doi.org/10.1017/S0714980809990055.
6. Mueller SG, Weiner MW, Thal LJ, Peterson RC, Jack C, Jagust W, et al. The Alzheimer’s Disease Neuroimaging Initiative. Neuroimaging Clin N Am. 2005; 15:869–xii.
7. Marek K, Chowdhury S, Siderowf A, Lasch S, Coffey CS, Caspell-Garcia C, et al. The Parkinson’s progression markers initiative (PPMI)–establishing a PD biomarker cohort. Ann Clin Transl Neurol. 2018;5:1460–77.
8. Ascoli GA, Maraver P, Nanda S, Polavaram S, Armañanzas R. Win–win data sharing in neuroscience. Nat Methods. 2017;14:112–6.https://doi.org/10. 1038/nmeth.4152.
9. Statistical Analysis Centre (SAC) | Canadian Longitudinal Study on Aging. https://www.clsa-elcv.ca/about-us/our-sites/enabling-units/statistical-analysis-centre-sac. Accessed 13 July 2017.
10. ADNI | Biostatistics Core.http://adni.loni.usc.edu/about/centers-cores/ biostatistics/. Accessed 12 July 2017.
11. Parkinson’s Progression Markers Initiative | Study Cores. https://www.ppmi-info.org/about-ppmi/who-we-are/study-cores/. Accessed 13 Mar 2019. 12. Toga AW, Crawford KL. The Alzheimer’s Disease Neuroimaging Initiative
informatics core: a decade in review. Alzheimers Dement. 2015;11:832–9. https://doi.org/10.1016/j.jalz.2015.04.004.
13. Farhan SMK, Bartha R, Black SE, Corbett D, Finger E, Freedman M, et al. The Ontario neurodegenerative disease research initiative (ONDRI). Can J Neurol Sci. 2016:1–7.https://doi.org/10.1017/cjn.2016.415.
14. Kawado M, Hinotsu S, Matsuyama Y, Yamaguchi T, Hashimoto S, Ohashi Y. A comparison of error detection rates between the reading aloud method and the double data entry method. Control Clin Trials. 2003;24:560–9. 15. Barchard KA, Pace LA. Preventing human error: the impact of data entry
methods on data accuracy and statistical results. Comput Hum Behav. 2011; 27:1834–9.https://doi.org/10.1016/j.chb.2011.04.004.
16. Van Den Broeck J, Cunningham SA, Eeckels R, Herbst K. Data cleaning: detecting, diagnosing, and editing data abnormalities. PLoS Med. 2005;2: 0966–70.
17. Rousseeuw PJ, Hubert M. Robust statistics for outlier detection. Wiley Interdiscip Rev Data Min Knowl Discov. 2011;1:73–9.
18. Cousineau D, Chartier S. Outliers detection and treatment: a review. Int J Psychol Res. 2010;3:58–67.
19. Leys C, Ley C, Klein O, Bernard P, Licata L. Detecting outliers: do not use standard deviation around the mean, use absolute deviation around the median. J Exp Soc Psychol. 2013;49:764–6.https://doi.org/10.1016/j.jesp. 2013.03.013.
20. Hubert M, Rousseeuw PJ, Van Aelst S. High-breakdown robust multivariate methods. Stat Sci. 2008;23:92–119.https://doi.org/10.1214/088342307000000087. 21. Marazzi A, Ruffieux C. The truncated mean of an asymmetric distribution.
Comput Stat Data Anal. 1999;32:79–100.
22. Tukey JW. Exploratory data analysis. Reading, Mass: Addison-Wesley Pub. Co; 1977.
23. Hadi AS, Rahtmatullah Imon AHM, Werner M. Detection of outliers. Wiley Interdiscip Rev Comput Stat. 2009;1:57–70.https://doi.org/10.1002/wics.6. 24. Aggarwal CC. Outlier Analysis. Dordrecht: Springer; 2013.
25. Leys C, Klein O, Dominicy Y, Ley C. Detecting multivariate outliers: use a robust variant of the Mahalanobis distance. J Exp Soc Psychol. 2018;74:150– 6.https://doi.org/10.1016/j.jesp.2017.09.011.
26. Rousseeuw PJ. Least median of squares regression. J Am Stat Assoc. 1984; 79:871–80.
27. Rousseeuw P. Multivariate estimation with high breakdown point. In: Mathematical statistics and applications. Dordrecht: Springer Netherlands; 1985. p. 283–97.https://doi.org/10.1007/978-94-009-5438-0_20. 28. Su X, Tsai C-L. Outlier detection. Wiley Interdiscip Rev Data Min Knowl
Discov. 2011;1:261–8.https://doi.org/10.1002/widm.19.
29. Abdi H, Williams LJ. Principal component analysis. Wiley Interdiscip Rev Comput Stat. 2010;2:433–59.
30. Verbanck M, Josse J, Husson F. Regularised PCA to denoise and visualise data. Stat Comput. 2013;25:471–86.
31. Fan J, Liao Y, Mincheva M. Large covariance estimation by thresholding principal orthogonal complements. J R Stat Soc Ser B Stat Methodol. 2013; 75:603–80.
32. Candès EJ, Li X, Ma Y, Wright J. Robust principal component analysis? J ACM. 2011;58:1–37.https://doi.org/10.1145/1970392.1970395.
33. Garthwaite PH, Koch I. Evaluating the contributions of individual variables to a quadratic form. Aust New Zeal J Stat. 2016;58:99–119.
34. Hubert M, Debruyne M. Minimum covariance determinant. Wiley Interdiscip Rev Comput Stat. 2010;2:36–43.
35. Strauss E, Sherman EMS, Spreen O, Spreen O. A compendium of neuropsychological tests: administration, norms, and commentary. New York: Oxford University Press; 2006.
36. Montero-Odasso M, Pieruccini-Faria F, Bartha R, Black SE, Finger E, Freedman M, et al. Motor phenotype in neurodegenerative disorders: gait and balance platform study design protocol for the Ontario neurodegenerative research initiative (ONDRI). J Alzheimers Dis. 2017:1–15. https://doi.org/10.3233/JAD-170149.
37. Hartmann A, Luzi S, Murer K, De Bie RA, De Bruin ED. Concurrent validity of a trunk tri-axial accelerometer system for gait analysis in older adults. Gait Posture. 2009;29:444–8.https://doi.org/10.1016/j.gaitpost.2008.11.003. 38. Rattanabannakit C, Risacher SL, Gao S, Lane KA, Brown SA, McDonald BC,
et al. The cognitive change index as a measure of self and informant perception of cognitive decline: relation to neuropsychological tests. J Alzheimers Dis. 2016;51:1145–55.
39. Biggan JR, Taylor WE, Moss K, Adumatioge L, Shannon V, Gatchel RJ, Ray CT. Role of ApoE-4 genotype in gait and balance in older adults: A pilot study. Journal of Applied Biobehavioral Research. 2017; 22:e12061.
40. Rousseeuw PJ, Van Driessen K. A fast algorithm for the minimum covariance determinant estimator. Technometrics. 1999;41:212–23.https://doi.org/10. 1080/00401706.1999.10485670.
41. Croux C, Haesbroeck G. Influence function and efficiency of the minimum covariance determinant scatter matrix estimator. J Multivar Anal. 1999;71: 161–90.https://doi.org/10.1006/jmva.1999.1839.
42. Pison G, Van Aelst S, Willems G. Small sample corrections for LTS and MCD. Metrika. 2002;55:111–23.
43. Dovoedo YH, Chakraborti S. Outlier detection for multivariate skew-normal data: a comparative study. J Stat Comput Simul. 2013;83:773–83.https://doi. org/10.1080/00949655.2011.636364.
44. Candès EJ, Sing-long CA, Trzasko JD. Unbiased risk estimates for singular value thresholding and spectral estimators, vol. 61; 2012. p. 1–29. 45. Hubert M, Rousseeuw PJ, Vanden Branden K. ROBPCA: a new approach to
46. Rousseeuw PJ, Hubert M. Anomaly detection by robust statistics. Wiley Interdiscip Rev Data Min Knowl Discov. 2018;8:1–14.
47. Morgenthaler S. Exploratory data analysis. Wiley Interdiscip Rev Comput Stat. 2009;1:33–44.https://doi.org/10.1002/wics.2.
48. Beaton D, Sunderland KM. outlieRs. 2017.https://github.com/derekbeaton/outlieRs. 49. Aguinis H, Gottfredson RK, Joo H. Best-practice recommendations for
defining, identifying, and handling outliers. Organ Res Methods. 2013;16: 270–301.https://doi.org/10.1177/1094428112470848.
50. Hodge VJ, Austin J. A survey of outlier detection methodologies. Artif Intell. 2004; 22:85–126.
51. Gelman A, Hennig C. Beyond subjective and objective in statistics. J R Stat Soc. 2017; 180:967–1033.
52. Beaton D, Sunderland KM, Levine B, Mandzia J, Masellis M, Swartz RH, et al. Generalization of the minimum covariance determinant algorithm for categorical and mixed data types. Preprint. 2019.https://doi.org/10.1101/ 333005.