ISSN: 2306-9007 Collins & Mirriam (2016) 1268
I
www.irmbrjournal.com December 2016I
nternationalR
eview ofM
anagement andB
usinessR
esearchVol. 5 Issue.4
R
M
B
R
The Relationship between Emotional Intelligence of Managers
and Employee Performance-A Case Study of
a
Power
Company
MUDENDA COLLINS
Department of Operations and Supply Chain, Copperbelt University
Email: [email protected]
Tel: +260977846337
MHANGO MIRRIAM
ZESCO Limited.
Email: [email protected]
Abstract
Emotional intelligence at work is an essential component of workers, either in supervisory or non-supervisory roles. Studies by Bradberry and Greaves (2009) shows the link between emotional quotient (EQ) and job performance such that EQ alone explained 58% of a leader’s job performance, 90% of top performers were high in EQ and Just 20% of low performers were high in EQ. EQ is linked to job performance for employees at all levels, in virtually every industry that is why it was significant to undertake this study. The researchers adopted the emotional processing theory as the main theory behind the research and used both explanatory and descriptive design which resulted in the use of qualitative and quantitative data collected through the use of physical and email administered questionnaires to a population of 44 managers and a sample of 530 employees. Due to research time limitation, the researchers sampled 228 employees from the population respective of the department size, but undertook to involve all 44 managers at the company. The research yielded 47% response rate from employees and 68% response rate from managers and performed analysis using SPSS and particularly multiple regression. The results reveal strong positive relations between emotional intelligence variables and employee performance and that the relationships were significant at 95 confidence level while observing a 5% margin of error.
Key Words: Performance, Managers, Emotional, Intelligence, Relationship.
Introduction
The concept of EI was made popular by Goleman with his famous book Emotional Intelligence: Why It can
matter More Than IQ. Daniel Goleman explains that IQ is considered to account for approximately 20% of the factors that determine life success, and he argues that EI can account for the remaining factors. The importance of emotional intelligence is emphasized because human relations in organizations are affected by emotional factors more than by rational factors.
Since its publication in 1995, Daniel Goleman’s Emotional Intelligence: Why It Can Matter More than IQ
ISSN: 2306-9007 Collins & Mirriam (2016) 1269
I
www.irmbrjournal.com December 2016I
nternationalR
eview ofM
anagement andB
usinessR
esearchVol. 5 Issue.4
R
M
B
R
one type of intelligence – cognitive intelligence – and is not as important as another type of intelligence – emotional intelligence.
Evidence is accumulating that emotional intelligence is associated with important outcomes such as high quality social relationships1 and represents a distinct theoretical construct2. There is a paucity of research, however, on emotional intelligence and workplace outcomes. Recent findings suggest that emotionally intelligent persons are better performers than their counterparts3, but most of these associations are based on self-report measures of emotional intelligence relatively, emotional intelligence is an emerging subject
in service delivery and marketing4 However, its impact on business performance cannot be underestimated5
Components of Emotional Intelligence
The first component of emotional intelligence is Emotional Self-awareness, which contains emotional self-awareness, Accurate Self-assessment, and Self-confidence. It means, knowing what one feels, or Knowing one’s internal states, preferences, resources, and intuitions. 6Some researchers mentioned that emotional
intelligence is different from general intelligence and that the former is differential intelligence that needs to be investigated in the future. For instance, 7other researchers used the term meta-mood, the affective analogue of meta-cognition, for key aspects of Emotional Self-awareness. The second component of EI, Self-management contains Emotional self-control, Transparency, Adaptability, and Achievement orientation.
The means that this factor is the ability to regulate distressing effects like anxiety and anger and to inhibit emotional impulsivity, or managing one’s internal states and resources. The third EI component is Social Awareness that means awareness of others’ feelings, needs, and concerns, which encompasses the competency of Empathy.
Studies of patients with discrete lesions show impairment of their ability to read nonverbal cues for negative emotions, particularly anger and fear, and to judge the trustworthiness of other people8. Other items are organizational awareness and service orientation. Lastly, the fourth EI component is Relationship Management, or Social Skill, poses a more complex picture, or adeptness at inducing desirable responses in others. In a fundamental sense, the effectiveness of our relationship skills hinges on our ability to attune ourselves to or influence the emotions of another person. This factor encompasses developing others, inspirational leadership, change catalyst, influence, conflict management, and teamwork and collaboration.
How Emotional Intelligence Contributes to Work Performance
Emotional intelligence may contribute to work performance (as reflected in salary, salary increase, and company rank) by enabling people to nurture positive relationships at work, work effectively in teams, and build social capital. Work performance often depends on the support, advice, and other resources provided
by others9. Emotional intelligence may also contribute to work performance by enabling people to regulate
their emotions so as to cope effectively with stress, perform well under pressure, and adjust to organizational change.
Emotional intelligence may contribute to the quality of people’s relationships at work because emotions serve communicative and social functions, conveying information about thoughts and intentions, and helping to coordinate social encounters10. Emotion related abilities should help people choose the best course of action when navigating social encounters. For example, the ability to decode facial expressions of emotion can help one to evaluate how other people respond to one’s words and actions, yielding important information for adjusting one’s behavior11. The ability to use emotions to guide thinking can help one to
ISSN: 2306-9007 Collins & Mirriam (2016) 1270
I
www.irmbrjournal.com December 2016I
nternationalR
eview ofM
anagement andB
usinessR
esearchVol. 5 Issue.4
R
M
B
R
Analysis of the Current Situation and Study Objectives
In the early and late 1990s, workers and managers at the company shared good work relations and mutual respect for one another and output in terms of employee performance and company earnings correlated. Employees were outstanding in their individual efforts and collectively produced beyond expectation for
the company12 Performance assessments recommended promotion and increase in salary notches for many
employees and the company experienced growth in profits and infrastructure. An average manager would be elderly supervising a crop of young energetic and ambitious trained and untrained individuals. The work pressure and demands were well manageable with low domestic demand for power but major demand from industry and the mining sector13.
However, in early 2000s, the company experienced an upswing in the demand for power from domestic consumers and industry and this phenomenon resulted in change of response to operations by the company. The company rolled out a prepaid meter installation project because domestic demand for power suddenly increased mainly because of the euphoria in construction in brown fields and upgrade and demarcation of existing housing units due to increase in population per housing unit. The company business model changed from push to pull (chasing customers to pay to customers chasing prepaid vouchers) and this
situation demanded a shift in the way of managing employee-manager relationship. 14One researcher
indicated that a shift in the business model of any company should be followed by a check of emotional intelligence of employees and managers to achieve a balance that will support the new business model.
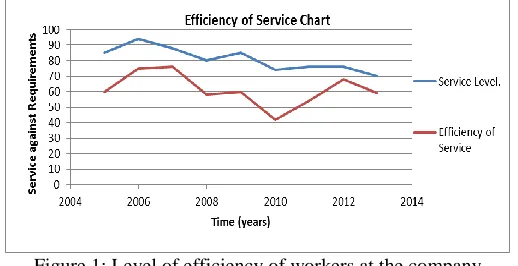
The company received on average of 1,117,413 faults from the technical part of the business from 2005 to
2008 which indicated a 62% efficiency of service15This result fell by 2% between 2009 and 2013 to 60%16.
However, analysis of performance from the support part of the business indicated an average of 67% efficiency of performance from the employees between 2005 and 2008 whereas the 2014 report indicated 59 % exhibiting a drop by 8%. A combination of the assessments from the two arms of the business indicated an average of 60% performance rate by the employees in the company.
Further, following the 2010 report on low employee performance in the company, the company engaged MAC Training of South Africa to provide training in interpersonal relations and management effectiveness from which the training company observed a medium emotional intelligence of managers measured from a self-assessment questionnaire triangulated by an intelligence test. Figure 1 below exhibits the level of performance of employees at the company represented by Efficiency of Service curve against the demand curve represented by the Serve Level curve.
Figure 1: Level of efficiency of workers at the company
ISSN: 2306-9007 Collins & Mirriam (2016) 1271
I
www.irmbrjournal.com December 2016I
nternationalR
eview ofM
anagement andB
usinessR
esearchVol. 5 Issue.4
R
M
B
R
Therefore, the researchers undertook to establish if there is a relationship between emotional intelligence of managers and employee performance at the power company and establish the most significant aspect of emotional intelligence from Goleman’s model.
Literature Review
Introduction
The experts in the field of emotional intelligence have offered definitions and models to understand the concept of emotional intelligence and its impact on employee and manager’s life and work. The theory of emotional intelligence is developed and conceptualized into three models namely ability model, traits model and mixed model.
17Emotional intelligence is the ability to accurately identify and understand one’s own emotional reactions
and those of others. It also involves the ability to regulate one’s emotions to use them to make good decisions and to act effectively. Further, 18emotional intelligence as being concerned with effectively understanding oneself and others, relating well to people and adapting to and coping with the immediate surroundings to be more successful in dealing with environmental demands.
Managers and Emotional Intelligence
Many authors believe that EI is critical for leaders19. The higher the position, the more crucial EI becomes. In the case of leadership positions, it accounts for about 85% of all the competencies needed to be successful.Emotional intelligence not only allows one to predict a leader’s performance but also to
recognise development areas and make decisions about hiring or promoting in the work context20
In the classic study21 in 1982 conducted on over 2000 leaders, middle managers and executives, 14 out of
16 competencies which separated top from average performers were emotional competencies. Another example is a study that analysed almost 300 companies. Eighteen out of 21 competencies specified in the generic models of the companies researched, and which discriminated between top and average performers, were EI competencies. EI is therefore vital to leaders’ success and job performance22.
Ways of Measuring Emotional Intelligence
In response to the excitement over Emotional Intelligence (EI), several measures of EI have been developed. The measures vary in their definition of emotional intelligence as well as their format. The biggest distinction related to the definition of EI is between self-report measures (Emotional Quotient Inventory [EQ-i], Emotional and Social Competence Inventory [ESCI]), which are strongly related to traditional personality measures, versus the only non-self-report measure, the Mayer, Salovey, Caruso Emotional Intelligence Test (MSCEIT). MSCEIT scores are based on performance on a variety of tasks that require various forms of emotional intelligence. Correct answers are based on experts’ decisions or, alternatively, on popular consensus
The Emotional and Social Competence Inventory (ESCI) was recently developed to replace the Emotional Competence Inventory (ECI). The ESCI is a 72 item self-report measure that assesses 12 competencies organized into four clusters: Self-Awareness, Self-Management, Social Awareness, and Social Skills.
Theoretical Framework
ISSN: 2306-9007 Collins & Mirriam (2016) 1272
I
www.irmbrjournal.com December 2016I
nternationalR
eview ofM
anagement andB
usinessR
esearchVol. 5 Issue.4
R
M
B
R
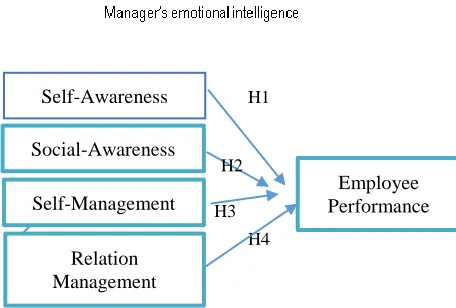
the independent variables and employee performance represent the dependent variable. These four constructs are modelled to influence the performance of the employee measured from the ability to achieve targets. From this model, the researchers drew the following hypotheses:
Figure 2: Conceptualized research model
H11: A managers' self-awareness has an influence on employee performance
H21: A managers' self-management has an influence on employee performance
H31: A managers' social awareness has an influence on employee performance
H41: Relationship management of a manager has an influence on employee performance
Research Design and Data Collection
To achieve the objectives of the research, a descriptive and explanatory research design was appropriate. During this research, the main data set was primary data but triangulated with secondary data.
The company provided a population of 530 potential respondents hence a sampling design based on Yamane’s formula was used given by;
Where n is the sample size, N is the population size, and e is the level of precision which was set at 0.05 (5%) with a confidence level of 95%.
Applying the formula to derive the sample size gave the following;
Therefore, the researchers used a sample of 228 employees. However, the population of relevant managers was determined to be 44 with respect to the number of departments. The researchers used both qualitative and quantitative data collected using questionnaires and historical records. Structured questionnaires with a Likert scale of 1 to 7 were distributed by email to managers and to some employees using the local area network for the organization whereas employees without intranet access received questionnaires physically. Data analysis was done using regression in SPSS.
Self-Awareness
Social-Awareness
Self-Management
Relation Management
Employee Performance
H1
H2
H3
ISSN: 2306-9007 Collins & Mirriam (2016) 1273
I
www.irmbrjournal.com December 2016I
nternationalR
eview ofM
anagement andB
usinessR
esearchVol. 5 Issue.4
R
M
B
R
To ensure the statistical and practical significance of the correlation and regression results, the probability value p=≤0.05 (at 95%) was evaluated. The results of this study were compared with other relevant research findings reviewed in literature.
Results and Discussions
Managers’ rating on self-awareness, assessment and confidence
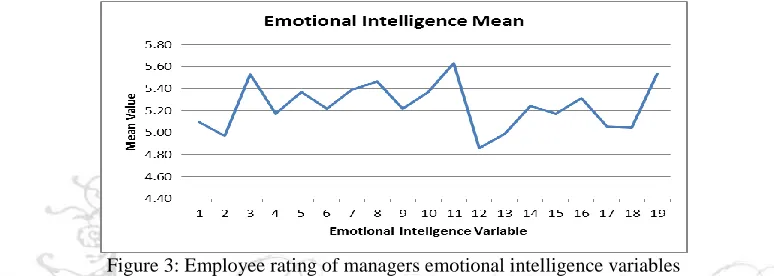
The employee average rating of managers’ self-awareness, self-assessment and self-confidence is good with no significant deviation from the mean with an exception of point 12 which shows a significant drop as shown in figure 3.
Figure 3: Employee rating of managers emotional intelligence variables
Further, the performance self assessment by employees shows that the managers emotional intelligence brings out a good deal of performance attributes from within the employees except for the non job attribute which yields a mean slightly below five as shown in Figure 4.
Figure 4: Self assessment of performance by employees
Responses from managers on the performance rating of their employees show an average of 5.4 which corresponds to good on the Likert scale of one to seven with little deviation from the mean
Descriptive statistics of emotional intelligence variables
a) Descriptive Statistics for Quantitative Variables under Self awareness
ISSN: 2306-9007 Collins & Mirriam (2016) 1274
I
www.irmbrjournal.com December 2016I
nternationalR
eview ofM
anagement andB
usinessR
esearchVol. 5 Issue.4
R
M
B
R
and the kurtosis ranged from 0.047 to 1.078. This shows that, the skewness and kurtosis of all the items were within the range of -2 and +2. The results indicate that all the variables did not seriously deviate from normality.
The employees rated emotional self awareness of managers above average at 4.9 close to 5 which is equivalent to good on the likert scale and the same applies to self assessment of managers. However, the managers' self confidence scored a higher mean of 5.5 but with higher standard deviation, skew and kurtosis. The data above indicates that emotional intelligence is present in managers and that self awareness is a good part of it. Table 3 below exhibits the output from the software;
Descriptive Statistics for Quantitative Variables under Self Management
The employees rated emotional self control of managers above good at 5.17 which is equivalent to good on the likert scale and the same applies to the rest of the variables. However, the managers' achievement drive scored a higher mean of 5.46. The data indicates that emotional intelligence is present in managers and that self management is a good part of it. The skewness and kurtosis of all the items were within the range of -2 and +2. The results indicate that, all the variables did not seriously deviate from normality
Descriptive Statistics for Quantitative Variables under Social Awareness
The mean ranged from 5.37 to 5.88 while the standard deviation ranged from 1.282 to 7.126; Skewness ranged from -1.046 to 9.633 and the kurtosis is ranged from 1.07 to 97.006. This shows that the skewness and kurtosis of service orientation and organizational awareness were within the range of -2 and +2 while empathy showed a very high deviation from the mean and high skwewness to the right. The results indicate a serious deviation from normality on empathy factor while service orientation and organisational awareness did not show serious deviation from normality.
Descriptive Statistics for Quantitative Variables under Relationship Management
The mean ranged from 4.84 to 5.47 while the standard deviation ranged from 1.352 to 1.55; Skewness ranged from -0.437 to -1.130 and the kurtosis ranged from -0.527 to 0.819. This showed that, the skewness and kurtosis of all the items were within the range of -2 and +2. The results indicate that all the variables did not seriously deviate from normality. The employees rated the relationship management of their managers well above average with developing other ability scoring the least at 4.84 and team work scoring the highest at 5.47. The mean of means is 5.2 which place the relationship aspect at good affirming the presence of relationship management in the emotional intelligence of managers.
Descriptive Statistics for Quantitative Variables of Employee Performance
The employees rated their performance above good with a mean of means of 5.3 indicating that being supervised by a manager with good emotional intelligence results into good performance. In coming up with these calculation, the seven point (1-7) Likert Scale Format was used. This was then translated into a mean of 4 equivalent to average (i. e. the median from the scale).
ISSN: 2306-9007 Collins & Mirriam (2016) 1275
I
www.irmbrjournal.com December 2016I
nternationalR
eview ofM
anagement andB
usinessR
esearchVol. 5 Issue.4
R
M
B
R
Descriptive Statistics of Factors Affecting Emotional Intelligence of Managers
The mean ranged from 2.03 to 5.93 while the standard deviation ranged from 1.461 to 1.847; Skewness ranged from -1.798 to -0.137 and the kurtosis ranged from -0.9 to 3.447. This shows that the skewness and kurtosis of all the items were within the range of -2 and +4. The results indicate that some of the variables skewed to the right of the normal curve.
However, heredity factor scored a mean of 5 representing much on the Likert scale and kurtosis and skewness were within -1.0 and +1.0 showing normality. This means that heredity factors affect the emotional intelligence of managers at the company. On the contrary, the health status and income level of managers are indifferent seeming not to have influence on the emotional intelligence from the mean score of 2.03 and 3.97 respectively representing 'no influence to neutral'. Job competency and education scored a mean of 5.5 showing movement towards 'slightly much' while personality yielded 5.9 mean showing a strong indicator of slightly much influence on emotional intelligence of managers. Relationship with peers and subordinates yielded means of just about 5.0 with kurtosis and skewness been within -1.0 and +1.0 exhibiting no serious deviation from normality.
Data Analysis with Multiple Regression
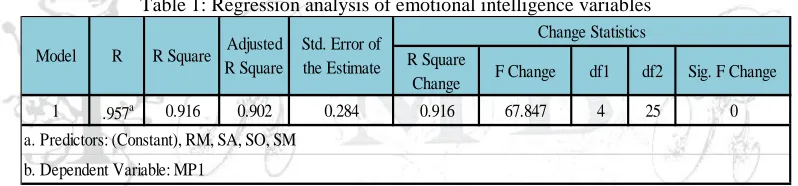
A multiple regression was performed with the employee performance as the dependent variable and managers’ self-awareness, self-management, social awareness and relationship management as independent variables. The output from this analysis is shown in table 1 below.
Table 1: Regression analysis of emotional intelligence variables
In statistics and regression in particular, the coefficient of determination, denoted R2 or r2 and pronounced R squared, is a number that indicates how well data fits a statistical model – sometimes simply a line or curve. It is a statistic used in the context of statistical models whose main purpose is either the prediction of future outcomes or the testing of hypotheses as it is in this case, on the basis of other related information. R2 is a statistic that will give some information about the goodness of fit of a model. In regression, the R2 coefficient of determination is a statistical measure of how well the regression line approximates the real data points. An R2 of 1 indicates that the regression line perfectly fits the data. R2 is often interpreted as the proportion of response variation "explained" by the regressors in the model. Thus, R2 = 1 indicates that the fitted model explains all variability in y-the dependent variable, while R2 = 0 indicates no 'linear' relationship (for straight line regression, this means that the straight line model is a constant line (slope = 0, intercept = ) between the response variable and regressors). In this case, a interior value such as R2 = 0.916 may be interpreted as follows: "Ninety two percent of the variance in the response variable can be explained by the explanatory variables. The remaining thirty percent can be attributed to unknown, lurking variables or inherent variability."
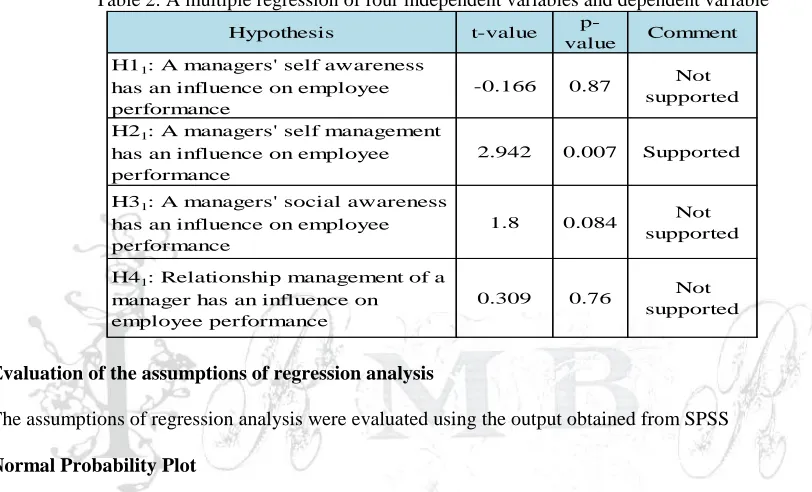
Further, table 2 indicates that, there was no significant relationship between managers self-awareness and the employee performance (t = -0.166, p > 0.1). The zero-order correlation between managers awareness and employee performance was -0.888 which dropped to -0.01 controlling for managers self-management, social awareness and relationship management. Thus, hypothesis 1 was not supported. Additionally, the table indicates that there was no significant relationship between managers social
R Square
Change F Change df1 df2 Sig. F Change
1 .957a 0.916 0.902 0.284 0.916 67.847 4 25 0
a. Predictors: (Constant), RM, SA, SO, SM
b. Dependent Variable: MP1
Model R R Square Adjusted R Square
Std. Error of the Estimate
ISSN: 2306-9007 Collins & Mirriam (2016) 1276
I
www.irmbrjournal.com December 2016I
nternationalR
eview ofM
anagement andB
usinessR
esearchVol. 5 Issue.4
R
M
B
R
awareness and employee performance (t = 1.8, p > 0.05). The zero-order correlation between the managers’ social awareness and employee performance was 0.932 which dropped to 0.105 controlling for managers self-awareness, self-management and relationship management. Thus, hypothesis 3 was not supported.
Finally, table 2 indicates that there was no significant relationship between managers relationship management and employee performance (t = 0.309, p > 0.1). The zero-order correlation between the managers relationship management and employee performance was 0.879 which dropped to 0.018 controlling for managers self-awareness, self-management and social awareness. Thus, hypothesis 4 was not supported.
Table 2: A multiple regression of four independent variables and dependent variable
Evaluation of the assumptions of regression analysis
The assumptions of regression analysis were evaluated using the output obtained from SPSS
Normal Probability Plot
Assumption of normality of error terms were met as. The plot shows that most of the data points are close to the diagonal line. This implies that the error terms are not deviating very much from normality as shown in figure 5.
Figure 5: Probability plot of the multiple regression Residue Plot
The distribution of error terms above and below the zero line is even and random as indicated in figure 5. Assumption of homoscedasticity has not been violated. The assumption of the independence of the error terms have been met as shown in the figure 5.
H11: A managers' self awareness
has an influence on employee performance
-0.166 0.87 Not
supported
H21: A managers' self management
has an influence on employee performance
2.942 0.007 Supported
H31: A managers' social awareness
has an influence on employee performance
1.8 0.084 Not
supported
H41: Relationship management of a
manager has an influence on employee performance
0.309 0.76 Not
supported
Hypothesis t-value
ISSN: 2306-9007 Collins & Mirriam (2016) 1277
I
www.irmbrjournal.com December 2016I
nternationalR
eview ofM
anagement andB
usinessR
esearchVol. 5 Issue.4
R
M
B
R
Partial Regression Plot
The assumption of linearity for all the four independent variables against the dependent variable were met as shown in figure 5.
Conclusion
This research tried to determine if there is a relationship between emotional intelligence of managers and employee performance. The results from table 2 indicated that there is a relationship between emotional intelligence of managers and employee performance. However, only self-management of managers was significant. The statistical tests proved that there is a relation between emotional intelligence of managers and employee performance and that the managers trustworthiness and adaptability to work situations triggers employee commitment and drive to performance.
It can therefore be concluded that the emotional intelligence of managers is not independent of employee performance rather affects employee performance in a positive way. It can further be concluded that managers scoring high in self-control, trustworthiness, conscientiousness, adaptability and achievement drive are more likely to influence employees to perform to desirable levels.
The results indicate, for example, that emotionally intelligent managers develop emotional attachment to their work and in turn affect employee performance. Selecting managers who have high emotional intelligence may have a positive impact on the extent to which an organization succeeds in retaining its most critical workforce. Emotional intelligence may help an individual to better handle demanding managerial work.
Acknowledgment
The researchers thank the members of staff at the power company that participated in the research as well as the senior managers that allowed for the study to be undertaken. Further, gratitude goes to the individual
employees who spared their valuable time to respond to the questionnaires.
References
Brackett M.A, Mayer J.D, Warner R.M. (2004). Emotional intelligence and its relation to everyday behavior. Person. Individual Diff., 36: 1387- 1402.
Bar-On and J. D. A. Parker (Eds.) (2000) The Handbook of emotional intelligence: Theory, development, assessment, and application at home, school, and in the workplace, (pp. 363-388). San Francisco, CA. Boyatzis, R., Goleman, D. and Rhee, K. (1998) Clustering competence in emotional intelligence: insights
from the emotional competence inventory (ECI).
Davidson, Janet E., and C. L. Downing. "Contemporary models of intelligence." Handbook of intelligence (2000): 34-49.
Goleman, D. (1995) Emotional intelligence. (1st Ed.) New York: Bantam. (Chapter 1).
Law K.S, (2004). The effects of emotional intelligence on job performance and life satisfaction for the research and development scientists in China. Asia Pacif. J. Manage., 25(1): 51-69
Lopes, P. N., Grewal, D., Kadis, J., Gall, M., and Salovey, P. (2006). Evidence that emotional intelligence is related to job performance and affect and attitudes at work. Psicothema, 18(1), 132–138.
Mayer J. D., Geher, G (1996). "Emotional Intelligence and the Identification of Emotion, "Intelligence, 22(2): 89-113.
ISSN: 2306-9007 Collins & Mirriam (2016) 1278
I
www.irmbrjournal.com December 2016I
nternationalR
eview ofM
anagement andB
usinessR
esearchVol. 5 Issue.4
R
M
B
R
Mayer, J. D., Salovey, P. (1993). The intelligence of emotional intelligence. Intelligence, 17,433–442. (Chapter 8)
Nowicki, S. and Duke, M.P., 2001. Nonverbal receptivity: The Diagnostic Analysis of Nonverbal Accuracy (DANVA).
Rahim, S. H. and Malik, M.I. (2010) Emotional intelligence and organisational performance: A case study of banking sector in Pakistan, International Journal of Business and Management, 5 (10): 191-197. Riggio, R.E. and Lee, J., 2007. Emotional and interpersonal competencies and leader development. Human
Resource Management Review, 17(4), pp.418-426.
Spencer, L.M. Jr. and Spencer, S.M (1993). Competence at work: Models
Seibert, Scott E., Maria L. Kraimer, and Robert C. Liden. "A social capital theory of career success." Academy of management journal 44.2 (2001): 219-237.Keltner, D., and Haidt, J. (2001). Social functions of emotions.
ZESCO Annual Report (2013a) ZESCO Annual Report (2013b)
Goleman D., (2006). Emotional Intelligence, 10th Anniversary ed., Bantam Books, New York. ZECSO Annual Report (2010)