INTRODUCTION
The influence of trace concentrations of copper in steel has been investigated by Kramer, Siegel and Brooks.1They found that copper in small amounts has a considerable influence on the hardenability of steel. They stated that as little as 0.1% copper increases the hardenability by 17%. It has been shown quite conclusively that small additions of copper to unalloyed wrought steels, considerably improves their resistance to atmospheric corrosion.2,3,4 The presence of copper in steel does not retard the initial rate of atmospheric corrosion, in fact, the corrosion rate is not appreciably retarded until a copper or copper oxide film is formed on the surface by preferential dissolution of iron. It is interesting to know that only relatively small amount of copper is necessary to enhance the resistance to atmospheric corrosion. It has also been claimed that paint adheres better
Materials Science Research india Vol. 4(1), 77-86 (2007)
Determination of copper trace in steel by direct method
using atomic absorption spectrophotometry
N. GHARIB NASERI
Ahwaz Faculty of Petroleum Engineering, Petroleum University of Technology (Iran)
(Received: May 20, 2007; Accepted: June 28, 2007) ABSTRACT
The trace concentrations of copper in several British steel samples and standards have been investigated in this research by direct method using hydrochloric and nitric acid mixture, and sulphuric acid, Phosphoric acid and water mixture. Three standard steels containing copper in the range of 0.13% - 0.39% were used. These were low alloy steel B.C.S. No. 257/1 (0.13% Cu), carbon steel B.C.S. No. 239/2 (0.18% Cu) and alloy steel B.C.S. No. 253/1 (0.39% Cu). The dissolution procedure of steels, led to a solution which was analysed directly by atomic absorption spectrophotometry. Absorption due to copper was measured at 324.8 nm by atomizing the solution in a 10 cm slot burner using an air-acetylene flame with air flow rate 5.2 L/min and acetylene flow rate 1.2 L/min and operating the hollow cathode lamp at 5 mA. Burner height was set at point 6. The appropriate calibration solutions were aspirated, followed by the sample solutions. Water was aspirated between each test when the zero was checked. The copper content of the sample solutions were read from the calibration graphs. The absorption of each solution measured at least three times. The results obtained in this research for copper content of steel samples indicate that a mixture of hydrochloric and nitric acids is to be preferred as the solvent medium, especially when iron is added to the standard solutions, when the copper contents found are near to the certificate values.
Keywords: Copper, copper trace, steel, direct method, atomic absorption spectrophotometry.
has no appreciable influence on the rate of solution of steel in various salt solutions (Tables 1 and 2).
Copper is an important element in ferrous metallurgy and many methods of quantitative analysis have been developed. Classical schemes use gravimetric,8 volumetric,8,9 and electrometric methods which in comparison with other analytical methods are tedious and less accurate. Instrumental techniques including colorimetry,10 photometry,11and spectrophotometry12 have been widely used and are more sensitive for the determination of copper in
steel. Of these, colorimetric methods suffer from the general disadvantage that it is often difficult to isolate absorption due to copper from absorption due to the matrix. Walsh13 indicated that atomic absorption spectroscopy is practically free from interferences and this technique has been applied to the determination of copper in agricultral14,15 and metallurgical16,17 materials. Wallace18 in 1961 obtained high results forg copper in steel using an air-acetylene flame and dissolving the sample in hydrochloric acid. Since then Beyer19, Knight20, Nall et al21, and Gidley et al22 have determined copper
Table -2: %Weight composition of elements found in the steels used in the work
Steel %C %Si %Mn %Cr %Ni %Cu
type
Steel A 0.16 0.28 0.17 12.1 0.44 0.08 Steel B 0.22 0.28 0.17 12.1 0.47 1.20 Table -1. Effect of Copper on the resistance of
Chromium Steel to acid corrosion.7
Acid Concentration Duration of Loss (g.m2.hr-1) % attack (hour) Steel Aa Steel Bb
Sulphuric 5 7 22.1 10.5
Sulphuric 35 6 265.0 45.0
Sulphuric 50 6 8.8 6.4
Hydrochloric Normal 7 5.8 1.8
Nitric Normal 6 7.1 7.6
Acetic 5 24 0.32 0.16
in steel and have shown that the analysis was simple and free from interferences. Although in 1964 Kinson and Belcher12and Spraque et al.23in their determination of small amounts of copper in steel by atomic absorption spectrophotometry found a small depressive effect of iron on copper absorption, they indicated that the interference could be overcome by using either standard steel or pure iron added to aqueous copper solutions for the calibration. Thomeson and Price24 discovered that the presence of 1% of iron depressed the copper absorption in perchloric acid by about 10%, but satisfactory results were obtained when iron was incorporated in the calibration standards.
EXPERIMENTAL
The work reported here has been carried out using an E.E.L. 240 Mark I atomic absorption spectrophotometer manufactured by Evan Electro-Selenium Ltd., of Halstead, Essex, England. Two separate burners are provided; one for the air/
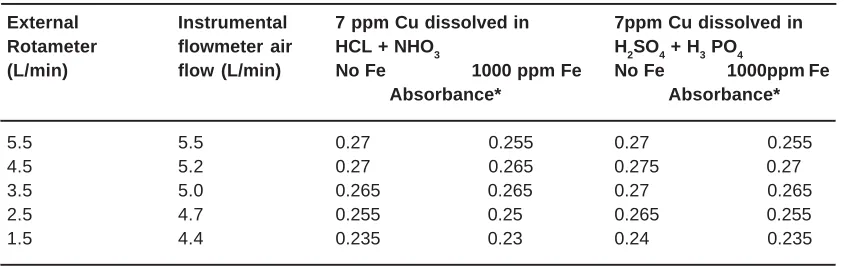
Effect of fuel/oxidant ratio on copper absorption The flowmeter incorporated in the E.E.L. 240 instrument is small and relatively insensitive to changes in the flow rate of air. In order to measure this effect more accurately, a more sensitive rotometer was introduced into the air supply line. This meter, however, was sensitive to the pulsation from the compressor and no steady reading could be obtained. A series of results were obtained by using compressed air from a cylinder. Tables 3 and 4 summarize the absorbance values obtained when solutions prepared from the stock solutions containing 7 ppm copper were aspirated into the flame and the flow rate of fuel and oxidant was varied. From the graphs 1 and 2 the optimum sensitivity was obtained at air flow rate 4.5 L/min and fuel flow rate 1.2 L/min. It is apparent that the presence of iron affects the absorbance.
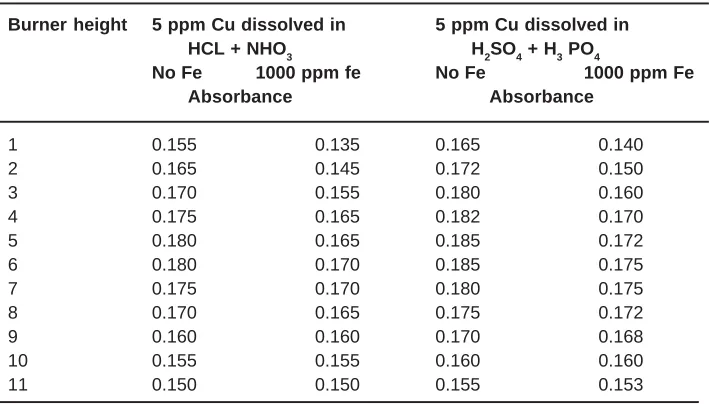
Effect of burner height on copper absorbance To investigate the effect of burner height on the copper signal, the solutions of pure copper dissolved in each acid mixture were aspirated into the flame and the burner height was varied as given in Table 5. Graph number 4.3 shows the effect of burner height on Cu absorbance and it is clear that the maximum sensitivity for all solutions was obtained at point 6.
Effect of iron on copper absorbance
The effect of different iron concentrations on the absorbance of copper was investigated by addition of a constant concentration of copper to a series of iron (as pure iron) solutions of increasing concentration as shown in Table 5. The absorption by copper was measured for these solutions using different flame conditions, the results are given in
Graph -1: Effect of acetylene flow rate on copper absorption
Graph -2: Effect of air flow rate on copper absorption
Table 5. The conclusion from this experiment is that the presence of iron can apparently suppress or enhance the copper absorbance depending upon the air/fuel ratio. This effect is virtually eliminated with an air flow rate of 4.5 L/min and an acetylene flow rate of 1.2 L/min and these conditions were used in the subsequent experiments with the standard steels.
Preparation of the steel sample solutions; dissolution using hydrochloric and nitric acids The weight of samples selected for the three standard steels was that which gave a final solution containing approximately 6 ppm copper. These were 0.5 g of steel B.C.S. No. 257/1 (0.13% Cu), 0.3 g carbon steel B.C.S. No. 239/2 (0.18% Cu) and 0.15 g alloy steel B.C.S. No. 253/1 (0.39% Cu). Appropriate samples of the steels were accurately weighed and transferred to 100 mL
beakers and dissolved in 15 mL of HCl and HNO3 acid mixture (HCl, sp. gr. 1.18, HNO3, sp. gr. 1.42 in the ratio of 4:1 v/v, respectively). The solutions were heated on a hot plate until all reactions had ceased and a clear solution was obtained. It was necessary to filter the solutions of steel B.C.S. No. 253/1 in order to remove precipitated silica. The solutions were quantitatively transferred into 100 mL volumetric flasks. After cooling, the samples were diluted to volume with distilled water. These solutions were then aspirated directly into the flame and the absorption due to copper measured. The results are given in Table 3.
Preparation of the steel sample solutions; dissolution using phosphoric and sulphuric acids
A similar procedure to that above was carried out to dissolve the steel samples in 18 mL
Table -3: Variation of air flowmeter at acetylene flow rate 1.2 L/min.
External Instrumental 7 ppm Cu dissolved in 7ppm Cu dissolved in
Rotameter flowmeter air HCL + NHO3 H2SO4 + H3 PO4
(L/min) flow (L/min) No Fe 1000 ppm Fe No Fe 1000ppm Fe
Absorbance* Absorbance*
5.5 5.5 0.27 0.255 0.27 0.255 4.5 5.2 0.27 0.265 0.275 0.27 3.5 5.0 0.265 0.265 0.27 0.265 2.5 4.7 0.255 0.25 0.265 0.255 1.5 4.4 0.235 0.23 0.24 0.235 * Absorbances are average of three readings.
Table - 4: Variation of acetylene flowmeter at air flow rate 4.5 L/min Instrumental 7 ppm Cu dissolved in 7ppm Cu dissolved in flowmeter air HCL + NHO3 H2SO4 + H3 PO4
flow (L/min) No Fe 1000 ppm Fe No Fe 1000 ppm Fe
Absorbance Absorbance
1.0 0.230 0.195 0.24 0.215 1.2 0.248 0.223 0.25 0.23 1.5 0.285 0.265 0.28 0.27a 2.0 0.290 0.275 0.285 0.28a * Absorbances are average of three readings.
of the sulphuric acid, phosphoric acid and water mixture (sulphuric acid, sp. gr. 1.84, phosphoric acid, sp. gr. 1.75 and water in the ratio of 1:1:4, respectively). When the reaction had ceased, nitric acid was added dropwise to oxidize carbides and to clarify the solution. After filtration of silica when necessary the solutions were transferred to 100 mL graduated flasks and diluted to volume with distilled water. These solutions were then aspirated directly into the flame and the absorption due to copper measured. The results are given in Table 4. Preparation of stock solutions
Stock solutions containing 500 ppm copper and 10,000 ppm iron were prepared for each of the acid mixtures in exactly the same way as those of the preparation of the steel sample solutions described above (in 4 and 5). These stock solutions
were further diluted in order to make the range of stock solutions needed for calibration.
Preparation of working standard solutions Separate working standards were made for each of the two acid mixtures used above, and for each acid mixture, two sets of standards were prepared. One set consisted of mixed acid solutions containing copper from 2-10 ppm. The other set of working standards, at the same levels as the first set, contained in addition 1000 ppm iron.
Analysis of the sample solutions by atomic absorption spectrophotometry
Each of the prepared solutions was analysed by comparing the absorption for each sample against that obtained by the calibration solutions. Graphs were prepared of absorbance
Table - 5: Effect of Iron on copper absorbance at various air flow rate. Air flow (external rotometer) L/minute 5.5 4.5 3.5 2.5 1.5
Solutions Absorption
5 ppm Cu + 0 ppm Fe 0.178 0.178 0.178 0.170 0.155 5 ppm Cu + 1000 ppm Fe 0.178 0.178 0.185 0.175 0.157 5 ppm Cu + 2000 ppm Fe 0.175 0.180 0.188 0.178 0.160 5 ppm Cu + 3000 ppm Fe 0.173 0.180 0.190 0.185 0.161 5 ppm Cu + 5000 ppm Fe 0.170 0.178 0.192 0.186 0.165 Acetylene flow constant at 1.2 L/min.
Table - 6: Effect of burner height on copper absorbance Burner height 5 ppm Cu dissolved in 5 ppm Cu dissolved in
HCL + NHO3 H2SO4 + H3 PO4
No Fe 1000 ppm fe No Fe 1000 ppm Fe
Absorbance Absorbance
1 0.155 0.135 0.165 0.140 2 0.165 0.145 0.172 0.150 3 0.170 0.155 0.180 0.160 4 0.175 0.165 0.182 0.170 5 0.180 0.165 0.185 0.172 6 0.180 0.170 0.185 0.175 7 0.175 0.170 0.180 0.175 8 0.170 0.165 0.175 0.172 9 0.160 0.160 0.170 0.168 10 0.155 0.155 0.160 0.160 11 0.150 0.150 0.155 0.153
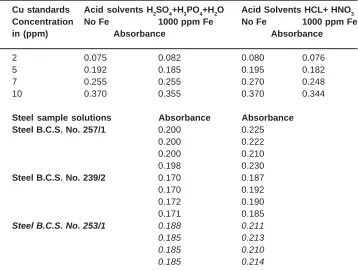
Table - 7: Absorption values for copper content of steels samples and standards*
Cu standards Acid solvents H2SO4+H3PO4+H2O Acid Solvents HCL+ HNO3
Concentration No Fe 1000 ppm Fe No Fe 1000 ppm Fe
in (ppm) Absorbance Absorbance
2 0.075 0.082 0.080 0.076
5 0.192 0.185 0.195 0.182
7 0.255 0.255 0.270 0.248
10 0.370 0.355 0.370 0.344
Steel sample solutions Absorbance Absorbance
Steel B.C.S. No. 257/1 0.200 0.225
0.200 0.222
0.200 0.210
0.198 0.230
Steel B.C.S. No. 239/2 0.170 0.187
0.170 0.192
0.172 0.190
0.171 0.185
Steel B.C.S. No. 253/1 0.188 0.211
0.185 0.213
0.185 0.210
0.185 0.214
Each reading of absorption is the average of at least three determinations.
versus concentration and from these, the concentration of the copper in the sample solutions was determined and subsequently the percentage by weight of the copper in the original sample. Calibration Graphs
To provide the calibration graphs, first the approximate concentration of copper in each steel sample was calculated, second the concentration range of the copper standards were prepared. The appropriate calculations were made, for example for a steel containing 0.13% of copper, the concentration in ppm of copper, Cs , in 0.5 g portion of steel in 100 mL was obtained by the relation: Cs = 0.13 × 0.5 × 1,000,000 = 6.5 ppm 100 100
Thus, the range of concentration of the copper standard series was prepared to be: 2, 5, 7 and 10 ppm. The aim was to have the concentration
in the sample in the mid-range of the calibration. Similar calculations were made for each sample. Instrumental settings
Table - 8: Calculated values of the copper content in steels samples by weight in HCl + HNO3 mixture.
Steel Certificate Standard without Fe Standard With Fe
Samples Value Found Value% difference Found Value% difference
B.C.S. 0.13 0.015 -0.015 0.125 -0.005
No. 257/1 0.13 0.113 -0.017 0.123 -0.007
0.13 0.107 -0.023 0.114 -0.016
0.13 0.118 -0.012 0.128 -0.002
B.C.S 0.18 0.158 -0.022 0.172 -0.008
No.239/2 0.18 0.163 -0.017 0.176 -0.004
0.18 0.160 -0.020 0.175 -0.005
0.18 0.156 -0.024 0.170 -0.010
B.C.S 0.39 0.356 -0.034 0.390 -0.000
No. 253/1 0.39 0.360 -0.030 0.393 +0.003
0.39 0.356 -0.034 0.386 -0.004
0.39 0.363 -0.027 0.396 +0.006
Table - 9: Calculated values of the copper content in steels samples by weight in H2SO4 + H3PO4
Steel Certificate Standard without Fe Standard With Fe
Samples Value Found Value% difference Found Value% difference
B.C.S. 0.13 0.107 - 0.023 0.107 - 0.023
No. 257/1 0.13 0.107 - 0.023 0.108 - 0.022
0.13 0.107 - 0.023 0.108 - 0.022
0.13 0.106 - 0.024 0.108 - 0.022
B.C.S. 0.18 0.150 - 0.030 0.152 - 0.028
No. 239/2 0.18 0.150 - 0.030 0.152 - 0.028
0.18 0.152 - 0.028 0.154 - 0.026
0.18 0.152 - 0.028 0.153 - 0.027
B.C.S. 0.39 0.333 - 0.057 0.336 - 0.054
No. 253/1 0.39 0.330 - 0.060 0.333 - 0.057
0.39 0.330 - 0.060 0.333 - 0.057
0.39 0.330 - 0.060 0.333 - 0.057
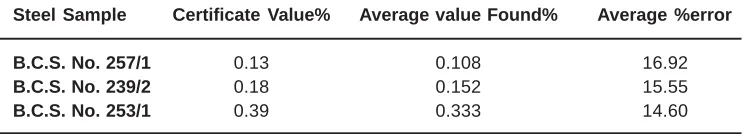
Table - 10: Values for %error in H2SO4 + H3PO4 mixture in the presence of iron Steel Sample Certificate Value% Average value Found% Average %error
B.C.S. No. 257/1 0.13 0.108 16.92
B.C.S. No. 239/2 0.18 0.152 15.55
B.C.S. No. 253/1 0.39 0.333 14.60
RESULTS AND DISCUSSION
Before any attempt was made to determine copper in steel, a series of preliminary experiments were carried out to find out how the different variables discussed by other workers affected the absorption of copper. These indicated that the air/fuel ratio, the concentration of iron and the acidity of the test solution could affect the absorption due to copper. The ratio of fuel to oxidant gas is one of the parameters which have important effects on the copper absorbance as used in atomic
Burnter Height
Graph - 3: Effect of burner height on copper absorption
Copper concentration ppm
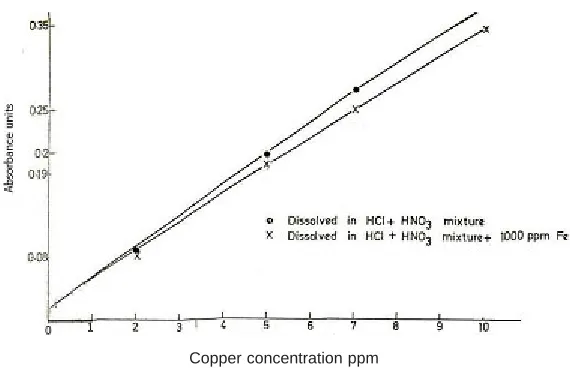
Graph - 4: Calibration graphs using copper standard withand without iron
was obtained at point 6. The effect of different iron concentrations on the absorbance of copper was also investigated by addition of a constant concentration of copper to a series of iron (as pure iron) solutions of increasing concentration as shown in Table 5. The conclusion from this experiment is that the presence of iron can apparently suppress or enhance the copper absorbance depending upon the air/fuel ratio. This effect is virtually eliminated with an air flow rate of 4.5 L/min and an acetylene flow rate of 1.2 L/min and these conditions were used in the subsequent experiments with the standard steels. Preliminary work in this project showed that atomization of an aqueous solution of the sample prepared by dissolution in an acid mixture was simple and rapid but was not as accurate as expected.
Kinson and his co-workders12dissolved their steel samples in a mixture of H3PO4, H2SO4 and H2O (4.5:4.5:91 v/v/v, respectively). The samples were then oxidized by dropwise addition of nitric acid. However, it was found in this work that this mixture did not dissolve all of the copper in the samples, but by increasing the acid content to a (1:1:4 v/v/v, respectively) mixture of phosphoric acid, sulphuric acid and water, complete solution was obtained. The method proposed by Beyer19in which steel was dissolved in hydrochloric acid (1:1 v/v) followed by oxidation with nitric acid, also did not completely dissolve the steels in this work.
However, a mixed acid solution containing 20% nitric acid and 80% hydrochloric acid by volume as proposed by Sabina Spraque and Slavin23was successfully used to dissolve the samples.
Four separate samples of each of the standards were dissolved in each of the acid mixtures according to the procedure given in experiment 9. The copper absorption of each of these standard steel samples was compared with those obtained for standard copper solutions in the presence or absence of iron. Table 7 gives the absorption value for the calibration solutions and the four determinations for each steel sample solution. A typical calibration graph is also shown in Graph 4 and in Graph 5. From the results shown in table 7, four calibration graphs were drawn and the experimental values of the copper content of the steels were calculated for each solvent medium. These results are shown in tables 8 and 9. From table 9 it is apparent that with a mixture of sulphuric and phosphoric acids, the addition of iron to standards makes little difference to the results obtained for the copper absorbance. The percentage error for each sample has been calculated and is shown in Table 10. From Table 10, it can be seen that the percentage error is almost the same over the range of copper content of the steel samples used. On the other hand with a mixture of hydrochloric and nitric acids, the addition of iron to the standards gives more accurate results
Copper concentration ppm
Graph - 5: Calibration graphs using copper standard with and wihtout iron
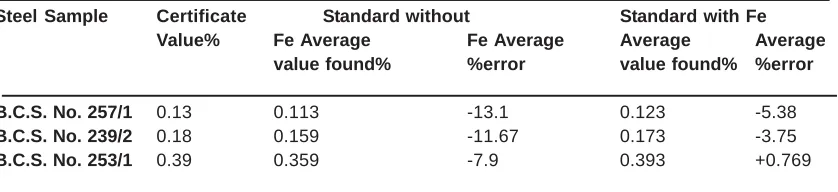
for copper absorbance (Table 8), but even with no iron present in the standards, the results are better than with a mixture of sulphuric and phosphoric acids. Also in hydrochloric and nitric acids, the percentage error varies with the copper content of steel samples (as shown in Table 11) and is less for higher concentrations.
The results obtained in this research for copper content of steel samples indicate that a mixture of hydrochloric and nitric acids is to be preferred as the solvent medium, especially when iron is added to the standard solutions, when the copper contents found are near to the certificate values.
1. Kramer IR, Siegel S and Brooks JG, A.I.M.E., Tech. Pub. 2029. Metals Tech., June (1946.). 2. Daeves K, Gas- U. Wasserfach, 1941, 84, 718; Chemical Abstracts, 37, Part II, 2496 (1943).
3. Reprot of committee A-5 on Corrosion of Iron and Steel, Proc. Am. Soc. Testing Materials, 41, 96 (1941).
4. Taylerson ES, J. Iron Steel Inst., 143, 287 (1941).
5. Gregg JL and Danlloff BN, “Alloys of Iron and Copper”, McGraw Hill Book Company, Inc., New York, (1934).
6. Rolls R and Preece A, “Metal Treatment and Drop Forging”, 139 (1960).
7. Monypenny JHG, “Stainless Iron and Steel”, John Wiley and Sons Inc., New York, (1931). 8. A.S.T.M., “Methods of Chemical Analysis of
Metals”, E30 (1960).
9. British Standard, 1121, part 14, (1956). 10. Sandel EB, “Colorimetric Determination of
Traces of Metals”, 2nd edition, Interscience Publishers, Inc., New York, (1950).
11. Dean JA and Lady JH, Anal. Chem., 27,
REFERENCES
1533 (1955).
12. Kinson K and Belcher CB, Anal. Chim. Acta, 31, 180 (1964).
13. Walsh A, Spectrochim. Acta, 7, 108 (1955). 14. David DJ, Analyst, 83, 655 (.1958)
15. Allan JE, Spectrochim. Acta, 17, 459 (1961). 16. Stumpe KE and Gonsior T, Colloquim Spectroscopium. Internationale IX, Lyons, (1961).
17. Wallace FJ, Hilger J., 7, 65 (1963). 18. Wallace FJ, Foseco Dev., 7, 54 (1961). 19. Beyer M, Atomic Absorption Newsletter, 4,
212 (1965).
20. Knight DM and Pyzyna MK, Atomic Absorption Newsletter, 8, 129 (1968). 21. Nall WR, Brumhead D and Whitham R,
Analyst, 100, 555 (1974).
22. Elwell WT and Gidley JAF, Atomic Absorption Spectrophotometry”, 2nd edition, Pergamon Press, Oxford, London, p. 68 (1966). 23. Slavin W and Sprague S, Atomic Absorption
Newsletter, 3, 72 (1964).
24. Thomerson DR and Price WJ, Analyst, 96, 825 (1971).
Table - 11: Values for %error in HCl + HNO3
Steel Sample Certificate Standard without Standard with Fe
Value% Fe Average Fe Average Average Average
value found% %error value found% %error
B.C.S. No. 257/1 0.13 0.113 -13.1 0.123 -5.38
B.C.S. No. 239/2 0.18 0.159 -11.67 0.173 -3.75
B.C.S. No. 253/1 0.39 0.359 -7.9 0.393 +0.769
An alternative approach was therefore to use a solvent extraction technique to separate the copper in the solution from iron before determination