Published online May 30, 2014 (http://www.sciencepublishinggroup.com/j/ijiis) doi: 10.11648/j.ijiis.20140301.12
Processing overlapped cells using k-means and
watershed
Faten Faraj Abushmmala
1, Fadwa Faraj Abushmmala
21Computer Science Engineering Department, Islamic University (IUG)
,Gaza, Palestine
2Industrial Engineering Department, Islamic University (IUG)
,Gaza, Palestine
Email address:
[email protected] (F. F. Abushmmala), [email protected] (F. F. Abushmmala)
To cite this article:
Faten Faraj Abushmmala, Fadwa Faraj Abushmmala. Processing Overlapped Cells Using K-Means and Watershed. International Journal of Intelligent Information Systems. Vol. 3, No. 1, 2014, pp. 8-12. doi: 10.11648/j.ijiis.20140301.12
Abstract:
Processing overlapped cells are tricky process especially when an automatic computerized system deals with 2D images of cells needed to be processed in biomedical filed, if these cells are overlapped this might give the impression and wrong indication of abnormality presence. In this paper a methodology are suggested and implemented to separate the overlapped from non-overlapped cells giving as a result two groups (clusters) for each. And we try to give an estimation of numbers of cells that overlapped under the microscope, the success rates of separating the two clusters (overlapped and non overlapped cells) are 100% while the success rate of the estimating the number of correct cells that overlapped compared with medical personal point view are 79.3%.Keywords:
Image Processing, K-Means, Blood Cells, Clustering, Watershed1. Introduction
Our bodies contain about 5 liters of blood (about 7% of our body). Of average 5 liters of blood, only 2.25 liters (45%) consist of cells [1]. The laboratory work that goes into the study of blood is frequently performed by a medical technologist "Hematologist". The blood cells shapes examined by the hematologist viewed in the blood films under the microscope. Since there is many attempts to recognize blood cells and to count them, a persist need appears to separate overlapped cells from individual cells using computers. Counting cells of overlapped cells is extremely helpful in case of overlapped red blood cells, this helps in getting the blood indices. Red blood cell indices are measurements that describe the size and oxygen-carrying protein (hemoglobin) content of red blood cells. The indices are used to help in the differential diagnosis of anemia. They are also called red cell absolute values or erythrocyte indices. Computer-aided diagnosis [2] is important application of pattern recognition, aiming at assisting doctors in making diagnostic decisions. The final diagnosis is, of course, made by the doctor. Computer-assisted diagnosis has been applied to and is of interest for a variety of medical data, such as X-rays, computed tomographic images, ultrasound images, electrocardiograms (ECGs), and electroencephalograms (EEGs). The need for a computer-aided diagnosis stems from
the fact that medical data are often not easily interpretable, and the interpretation can depend very much on the skill of the doctor.
In [3] " Object Localization in medical images using genetic algorithm " where the red blood cells clustered into two classes: overlapped and non overlapped cells where the proposed system success rate was 94%, this system needs a large number of param0eters to work properly which is considered a disadvantage, but in this paper [4] the red blood cells segmented away from other types of cells using deformable template model with at least 95% efficiency. Other papers like [5] recognize the red blood cells from other types of cells using genetic algorithm using only two features line segments and angle of the line segment where worst case scenarios give 94% success rates.
This paper [6] proposed a system created to process an image given as an input. The proposed system uses the separability filter in [7] to obtain the best object candidates and next, this system uses Circular Hough Transform (CHT) to detect the presence of circular shape. In this work two different techniques used to take advantages from the peculiarity of each of them The highest success rate of the proposed system to detect the objects was 96% and the worst success rate was 80%.
two classes: overlapped and non overlapped cells where the proposed system success rate was 94%, this system needs a large number of parameters to work properly which is considered a disadvantage.
Our proposed methodology suggested in this paper is much easier, much simpler, consumes less time and have higher success rate than what proposed in [3].
1.1. K-Means
The K-Means algorithm, first developed four decades ago [8], is one of the most popular centre-based algorithms that attempts to find K clusters which minimize the mean squared quantization error, MSQE. The K-Means algorithm implementation in many data-mining or data analysis software packages [9-12].
The algorithm tries to locate K prototypes (centroids) throughout a data set in such a way that the K prototypes in some way best represent the data. A summarization of the K-Means algorithm through the following steps [8]: 1. Initialization
a) Define the number of prototypes (K).
b) Designate a prototype (a vector quantity that is of the same dimensionality as the data) for each cluster. 2. Assign each data point to the closest prototype. That data
point is now a member of the class identified by that prototype.
3. Calculate the new position for each prototype (by calculating the mean of all the members of that class). 4. Observe the new prototypes' positions. If these values
have not significantly changed over a certain number of iterations, exit the algorithm. If they have, go back to step 2.
The main problem of the K-Means algorithm [13] is its dependency on the prototypes' initialization. If the initial prototypes are not chosen carefully the computation will run the chance of converging to a local minimum rather than the global minimum solution. Thus initializing prototypes appropriately can have a big effect on K-Means. The performance function for K-Means may be written as:
(1)
Unfortunately there is no general theoretical solution to find the optimal number of clusters for any given data set. A simple approach is to compare the results of multiple runs with different k classes and choose the best one according to a given criterion, but we need to be careful because increasing k results in smaller error function values by definition, but also an increasing risk of overfitting.
1.2. Watershed
Watershed algorithm is a powerful mathematical morphological tool for the image segmentation [14][15]. It is extremely popular. Rarely papers that needs image processing techniques don't include image morphological
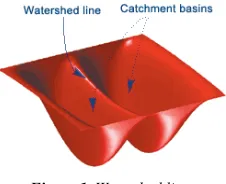
operations. Watershed algorithm specially popular in the fields like biomedical, medical image segmentation and computer vision. It is based on the geography. Image is taken as geological landscape check figure 1; the watershed lines determine boundaries which separate image regions. The watershed transform computes catchment basins and ridgelines, where catchment basins are correspond to image regions and ridgelines relating region boundaries [15], [16]. The concept of watersheds [17] is based on visualizing an image in three dimensions: two spatial coordinates versus gray levels. In such a "topographic" interpretation, we consider three types of points: (a) points belonging to a regional minimum; (b) points at which a drop of water, if placed at the location of any of those points, would fall with certainty to a single minimum; and (c) points atwhich water would be equally likely to fall to more than one such minimum.
Figure 1. Watershed line.
For a particular regional minimum, the set of points satisfying condition (b) is called the catchment basin or watershed of that minimum. The points satisfying condition (c) form crest lines on the topographic surface and are termed divide lines or watershed lines. The principal objective of segmentation algorithms based on these concepts is to find the watershed lines check figure 3.1. The basic idea is simple: Suppose that a hole is punched in each regional minimum and that the entire topography is flooded from below by letting water rise through the holes at a uniform rate. When the Segmentation rising water in distinct catchment basins is about to merge, a dam is built to prevent the merging flooding will eventually reach a stage when only the tops of the dams are visible above the water line. These dam boundaries correspond to the divide lines of the watersheds. Therefore, they are the (continuous) boundaries extracted by a watershed segmentation algorithm. This segmentation based on three principal concepts: (a) detection of discontinuities, (b) thresholding, and (c) region processing. Segmentation by watersheds embodies many of the concepts of the three approaches and, as such, often produces more stable segmentation results, including continuous segmentation boundaries. This approach also provides a simple framework for incorporating knowledge-based constraints.
1.3. Distance Transformer
specifies the distance from each pixel to the nearest non-zero pixel. Distance transforms play a central role in the comparison of binary images, particularly for images resulting from local feature detection techniques such as edge or corner detection. Note that the authors in [18] and [19] papers uses distance transforms as a comprising techniques for binary images. Distance transforms are also used to compute and calculate the medial axis of some shapes in [20]
A distance transform [17], also known as distance map or distance field, is a derived representation of a digital image. The choice of the term depends on the point of view on the object in question: whether the initial image is transformed into another representation, or it is simply endowed with an additional map or field.
The map labels each pixel of the image with the distance to the nearest obstacle pixel. A most common type of obstacle pixel is a boundary pixel in a binary image. See the image for an example figure 2 of a chessboard distance transform on a binary image.
Figure 2. Distance transformation.
Figure 3. Example of applying distance transformation on binary image (a) Binary Image, (b) Distance Transformation of the binary image.
There is a dual to the distance transform described above which produces the distance transform for the background region rather than the foreground region. It can be considered as a process of inverting the original image and then applying the standard transform as above.
2. Methodology
The overlapped cells in case of computerized automatic diagnosis system mistakenly can considered as an abnormal cells, so we need to cluster (or separate) the overlapped cells from the non-overlapped cells. We use the K-means clustering technique to do such, The suggested features we fed to the K-means to accomplish such task are:
-The object size (number of pixels in each object). -The maximum distance between any two pixels (Euclidean distance used).
(2)
-The maximum distance between the median point (centroid point of the object) and any other pixel in the object (Euclidian distance used).
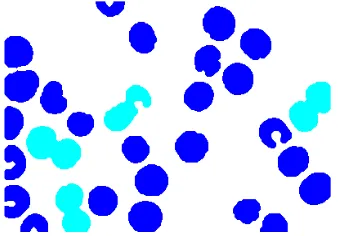
Applying equation 1 on our blood films images, we have two clusters, shown in figure 4, overlapped cells in bright blue and non-overlapped cells in dark blue.
Figure 4. Clustering of overlapped/non-overlapped cells.
Each shape (object) is resized to fix size before the previous features are taken and before clustering operation is done. The result from such modification produces stable result after executing the code at any number of times, i.e. the stability is achieved, as shown in figure 4, no matter how many times the code is run or whatever the blood film (abnormal or normal cases) the result is the same. The success rate for such clustering was 100%. The number of blood films images in hand are 100 images.
Figure 5. The final result from clustering process overlapped cells in dark blue / non-overlapped cells in bright blue .
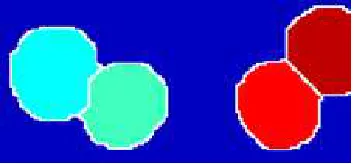
Figure 6. Watershed morphological operation: (a) overlapped cells. (b) Segmented overlapped cells using watershed.
By zooming in for one overlapped cells object, figure 7, we will find that there are several segmentation lines in between the two overlapped cells, which indicate improper segmentation. The solution for such problem is to enhance (or more accurate filter) the image in the grey level before converting it to binary image in the first place.
Figure 7. Two Overlapped cells.
The image filtered using smoothing edge filter then we reapply watershed which enhance the result as illustrated in figure 8.
Figure 8. Overlapped cells after smoothing filter.
3. Results and Discussion
The set of images in hand are 100 images of blood films,. the images converted to binary images (black and white) and then resized to one common size which is the average size of the total images set sizes.
First we separated the overlapped cells form non overlapped cells using K-means clustering techniques, the feature feds into the K-means in order to give the two clusters deducted from the overall observation of the cells, where overlapped cells generally tend to be bigger than normal and abnormal single cells,. Clustering theses shapes into two categories( Overlapped and non overlapped) gives a success rate 100%. Check figure 5.
After the preceding clustering process, we obtained 150 overlapped objects or shapes. We asked a hematologist to give an estimation by eye for the actual number of cells for
each object. Images converted from RGB space to grey level to be able to apply smoothing filter on these images. After that we converts the result images into binary images (0, 1). A distance transformer applied to these objects (in binary, black and white) and then we used the watershed morphological operation to segments the overlapped objects into smaller objects (segments) , then we count these small objects which we considered as parts of the actual cells that overlapped.
(a) (c) (e) (j)
(b) (d) (f) (h)
Figure 9. These simple cases of objects of overlapped cells segmented correctly.
These simple cases of objects indicated in figure 9 of overlapped cells filtered using smoothing filter then distance transformer applied then segmented using watershed morphological operation segmented correctly.
(a) (c) (e) (j)
(b) (d) (f) (h)
Figure 10. These complex cases of objects of overlapped cells segmented correctly.
These complex cases of objects shown in figure 10 of overlapped cells filtered using smoothing filter then distance transformer applied then segmented using watershed morphological operation were segmented perfectly.
(a) (c) (e) (j)
(b) (d) (f) (h)
Figure 11. These complex cases of objects of overlapped cells segmented mistakenly.
We have a total of 150 objects (overlapped clusters) 119 object were segmented correctly according to the hematologist point view. The success rate was 79.3%.
4. Conclusion
In this paper we worked on 100 blood films images of red blood cells. First we separate overlapped cells from non overlapped cells on these images. In the process of clustering overlapped form non overlapped cells the success rate reaches 100% for our data (images), this process cost no time, including the process of extracting the features. The proposed clustering mechanism can handle other features as a basis for the clustering process which can be customized based on the application in hand. At the end we have two sets of shapes overlapped and non overlapped cells. We get an 150 shapes (overlapped cells). We apply smoothing filter on these shapes at the grey level then a distance transformer on the binary representation of these objects, after that a watershed morphological operation applied giving segments . We consider each segment as a cell of the overlapped cells. This process named as estimation process of number of cells. The success rate for this estimating process and for our data set the success rate reaches 79.3%. notice that is hard sometime to the eye of human being to recognized the number of actual cells that overlapped so this result can vary from person eye to another.
References
[1] J. H. Carr, Bernadette F. Rodak, Clinical hematology Atlas, Saunders Elsevier, 3rd Ed, 2009, pp.222-230.
[2] S. Theodoridis and K. Koutroumbs, " Pattern Recognition," Elsevier Inc.Academic Press, 4th Ed, 2009.
[3] G. Karkavitsas and M. Rangoussi, "Object Localization in medical images using genetic algorithm, " World academy of Science, Engineering and Technology, vol. 2, pp. 6-9, Feb. 2005.
[4] P.J.H. Bronkorsta a, M.J.T. Reinders b, E.A. Hendriks b, J. Grimbergen a, R.M. Heethaar c, G.J. Brakenho, "On-line detection of red blood cell shape using deformable Templates,
" Elsevier Science, vol. 3, pp. 413-424, Jan. 2000.
[5] E. Ozcan and C. K. Mohan, " Partial shape matching using genetic algorithms, " Elsevier Science, vol.18, Oct. 1997.
[6] M. Rizon, H.Yazid, P. Saad, A. Yeon Md Shakaff, A. Saad , M. Sugisaka, S. Yaacob, M.Rozailan Mamat and M. Karthigayan. " Object Detection using Circular Hough Transform," American Journal of Applied Sciences, vol.12, pp 1606-1609, Jan. 2005.
[7] K. Fukui and O. Yamaguchi, "Facial feature points extraction method based on combination of shape extraction and pattern matching," Trans. IEICE, Vol.8, pp.2170-2177, 1997.
[8] J. MacQueen. "Some methods for classification and analysis of multivariate observations". Proceedings of the fifth Berkeley symposium on mathematical statistics and probability, pages 281–297, 1967
[9] SPSS Clementine Data Mining System. User Guide Version 5, 1998 (Integral Solutions Limited, Basingstoke, Hampshire).
[10] DataEngine 3.0 – Intelligent Data Analysis – an Easy Job, Management Intelligenter Technologien GmbH, Germany, 1998; http://www.mitgmbh.de.
[11] Kerr, A., Hall, H. K., and Kozub, S. Doing Statistics with SPSS, 2002 (Sage, London).
[12] S-PLUS 6 for Windows Guide to Statistics, Vol. 2, Insightful
Corporation, Seattle, Washington, 2001;
http://www.insightful.com/DocumentsLive/23/44/statman2. pdf.
[13] W. Barbakh, Ying Wu, and Colin Fyfe. "Non-standard parameter adaptation for exploratory data analysis" (2009), University of the west of Scotland, Scotland ISBN: 978-3-642-04004-7.
[14] Allaoui, A. E. (2012). Medical Image Segmentation by Marker-Controlled Watershed and Mathematical Morphology. International Journal of Multiledia and Its Applications (IJMA), 1-9
[15] Ng, H. P. (2006). Medical Image Segmentation using K-Means Clustering and Improved Watershed Algorithm.
Image Analysis and Interpretation, 2006 IEEE (pp. 61-65). Symposium: IEEE.
[16] Zhang, X. (2010). An Image Segmentation Method Based on Improved Watershed Algorithm. International Conference on Computational and Information Sciences (pp. 258-261). Chengdu, China: IEEE
[17] R. Gonzalez and R. Woods Digital Image Processing, Addison-Wesley Publishing Company, 1992, pp 518 – 548.
[18] G. Borgefors. Hierarchical chamfer matching: A parametric edge matching algorithm. IEEE Transactions on Pattern Analysis and Machine Intelligence, 10(6):849–865, November 1988.
[19] D. Huttenlocher, G. Klanderman, and W. Rucklidge. Comparing images using the hausdorff distance. IEEE Transactions on Pattern Analysis and Machine Intelligence, 15(9):850–863, September 1993.