http://www.sciencepublishinggroup.com/j/acm doi: 10.11648/j.acm.20180703.19
ISSN: 2328-5605 (Print); ISSN: 2328-5613 (Online)
Application of Classifiers in Predicting Problems of
Hydropower Engineering
Liming Huang
1, Yi Chen
2, *, Chunyong She
1, Yangfeng Wu
1, Shuai Zhang
21
Quality and Safety Inspection Center of Hydropower Engineering of Zhejiang Province, Hangzhou, China 2School of Information, Zhejiang University of Finance and Economics, Hangzhou, China
Email address:
*
Corresponding author
To cite this article:
Liming Huang, Yi Chen, Chunyong She, Yangfeng Wu, Shuai Zhang. Application of Classifiers in Predicting Problems of Hydropower Engineering. Applied and Computational Mathematics. Vol. 7, No. 3, 2018, pp. 139-145. doi: 10.11648/j.acm.20180703.19
Received: June 24, 2018; Accepted: July 12, 2018; Published: July 19, 2018
Abstract:
It’s of vital importance to supervise hydropower engineering in order to make better use of water resources. To supervise it efficiently and effectively, it’s advisable to predict potential problems of hydropower engineering beforehand, after which the people concerned can inspect problems accordingly. Due to the complexity and large quantity of data, data mining techniques are indispensable and useful when making predictions. This study compares performance of Random Forest, C4.5 and Naïve Bayes on the basis of accuracy, precision, recall and F-measure. It comes out that Random Forest is more suitable for this problem. For purpose of more precise results, numbers of trees and features are determined in advance before constructing the forest. Furthermore, which feature influences the prediction result most is also investigated.Keywords:
Data Mining, Prediction, Classification Models, Hydropower Engineering Supervision1. Introduction
Nowadays, with the development of hydropower engineering supervision techniques, Department of Water Resources has obtained abundant regulatory data of water conservancy. However, such records of supervision processes independently don’t provide supervisors with clear and concise information to monitor hydropower engineering efficiently and effectively. Meanwhile, data mining techniques have been increasingly mature and important in discovering hidden knowledge behind various complicated data, which fortunately enables water conservancy regulators to utilize the data in a better manner.
Data mining incorporates many methods such as classification, clustering, association rules and so on. This study focuses on predicting possible problems of certain hydropower engineering on the basis of classification models. R, a powerful software, is chosen to conduct experiments.
The remainder of this study is organized as follows. Section 2 shows related work of data mining techniques and hydropower engineering. Section 3 introduces data
preprocessing and the modeling method. Experimental results are analyzed in Section 4. In Section 5, conclusion of this study and future work are presented.
2. Related Work
identification results. Su et al. (2018) extended Support Vector Machine and proposed a prediction model of dam deformation.
From the previous discussion, it’s obvious that few researchers focus eyesight on the various problems of hydropower engineering with utilization of data mining techniques. Consequently, this study is intended to predict problems of water conservancy projects and reminds the people concerned of careful inspection with the help of data mining technology.
3. Method
3.1. Data Preprocessing
The data used in this study is acquired from a quality inspection center of hydropower engineering in China. The dataset includes 10695 instances with 18 features and 1 predictive label, namely, problems of hydropower engineering. The raw data integrates literal data and numeric data, meanwhile, there are some outliers and missing values. Therefore, it’s of great necessity to preprocess the raw data in order to obtain satisfactory results.
What this study mainly do in this step are as follows: 1. Deleting unnecessary and unavailable features
In the raw data, the feature that doesn’t influence problems of hydropower engineering will be deleted, e.g., “the name of hydropower engineering”. What’s more, one of repeated features is omitted. For example, “code of administrative division” represents “the location of project”, thus, one of
them is removed. In addition, “the description of fact” is unstructured data, which is beyond the range of this study, hence, it’s also removed.
2. Creating new features
There are some features which are not significant individually, however, combination of them will create a valuable feature. “time interval” is a combined feature, which can be resulted by subtracting “commence time of the project” from “recording time of the problem”.
3. Handling outliers
Owing to human errors, there might be some unreasonable figures. Quartile is applied to analyze such figures. It turns out that there exists an extremely strange number of “approval period of the preliminary design report”, 20151118. To address this problem, outliers is considered as missing data and then the nearest neighbor interpolation technique (Altman, 1992) is applied. Firstly, k nearest neighbors of missing values are identified based on Euclidean distance. Then, the predictive value of missing data is calculated based on values of its neighbors weighted by inverse distances. Finally, missing values are replaced by predictive values.
4. Transforming the literal data to numeric data
It’s difficult to deal with literal data in the classification models, hence, literal data is transformed to numeric data for simplicity.
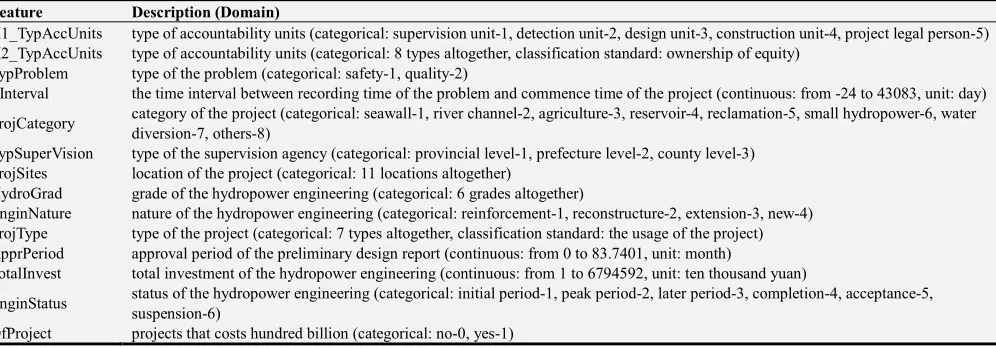
In summary, details of the selected features are described in Table 1, and Table 2 presents detailed explanations of the predictive label-problem.
Table 1. The description of selected features.
Feature Description (Domain)
X1_TypAccUnits type of accountability units (categorical: supervision unit-1, detection unit-2, design unit-3, construction unit-4, project legal person-5) X2_TypAccUnits type of accountability units (categorical: 8 types altogether, classification standard: ownership of equity)
TypProblem type of the problem (categorical: safety-1, quality-2)
TInterval the time interval between recording time of the problem and commence time of the project (continuous: from -24 to 43083, unit: day)
ProjCategory category of the project (categorical: seawall-1, river channel-2, agriculture-3, reservoir-4, reclamation-5, small hydropower-6, water diversion-7, others-8)
TypSuperVision type of the supervision agency (categorical: provincial level-1, prefecture level-2, county level-3) ProjSites location of the project (categorical: 11 locations altogether)
HydroGrad grade of the hydropower engineering (categorical: 6 grades altogether)
EnginNature nature of the hydropower engineering (categorical: reinforcement-1, reconstructure-2, extension-3, new-4) ProjType type of the project (categorical: 7 types altogether, classification standard: the usage of the project) ApprPeriod approval period of the preliminary design report (continuous: from 0 to 83.7401, unit: month)
TotalInvest total investment of the hydropower engineering (continuous: from 1 to 6794592, unit: ten thousand yuan)
EnginStatus status of the hydropower engineering (categorical: initial period-1, peak period-2, later period-3, completion-4, acceptance-5, suspension-6)
OfProject projects that costs hundred billion (categorical: no-0, yes-1)
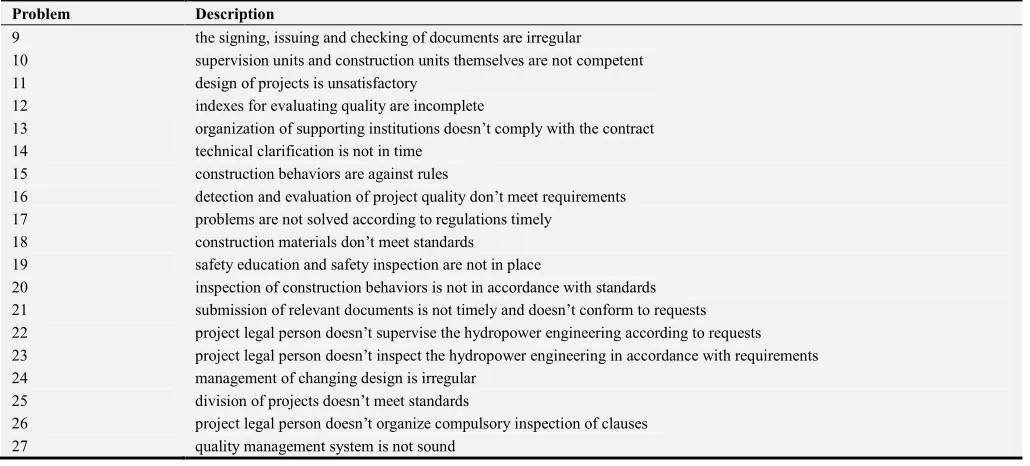
Table 2. The descriptions of problems.
Problem Description
1 safety management systems and institutions are not satisfactory
2 detection units entrusted by supervision units and construction units are not qualified 3 analysis of quality data doesn’t comply with standards or is not in time
Problem Description
9 the signing, issuing and checking of documents are irregular 10 supervision units and construction units themselves are not competent 11 design of projects is unsatisfactory
12 indexes for evaluating quality are incomplete
13 organization of supporting institutions doesn’t comply with the contract 14 technical clarification is not in time
15 construction behaviors are against rules
16 detection and evaluation of project quality don’t meet requirements 17 problems are not solved according to regulations timely
18 construction materials don’t meet standards 19 safety education and safety inspection are not in place
20 inspection of construction behaviors is not in accordance with standards 21 submission of relevant documents is not timely and doesn’t conform to requests 22 project legal person doesn’t supervise the hydropower engineering according to requests 23 project legal person doesn’t inspect the hydropower engineering in accordance with requirements 24 management of changing design is irregular
25 division of projects doesn’t meet standards
26 project legal person doesn’t organize compulsory inspection of clauses 27 quality management system is not sound
3.2. Modeling Method
Given that it’s of great possibility that different accountability units will face same problems in the same project, a definite id is designed for a particular project. To verify accuracy rates of models, the dataset is randomly divided into two parts, 70% of which is training data and 30% is testing data, on the condition that instances with the same id are separated into the same sub-dataset. Reason for such a step is to avoid excessive similarity between an instance in the testing data and one in the training data. For fear of sampling error, such random division is repeated 30 times.
In this study, Random Forest (RF) (Ho, 1998) is utilized to predict underlying problems of hydropower engineering, which is characterized by intelligibility and high accuracy. Owing to its advantages, RF is widely used for classification and regression.
RF is one of ensemble learning approaches. It establishes a forest by combining different decision trees randomly, and
there is no relationship among decision trees. For a classification problem, n trees in RF will generate n different classification results, which is ensembled by RF at last, and then RF defines the final class based on proportion. The rules of how to establish a forest are as follows: For every tree, training samples is extracted randomly and retrievably from training data. Thus, although the training set for every tree is different, it contains repeated samples. What’s more, the trees split by choosing best attributes in m features, in which m is determined in advance. The framework of RF is presented in Figure 1.
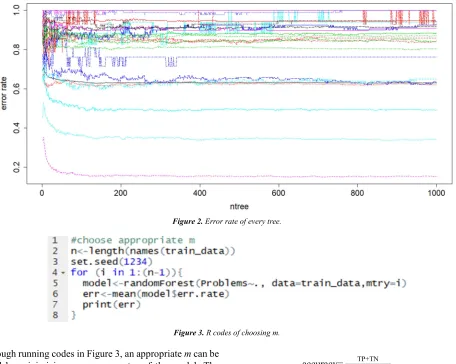
What needed to define before applying RF are how many trees in the forest and an appropriate m. Figure 2 and Figure 3 show preparations before experiments. Figure 2 illustrates error rate of every tree in the forest. With the increase of the number of trees (ntree), error rates become gradually stable. When ntree tends to 1000, error rates don’t fluctuate extensively on the whole. Consequently, ntree is set as 1000.
Figure 2. Error rate of every tree.
Figure 3. R codes of choosing m.
Through running codes in Figure 3, an appropriate m can be defined by minimizing mean error rates of the model. The influence of choosing m is shown in Table 3. Apparently, selecting a proper m does influence the performance of RF, reducing out-of-bag error. In this study, m is set as 3.
Table 3. Contrast of choosing an appropriate m or not.
m Out-of-bag error
not specifically chosen 63.05%
m=3 62.95%
4. Experimental Results
4.1. Model Evaluation
To assess the performance of RF, this study compares RF with C4.5 and Naïve Bayes (NB) based on several evaluation indexes, namely, accuracy, precision, recall and F-measure.
According to the description of Stehman (1997), The confusion matrix is illustrated in Table 4. In the case of dichotomies, the formulas of accuracy, precision, recall and F-measure are presented as equation (1)-(4).
Table 4. Confusion Matrix.
True condition
positive negative
Predicted condition
positive True Positive (TP) False Positive (FP) negative False Negative (FN) True Negative (TN)
accuracy= TP+TN
TP+FP+FN+TN (1)
precision=TP+FPTP (2)
recall= TP
TP+FN (3)
F-measure=1/precision+1/recall2 (4)
F-measure is the harmonic mean of precision and recall. If one of precision and recall is low, the F-measure will be low. F-measure emphasizes that as much as possible instances are predicted positively, at the same time, as much as possible predictively positive instances are truly positive. For a classification model, F-measure is more likely to be selected to balance the evaluation results. For multi-class problem, precision, recall and F-measure of each class are calculated, converting a multi-class problem to the combination of dichotomies.
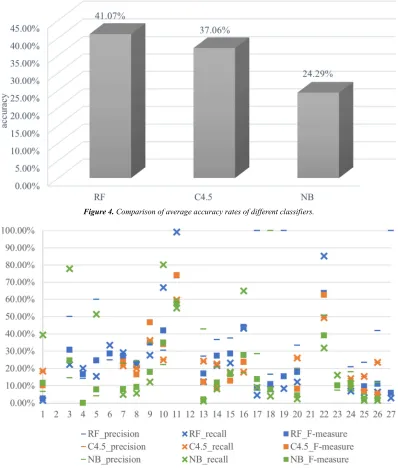
Figure 4. Comparison of average accuracy rates of different classifiers.
Figure 5. Precision, recall and F-measure of different classifiersFigure 5 shows precision, recall and F-measure of classifiers. To calculate precision, recall and F-measure, this study chooses predictions of classification models which accuracy rates are similar to the average under the premise of same division of training data and testing data. In Figure 5, different colors represent different models, more specifically, the green represents NB, the orange represents C4.5, and the blue represents RF. Additionally, the mark shapes represent different evaluation indexes, in other words, short dash means precision, cross means recall and square means F-measure.
From Figure 5, it can be concluded that RF performs better than other classification models in general. Furthermore, for problems #2, #12 and #21, no classification models forecast correctly. In addition, overall, classifiers perform well when predicting problems #11 and #22.
4.2. Importance of Features
RF provides access to measure how important the features are. It ranks the significance by Mean Decrease Gini index (Breiman et al., 1984). In a classification problem, for a given sample set D with T classes to be predicted, suppose
i 1,2,…,T , the probability of a sample belonging to the ith class is pi, Gini index is defined as equation (5).
Gini(D)=∑iT=1pi 1-pi =1-∑Ti=1pi2 (5) Gini (D) reflects the probability of such situation that two samples extracted from set D belong to different predictive class. That is to say, the lower Gini(D) is, the purer sample set is. Therefore, after constructing classification trees based on certain features, the corresponding features are significant if Gini (D) decreases a great deal.
one applied to calculate precision, recall and F-measure.
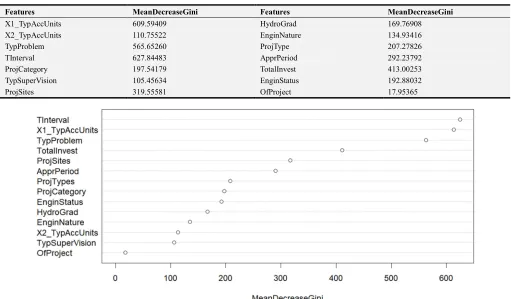
Table 5. Importance of features.
Features MeanDecreaseGini Features MeanDecreaseGini
X1_TypAccUnits 609.59409 HydroGrad 169.76908
X2_TypAccUnits 110.75522 EnginNature 134.93416
TypProblem 565.65260 ProjType 207.27826
TInterval 627.84483 ApprPeriod 292.23792
ProjCategory 197.54179 TotalInvest 413.00253
TypSuperVision 105.45634 EnginStatus 192.88032
ProjSites 319.55581 OfProject 17.95365
Figure 6. Importance of features.
Table 5 and Figure 6 demonstrate the importance of features. From Table 5 and Figure 6, it’s apparent that the time interval between recording time of the problem and commence time of the project is the most important feature when making the prediction, followed by X1_TypAccUnits.
5. Conclusion
Hydropower engineering is significant for utilizing water resources efficiently. Thus, it’s of great importance to forecast potential problems of hydropower engineering. Before applying classification models, some necessary preparations are made in advance, deleting and adding features, handling outliers and transforming literal data to numeric one. Then Random Forest (RF) is utilized to predict the problem. To obtain more accurate results, this study determines number of trees in the forest and m features by which trees split beforehand. What’s more, random repeated experiments are also applied. According to experimental results, RF performs better than C4.5 and NB in the multi-class classification problem of water conservancy supervision. Furthermore, time interval and type of accountability units are important features which have strong effects in prediction. In other words, when predicting problems of the water conservancy projects, it’s worthy to pay attention to these features. This study provides supervisors with powerful tools, with which people can focus and inspect corresponding problems on the basis of prediction
results.
Nevertheless, there is still some room for improvement. In the future, it’s recommended to apply advanced and extended algorithms to improve the accuracy of the prediction.
References
[1] Altman, N. S. (1992). An introduction to kernel and nearest-neighbor nonparametric regression. American Statistician, 46 (3), 175-185.
[2] Breiman, L., Friedman, J., Olshcn, R. A., et al. (1984). Classification and regression trees. Monterey, CA: Wadsworth & Brooks/Cole Advanced Books & Software. ISBN 978-0-412-04841-8.
[3] Deng, W., Wang, G., & Zhang, X. (2015). A novel hybrid water quality time series prediction method based on cloud model and fuzzy forecasting. Chemometrics and Intelligent Laboratory Systems, 149, 39-49.
[4] Deng, W., & Wang, G. (2017). A novel water quality data analysis framework based on time-series data mining. Journal of Environmental Management, 196, 365-375.
[5] Ho, T. K. (1998). The random subspace method for constructing decision forests. IEEE Transactions on Pattern Analysis and Machine Intelligence, 20 (8), 832-844.
[7] Su, H., Li, X., Yang, B., & Wen, Z. (2018). Wavelet support vector machine-based prediction model of dam deformation. Mechanical Systems and Signal Processing, 110, 412-427. [8] Stehman, S. V. (1997). Selecting and interpreting measures of
thematic classification accuracy. Remote Sensing of Environment, 62 (1), 77-89.
[9] Yin, Y., & Shang, P. (2016). Forecasting traffic time series with multivariate predicting method. Applied Mathematics and Computation, 291, 266-278.