_____________________________________________________________________________________________________
*Corresponding author: Email: [email protected];
Validation of Calculated Pressure Drop Using
Experimental Data with Standard Methods of an
Existing Software
Chris M. Wambua
1,2,3*, Ogbonna F. Joel
1,2, Sunday S. Ikiensikimama
1,2and Daniel O. Oyoo
31Department of Petroleum and Gas Engineering, University of Port Harcourt, Port Harcourt, Nigeria. 2
World Bank Africa Centre of Excellence for Oilfield Chemicals Research, University of Port Harcourt, Nigeria.
3Department of Gas and Petroleum Engineering, Kenyatta University, Kenya.
Authors’ contributions
This work was carried out in collaboration among all authors. Authors CMW and OFJ gave concept of the study. Author CMW designed the study, performed the statistical analysis and wrote the first draft of the manuscript. Authors OFJ, SSI and DOO supervised the project. All authors read and approved the final manuscript.
Article Information
DOI: 10.9734/JERR/2019/v9i317020 Editor(s): (1) Dr. Anuj Kumar Goel, Professor, CMR Engineering College, Kandlakoya, India. Reviewers: (1) Zhongjian Pan, Changsha University, China. (2)Joseph Oyekale, Federal University of Petroleum Resources, Nigeria. (3)Katarzyna Pietrucha-Urbanik, Rzeszow University of Technology, Poland. Complete Peer review History:http://www.sdiarticle4.com/review-history/53705
Received 27 October 2019 Accepted 02 January 2020 Published 09 January 2020
ABSTRACT
The aim of this research was to determine the pressure drop along a 450 km long multiproduct pipeline. Empirical formulae and quantitative methods were applied in order to establish pressure drop as an operating parameter. Flow rates used were obtained from the daily operation records of two consecutive years and were in the range of 629 – 765 m3/hr. Using four methods, observed pressure drop results when pumping products through the pipeline were as follows: Shell-MIT was 954.5 – 1411.9 bar (gasoline), 1257.6 – 1860.3 bar (kerosene) and 1535.0 – 2270.5 bar (diesel); Benjamin Miller was 0.509 – 0.728 bar/km (gasoline), 0.693 – 0.988 bar/km (kerosene), 0.773 – 1.101 bar/km (diesel); T. R. Aude was 0.590 – 0.841 bar/km (gasoline), 0.814 – 1.161 bar/km (kerosene), 0.907 – 1.294 (diesel); Darcy was 0.578 – 0.857 bar/km (gasoline), 0.703 – 1.042
bar/km (kerosene), 0.858 – 1.272 bar/km (diesel). Simulations using pipe-flow wizard were carried out in order to authenticate the calculated parameters. Results confirmed that Shell-MIT method is only applicable to crude oil pipelines. From comparison of calculated pressure drop, Benjamin Miller’s method was most preferred as it observed the least value within the same flow rate range. Simulation results validated the calculated pressure drop and therefore, calculated Benjamin Miller’s and T. R. Aude’s values are recommended for use in further review study of the said pipeline.
Keywords: Pipeline; gasoline; kerosene; diesel; pressure drop.
1. INTRODUCTION
Safety, reliability and efficiency are the major priorities in transportation of petroleum products through oil and gas pipeline networks [1] and Xiao et al., [2]. Monitoring and control of pipes, interface, booster stations, storage tanks and dispatch facilities is done from a control room as per standard pipeline operation philosophy [3]. In pipeline operations there are established safety and environmental standards regulated by professional and industrial agencies such as, the American Society of Mechanical Engineers (ASME) and government agencies [3]. Human resource, pipeline infrastructure and environment safety are incorporated in these standards [4,5]. Standards for design of piping systems, booster stations, storage tanks, pigging facilities, measurement and regulation of stations are coded [6].
Optimum throughput, reliability and safety should be attained when constructing a petroleum pipeline [7]. The fluid property and operating environment influences the choice of material to be used in pipeline construction [8]. Insufficient pipeline delivery is attributed to use of obsolete equipment, pipeline age and vandalism incidents on the lines [9,10,11]. According to Vincent and Genod, [12], periodic review of the problems associated with pipelines greatly improves product delivery efficiency. Since the reviewed pipeline segment is over 40 years there is need to constantly monitor and review the key pipeline parameters and therefore, this paper focused on pressure drop along 450 km. The following formulae were compared in estimation of pressure drop along the pipeline: Shell – MIT, Benjamin Miller, T. R. Aude and Darcy method. Past works stated that Shell – MIT equation is for delivering heavy crude oil and refinery’s high pour fuel oil [13]. This theory was tested in the study to ascertain how it differs from application in refined petroleum products. Benjamin Miller’s equation does not consider roughness of the pipe and can be used to calculate flow rate in a given pressure drop or vice versa [6]. In this study the daily flow rates for two consecutive
years were known. T. R. Aude’s equation comes in handy in pumping operations when estimating pressure drop however, caution is advised when using the equation for bigger pipeline diameters above 6 to 8 inches [6]. The basis for single-phase and some two-single-phase pressure drop for fluid flow follows the Darcy’s model. This model incorporates friction factor regardless of whether the incompressible fluid flow regime in a pipe is laminar or turbulent [14,15]. Pipe’s roughness effect on pressure drop are discussed by Swamee & John, [16]; Haaland, [17] and Serghide, (1984). Whenever the total delivery pressure and pressure drop along the line is greater than the allowable working pressure, a wider diameter pipe is suggested [18]. According to Khandlikar, (2005), pressure drop per given delivery volume is considered when designing a flawless pipe. Pipe flow wizard is a software package applicable in calculating pipe’s flow rate, pressure drop, pipe diameter and length [19]. It also takes into account the elevation changes and all fittings along the pipeline. Pipe flow wizard can be used for results verification of calculated pipeline parameters [20]. Regression analysis is a statistical tool used to investigate the interrelation between variables. It can also be used to develop or improve theoretical models [21]. This paper aimed at determining the pressure drop along the pipeline under review and validating the calculations.
2. RESEARCH METHODOLOGY
Flow rate values for two consecutive years were collected from operation records and standard pipe specifications for the reviewed pipeline segment (Table 1) were used in the analysis. Pressure drop was calculated using standard empirical formulae and simulated using pipe-flow wizard (PFW) software package to validate all calculated values.
2.1 Pressure Drop
reviewed pipeline segment were adopted and are as follows:
Shell-MIT equation [13,6]
∆ = . × (1)
Where:
∆ is the pressure loss, psi/mile or kPa/km. D is pipe internal diameter, inches or mm.
is the specific gravity. F is friction factor.
Q is the flow rate (bbl/day) or m3/hr.
Benjamin Milller formula [13,6]
= (0.1692)
.
log + 4.35 (2)
Where:
Q is the flow rate (bbls/hr) P is pressure loss (psi/mile).
D is internal Diameter of pipe (inches). Sg is specific gravity.
µ is Viscosity (centipoise).
T.R. Aude equation [6]
= (
. .
. . ) (3)
Where:
Q is the flow rate (bbl/hr). D is pipe diameter (inches). Sg is the specific gravity.
K is the pipe roughness/efficiency factor (usually 0.9 to 0.95).
Darcy’s formula [14,15].
In S.I unit, ∆ = , N/m2 (4)
Where:
∆ is the pressure drop over the length L, psig is density of the fluid, lb/ft3
F is the friction factor L is the Length of pipe ft (m)
Pipe-flow wizard was used to compare and validate calculated pressure drop results [20]. Inputs for pipe-flow wizard software were pipe diameter, pipe length, internal roughness, pipe fittings, flow rates and elevation change.
3. RESULTS AND DISCUSSION
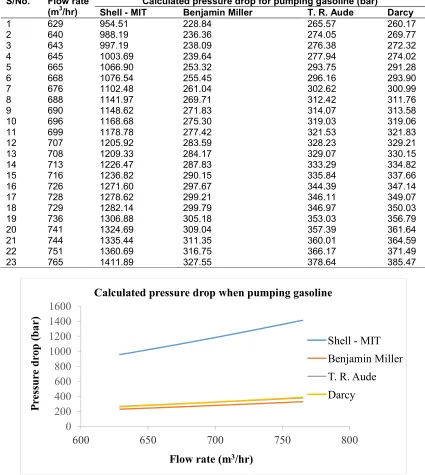
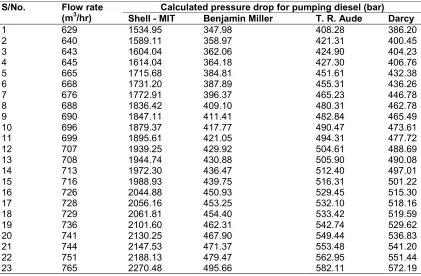
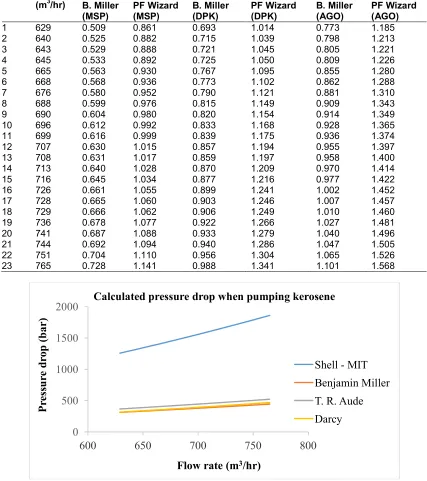
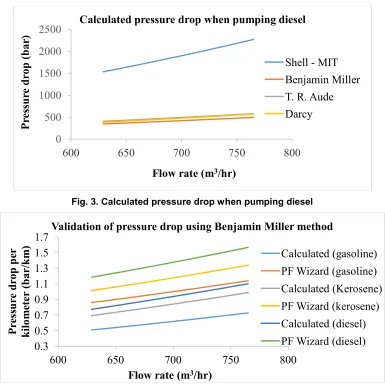
Figs. 1, 2 and 3 represent comparative analysis of calculated pressure drop using four standard methods when pumping gasoline, kerosene and diesel. From previous works, Shell–MIT equation is applicable in calculation of pressure drop in heavy crude oil and heated liquid pipelines [6]. As seen in Tables 2, 3 and 4, observed Shell-MIT pressure drop along 450 km pipe ranged between 954.5 – 1411.9 bar (gasoline), 1257.6 – 1860.3 bar (kerosene) and 1532.0 – 2270.5 bar (diesel). These results are in agreement with Menon, [6], literature as pressure drop is above main line pressure and therefore, Shell-MIT method is applicable in pipelines for products with high densities like crude oil. Shell-MIT results are not factored in further pressure drop comparative analysis.
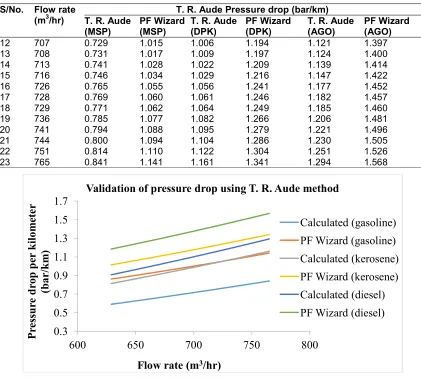
Further pressure drop comparative analysis was carried out using remaining three methods as shown in Figs. 4, 5 and 6 respectively i.e. Benjamin Miller, T. R. Aude and Darcy equation. From Tables 5, 6 and 7 respectively the following
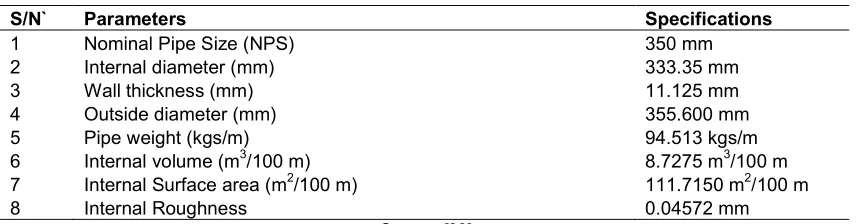
Table 1. Pipeline parameters
S/N` Parameters Specifications
1 Nominal Pipe Size (NPS) 350 mm
2 Internal diameter (mm) 333.35 mm
3 Wall thickness (mm) 11.125 mm
4 Outside diameter (mm) 355.600 mm
5 Pipe weight (kgs/m) 94.513 kgs/m
6 Internal volume (m3/100 m) 8.7275 m3/100 m 7 Internal Surface area (m2/100 m) 111.7150 m2/100 m
8 Internal Roughness 0.04572 mm
Table 2. Comparison of calculated pressure drop when pumping gasoline
S/No. Flow rate (m3/hr)
Calculated pressure drop for pumping gasoline (bar)
Shell - MIT Benjamin Miller T. R. Aude Darcy
1 629 954.51 228.84 265.57 260.17
2 640 988.19 236.36 274.05 269.77
3 643 997.19 238.09 276.38 272.32
4 645 1003.69 239.64 277.94 274.02
5 665 1066.90 253.32 293.75 291.28
6 668 1076.54 255.45 296.16 293.90
7 676 1102.48 261.04 302.62 300.99
8 688 1141.97 269.71 312.42 311.76
9 690 1148.62 271.83 314.07 313.58
10 696 1168.68 275.30 319.03 319.06
11 699 1178.78 277.42 321.53 321.83
12 707 1205.92 283.59 328.23 329.21
13 708 1209.33 284.17 329.07 330.15
14 713 1226.47 287.83 333.29 334.82
15 716 1236.82 290.15 335.84 337.66
16 726 1271.60 297.67 344.39 347.14
17 728 1278.62 299.21 346.11 349.07
18 729 1282.14 299.79 346.97 350.03
19 736 1306.88 305.18 353.03 356.79
20 741 1324.69 309.04 357.39 361.64
21 744 1335.44 311.35 360.01 364.59
22 751 1360.69 316.75 366.17 371.49
23 765 1411.89 327.55 378.64 385.47
Fig. 1. Calculated pressure drop when pumping gasoline Pressure drop ranges were observed when
pumping gasoline: 0.509 – 0.728 bar/km (B. Miller), 0.590 – 0.841 bar/km (T. R. Aude) and 0.578 – 0.841 bar/km (Darcy). When pumping kerosene: 0.693 – 0.988 bar/km (B. Miller), 0.814 – 1.161 bar/km (T. R. Aude) and 0.703 – 1.042 bar/km (Darcy). When pumping diesel: 0.773 – 1.101 bar/km (B. Miller), 0.907 – 1.294 bar/km (T. R. Aude) and 0.858 – 1.272 bar/km (Darcy).
When pumping gasoline, kerosene and diesel, it was noted that Benjamin Miller’s method showed the least pressure drop in comparison to T. R. Aude’s and Darcy’s equations yet product delivery rate was the same. However, according to Menon [23], the T. R. Aude equation is recommended for 6 – 8 inch refined products pipeline, hence caution is necessary when applying to pipelines with larger diameter.
0
200
400
600
800
1000
1200
1400
1600
600
650
700
750
800
P
re
ss
u
re
d
ro
p
(
b
a
r
)
Flow rate (m
3/hr)
Calculated pressure drop when pumping gasoline
Shell - MIT
Benjamin Miller
T. R. Aude
Table 3. Comparison of calculated pressure drop when pumping kerosene
S/No. Flow rate (m3/hr)
Calculated pressure drop for pumping kerosene (bar) Shell - MIT Benjamin Miller T. R. Aude Darcy
1 629 1257.63 311.93 366.31 316.42
2 640 1302.00 321.96 378.00 328.10
3 643 1314.24 324.66 381.22 331.20
4 645 1322.43 326.39 383.37 333.27
5 665 1405.71 345.09 405.18 354.26
6 668 1418.42 347.79 408.50 357.44
7 676 1452.60 355.50 417.41 366.06
8 688 1504.63 366.88 430.93 379.17
9 690 1513.39 368.81 433.20 381.39
10 696 1539.82 374.78 440.05 388.04
11 699 1553.12 377.67 443.49 391.41
12 707 1588.88 385.58 452.73 400.40
13 708 1593.38 386.54 453.89 401.53
14 713 1615.96 391.36 459.72 407.22
15 716 1629.59 394.45 463.23 410.67
16 726 1675.43 404.47 475.02 422.20
17 728 1684.67 406.40 477.39 424.54
18 729 1689.30 407.56 478.58 425.71
19 736 1721.90 414.69 486.94 433.93
20 741 1745.37 419.70 492.95 439.84
21 744 1759.53 422.79 496.58 443.42
22 751 1792.80 430.11 505.07 451.81
23 765 1860.26 444.76 522.26 468.81
Table 4. Comparison of calculated pressure drop when pumping diesel
S/No. Flow rate (m3/hr)
Calculated pressure drop for pumping diesel (bar) Shell - MIT Benjamin Miller T. R. Aude Darcy
1 629 1534.95 347.98 408.28 386.20
2 640 1589.11 358.97 421.31 400.45
3 643 1604.04 362.06 424.90 404.23
4 645 1614.04 364.18 427.30 406.76
5 665 1715.68 384.81 451.61 432.38
6 668 1731.20 387.89 455.31 436.26
7 676 1772.91 396.37 465.23 446.78
8 688 1836.42 409.10 480.31 462.78
9 690 1847.11 411.41 482.84 465.49
10 696 1879.37 417.77 490.47 473.61
11 699 1895.61 421.05 494.31 477.72
12 707 1939.25 429.92 504.61 488.69
13 708 1944.74 430.88 505.90 490.08
14 713 1972.30 436.47 512.40 497.01
15 716 1988.93 439.75 516.31 501.22
16 726 2044.88 450.93 529.45 515.30
17 728 2056.16 453.25 532.10 518.16
18 729 2061.81 454.40 533.42 519.59
19 736 2101.60 462.31 542.74 529.62
20 741 2130.25 467.90 549.44 536.83
21 744 2147.53 471.37 553.48 541.20
22 751 2188.13 479.47 562.95 551.44
Table 5. Comparison of pressure drop calculated using Benjamin Miller’s method
S/No. Flow rate (m3/hr)
B. Miller's Pressure drop (bar/km) B. Miller
(MSP)
PF Wizard (MSP)
B. Miller (DPK)
PF Wizard (DPK)
B. Miller (AGO)
PF Wizard (AGO) 1 629 0.509 0.861 0.693 1.014 0.773 1.185 2 640 0.525 0.882 0.715 1.039 0.798 1.213 3 643 0.529 0.888 0.721 1.045 0.805 1.221 4 645 0.533 0.892 0.725 1.050 0.809 1.226 5 665 0.563 0.930 0.767 1.095 0.855 1.280 6 668 0.568 0.936 0.773 1.102 0.862 1.288 7 676 0.580 0.952 0.790 1.121 0.881 1.310 8 688 0.599 0.976 0.815 1.149 0.909 1.343 9 690 0.604 0.980 0.820 1.154 0.914 1.349 10 696 0.612 0.992 0.833 1.168 0.928 1.365 11 699 0.616 0.999 0.839 1.175 0.936 1.374 12 707 0.630 1.015 0.857 1.194 0.955 1.397 13 708 0.631 1.017 0.859 1.197 0.958 1.400 14 713 0.640 1.028 0.870 1.209 0.970 1.414 15 716 0.645 1.034 0.877 1.216 0.977 1.422 16 726 0.661 1.055 0.899 1.241 1.002 1.452 17 728 0.665 1.060 0.903 1.246 1.007 1.457 18 729 0.666 1.062 0.906 1.249 1.010 1.460 19 736 0.678 1.077 0.922 1.266 1.027 1.481 20 741 0.687 1.088 0.933 1.279 1.040 1.496 21 744 0.692 1.094 0.940 1.286 1.047 1.505 22 751 0.704 1.110 0.956 1.304 1.065 1.526 23 765 0.728 1.141 0.988 1.341 1.101 1.568
Fig. 2. Calculated pressure drop when pumping kerosene
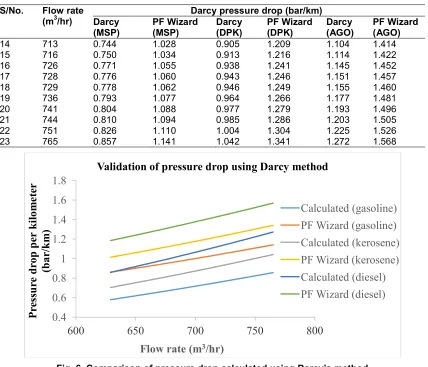
Figs. 4, 5 and 6 represent comparison of calculated pressure drop and simulated results. When pumping all three products (gasoline, kerosene and diesel) it was observed that, diesel had the highest pressure drop in both calculated and simulated results. This could be attributed to
diesel’s density as it is the heaviest of all three products and also, the drag effect due to pipe’s roughness and elevation change. The maximum observed variance from regression linear equations between calculated and simulated results was 0.02%.
0
500
1000
1500
2000
600
650
700
750
800
P
re
ss
u
re
d
ro
p
(
b
a
r
)
Flow rate (m
3/hr)
Calculated pressure drop when pumping kerosene
Shell - MIT
Benjamin Miller
T. R. Aude
Fig. 3. Calculated pressure drop when pumping diesel
Fig. 4. Comparison of pressure drop calculated using Benjamin Miller’s method
Benjamin Miller gasoline: y = 0.7244x - 228.05: R² = 0.9995; PF Wizard gasoline: y = 0.9214x - 193.75: R² = 0.9993; Benjamin Miller kerosene: y = 0.9737x - 302.16: R² = 0.9995; PF Wizard kerosene: y = 1.0767x - 222.85: R² = 0.9994; Benjamin Miller diesel: y = 1.0837x - 335.55: R² = 0.9995; PF Wizard diesel: y = 1.2649x -
264.81: R² = 0.9995
Table 6. Comparison of pressure drop calculated using T. R. Aude’s method
S/No. Flow rate (m3/hr)
T. R. Aude Pressure drop (bar/km) T. R. Aude
(MSP)
PF Wizard (MSP)
T. R. Aude (DPK)
PF Wizard (DPK)
T. R. Aude (AGO)
PF Wizard (AGO) 1 629 0.590 0.861 0.814 1.014 0.907 1.185 2 640 0.609 0.882 0.840 1.039 0.936 1.213 3 643 0.614 0.888 0.847 1.045 0.944 1.221 4 645 0.618 0.892 0.852 1.050 0.950 1.226 5 665 0.653 0.930 0.900 1.095 1.004 1.280 6 668 0.658 0.936 0.908 1.102 1.012 1.288 7 676 0.672 0.952 0.928 1.121 1.034 1.310 8 688 0.694 0.976 0.958 1.149 1.067 1.343 9 690 0.698 0.980 0.963 1.154 1.073 1.349 10 696 0.709 0.992 0.978 1.168 1.090 1.365 11 699 0.715 0.999 0.986 1.175 1.098 1.374
0
500
1000
1500
2000
2500
600
650
700
750
800
P
re
ss
u
re
d
ro
p
(
b
a
r)
Flow rate (m
3/hr)
Calculated pressure drop when pumping diesel
Shell - MIT
Benjamin Miller
T. R. Aude
Darcy
0.3
0.5
0.7
0.9
1.1
1.3
1.5
1.7
600
650
700
750
800
P
re
ss
u
re
d
ro
p
p
er
k
il
o
m
et
e
r
(b
a
r/
k
m
)
Flow rate (m
3/hr)
Validation of pressure drop using Benjamin Miller method
Calculated (gasoline)
PF Wizard (gasoline)
Calculated (Kerosene)
PF Wizard (kerosene)
Calculated (diesel)
S/No. Flow rate (m3/hr)
T. R. Aude Pressure drop (bar/km) T. R. Aude
(MSP)
PF Wizard (MSP)
T. R. Aude (DPK)
PF Wizard (DPK)
T. R. Aude (AGO)
PF Wizard (AGO) 12 707 0.729 1.015 1.006 1.194 1.121 1.397 13 708 0.731 1.017 1.009 1.197 1.124 1.400 14 713 0.741 1.028 1.022 1.209 1.139 1.414 15 716 0.746 1.034 1.029 1.216 1.147 1.422 16 726 0.765 1.055 1.056 1.241 1.177 1.452 17 728 0.769 1.060 1.061 1.246 1.182 1.457 18 729 0.771 1.062 1.064 1.249 1.185 1.460 19 736 0.785 1.077 1.082 1.266 1.206 1.481 20 741 0.794 1.088 1.095 1.279 1.221 1.496 21 744 0.800 1.094 1.104 1.286 1.230 1.505 22 751 0.814 1.110 1.122 1.304 1.251 1.526 23 765 0.841 1.141 1.161 1.341 1.294 1.568
Fig. 5. Comparison of pressure drop calculated using T. R. Aude’s method
T. R. Aude gasoline: y = 0.8292x - 257.42: R² = 0.9995; PF Wizard gasoline: y = 0.9214x - 193.75: R² = 0.9993; T. R. Aude kerosene: y = 1.1438x - 355.04: R² = 0.9995; PF Wizard kerosene: y = 1.0767x - 222.85: R² = 0.9994;
T. R. Aude diesel: y = 1.2749x - 395.77: R² = 0.9995; PF Wizard diesel: y = 1.2649x - 264.81: R² = 0.9995
Table 7. Comparison of pressure drop calculated using Darcy’s method
S/No. Flow rate (m3/hr)
Darcy pressure drop (bar/km) Darcy
(MSP)
PF Wizard (MSP)
Darcy (DPK)
PF Wizard (DPK)
Darcy (AGO)
PF Wizard (AGO) 1 629 0.578 0.861 0.703 1.014 0.858 1.185 2 640 0.599 0.882 0.729 1.039 0.890 1.213 3 643 0.605 0.888 0.736 1.045 0.898 1.221 4 645 0.609 0.892 0.741 1.050 0.904 1.226 5 665 0.647 0.930 0.787 1.095 0.961 1.280 6 668 0.653 0.936 0.794 1.102 0.969 1.288 7 676 0.669 0.952 0.813 1.121 0.993 1.310 8 688 0.693 0.976 0.843 1.149 1.028 1.343 9 690 0.697 0.980 0.848 1.154 1.034 1.349 10 696 0.709 0.992 0.862 1.168 1.052 1.365 11 699 0.715 0.999 0.870 1.175 1.062 1.374 12 707 0.732 1.015 0.890 1.194 1.086 1.397 13 708 0.734 1.017 0.892 1.197 1.089 1.400
0.3
0.5
0.7
0.9
1.1
1.3
1.5
1.7
600
650
700
750
800
P
re
ss
u
re
d
ro
p
p
er
k
il
o
m
et
e
r
(b
a
r
/k
m
)
Flow rate (m
3/hr)
Validation of pressure drop using T. R. Aude method
Calculated (gasoline)
PF Wizard (gasoline)
Calculated (kerosene)
PF Wizard (kerosene)
Calculated (diesel)
S/No. Flow rate (m3/hr)
Darcy pressure drop (bar/km) Darcy
(MSP)
PF Wizard (MSP)
Darcy (DPK)
PF Wizard (DPK)
Darcy (AGO)
PF Wizard (AGO) 14 713 0.744 1.028 0.905 1.209 1.104 1.414 15 716 0.750 1.034 0.913 1.216 1.114 1.422 16 726 0.771 1.055 0.938 1.241 1.145 1.452 17 728 0.776 1.060 0.943 1.246 1.151 1.457 18 729 0.778 1.062 0.946 1.249 1.155 1.460 19 736 0.793 1.077 0.964 1.266 1.177 1.481 20 741 0.804 1.088 0.977 1.279 1.193 1.496 21 744 0.810 1.094 0.985 1.286 1.203 1.505 22 751 0.826 1.110 1.004 1.304 1.225 1.526 23 765 0.857 1.141 1.042 1.341 1.272 1.568
Fig. 6. Comparison of pressure drop calculated using Darcy’s method
Darcy gasoline: y = 0.9866x - 342.06: R² = 0.9993; PF Wizard gasoline: y = 0.9214x - 193.75: R² = 0.9993; Darcy kerosene: y = 1.1885x - 412.06: R² = 0.9993; PF Wizard kerosene: y = 1.0767x - 222.85: R² = 0.9994; Darcy diesel: y = 1.3599x - 471.49: R² = 0.9993; PF Wizard diesel: y = 1.2649x - 264.81: R² = 0.9995
4. CONCLUSION
The result obtained from the calculations shows the following:
It was confirmed that Shell-MIT method is not applicable in pressure drop estimation for refined petroleum products pipeline as pressure drop results are higher than mainline pressure and therefore, more suitable for heavy crude oil pipelines.
For the reviewed pipeline segment, Benjamin Miller’s method was most preferred as it delivered product at the same flow rate but with least pressure drop results.
Calculated pressure drop results were validated through software simulations and therefore, the results are applicable in
optimization study of the reviewed pipeline. It should be noted that, the results can be used for comparison purposes with other standard 14 – inch steel pipelines for refined petroleum products in need of flow enhancement. However, elevation change should be cautiously monitored.
ACKNOWLEDGEMENT
The authors acknowledge the World Bank Africa Centre of Excellence for Oilfield Chemicals Research, University of Port Harcourt, Nigeria for their support in carrying out this research.
The authors acknowledge the Regional Universities Forum for Capacity Building in Agriculture (RUFORUM) for financial support during research.
0.4
0.6
0.8
1
1.2
1.4
1.6
1.8
600
650
700
750
800
P
re
ss
u
re
d
ro
p
p
er
k
il
o
m
e
te
r
(b
a
r/
k
m
)
Flow rate (m
3/hr)
Validation of pressure drop using Darcy method
Calculated (gasoline)
PF Wizard (gasoline)
Calculated (kerosene)
PF Wizard (kerosene)
Calculated (diesel)
The authors acknowledge Dr. (Mrs) Grace C. Akujobi-Emetuche for her input as a pipeline expert at Pipeline Product and Marketing Company (PPMC), Port Harcourt, Nigeria.
COMPETING INTERESTS
Authors have declared that no competing interests exist.
REFERENCES
1. Boaz L, Kaijage S, Sinde R. An overview of pipeline leak detection and location systems. In Proceedings of the 2nd Pan African International Conference on Science, Computing and Tele-communications (PACT 2014). IEEE. 2014;133-137.
2. Xiao Q, Li J, Sun J, Feng H, Jin S. Natural-gas pipeline leak location using variational mode decomposition analysis and cross-time–frequency spectrum. Measurement. 2018;124:163-172.
3. Ross DF. Distribution planning and control: Managing in the era of supply chain management. springer; 2015.
4. Madsen DA, Madsen DP. Engineering drawing and design. Nelson Education; 2016.
5. Stewart M. Surface production operations: Facility piping and pipeline systems. Gulf Professional Publishing. 2015;3.
6. Menon ES. Transmission pipeline calculations and simulations manual. Gulf Professional Publishing; 2014.
7. Westhoff MA. Using operating data at natural gas pipelines. In Proceedings: International Symposium on Transportation Recorders. Pipeline Materials and Property; 1999.
8. Larock BE, Jeppson RW, Watters GZ. Hydraulics of Pipeline Systems; 2000. 9. Barkech K. Studies in Systems, Decisions
and control: Modelling and analysis of linear hyperbolic systems of balanced laws, Springer. 2015;15.
10. Levenspiel O. Fluid mechanics and its application: Tracer technology modelling the flow of fluids. Springer. 2012;96. 11. Schaschke C. Fluid mechanics: Worked
examples for engineers. Institution of Chemical Engineers. UK. 1998;108. 12. Vincent-Genod J. Fundamentals of
pipeline engineering; 1984.
13. McAllister EW. Pipeline rules of thumb handbook: A manual of quick, Accurate Solutions to Everyday Pipeline Engineering Problem. Burlington, Ma: Gulf professional Publ; 2009.
14. Coker AK. Ludwig's applied process design for chemical and petrochemical plants. gulf professional publishing; 2014. 15. Kennedy JL. Oil and gas pipeline
fundamentals. Pennwell books; 1993. 16. Swamee PK, Jain AK. Explicit equations
for pipe-flow problems. 1976;102(5): 657e664.
17. Haaland SE. Simple and explicit formulas for the friction factor in turbulent pipe flow. Journal of Fluids Engineering. 1983; 105(1):89-90.
18. Escoe K. Piping and pipelines assessment guide. Elsevier. 2006;1.
19. Pipeflow. Pipe flow wizard software: Flow rate and pipe pressure drop calculator; 2019.
Available: https://www.pipeflow.com/pipe-flow-wizard-software
20. Akujobi-Emetuche GC, Joel OF, Chukwuma FO, Wami EN. Parameter assurance protocol and efficient pipeline design for accurate petroleum product delivery (Case study on system 2E/2EX, 0-56 kilometer segments). International Journal of Engineering Research and Management (IJERM). 2016;03(9).
[ISSN: 2349-2058]
21. Golberg MA, Cho HA. Introduction to regression analysis. WIT Press; 2004. 22. Matt Millbury PE, Ratzlaff J. Piping
designer, LLC: Data Sheet, Pipe-CS, and ANSI Sch 40 (in). 2015;68.
23. Menon ES. Liquid pipeline hydraulics. CRC press; 2004.
© 2019 Wambua et al.; This is an Open Access article distributed under the terms of the Creative Commons Attribution License (http://creativecommons.org/licenses/by/4.0), which permits unrestricted use, distribution, and reproduction in any medium, provided the original work is properly cited.
Peer-review history: