Multi Response Optimization of PMEDM of Titanium using
Modified TOPSIS
Dr BSV Ramarao
Abstract - Electric Discharge Machining is extensively usedfor the manufacturing of different components including complex shapes on the normal materials and even on the hardened materials like ceramics, super alloys and steels. Considerable work has been done on the EDM in different aspects. Here, in this research paper Titanium alloy has been tested to determine the response parameters like MRR, TWR & SR when an additive is mixed in the dielectric fluid. Taguchi L27 has been selected and experiments
wereconducted to determine the response parameters and then multi objective optimization has been done using Modified TOPSIS.
KEY WORDS: PMEDM, Multi Response, Euclidean distance, Modified TOPSIS & Pi
I. INTRODUCTION:
In Powder Mixed EDM suitable material in the form of powder will be mixed into the dielectric fluid in tank. For better circulation of the dielectric fluid a stirring system is used. The constant reuse of powder in the dielectric fluid can be done by the special circulation system. Various powders of particle can be added into the dielectric fluid. Spark gap provided by the additives particles. The powder particles of the material get energized & behave like a zigzag way manner. under the sparking zone, the particles of the material powder come close to each other & arrange themselves in the form of chain like structure between the workpiece surface & tool electrode. The interlocking between the different powder particles occurs in the direction of flow current. The chain formation helps in bridging the discharge gap between the electrodes. Because of bridging effect, the insulating strength of the dielectric fluid decreases resulting in easy short circuit. This causes early explosion in the gap and series discharge’ starts under the electrode area.
When voltage is applied, the powder particles become energized and behave in a zigzag fashion. These charged particles are accelerated due to the electric field and act as conductors promoting breakdown in the gap. This increases the spark gap between tool and the work piece. Under the sparking area, these particles come close to each other and arrange themselves in the form of chain like structures. The faster sparking within a discharge causes faster erosion from the work piece surface and hence the material removal rate increases.
Parameters of this machine are mainly classified into two categories i.e. Process Parameters &Performance Parameters. The process parameters in EDM are used to control the performance measures of the machining process. Process parameters are generally controllable machining input factors that determine the conditions in which machining is carried out. These machining
Dr. BSV Ramrao, Professor, Department of Mechanical Engineering,
Aurora’s Scientific & Technological Institute, Hyderabad, Telangana State, India.
conditions will affect the process performance result, which are gauged using various performance measures. Performance Parameters These parameters measure the various process performances of EDM results.
II. LITERATURE SURVEY:
PMEDM is extended usage of EDM, where some selected powders are mixed in dielectric fluid for the better results of the response parameters. The floating particles impede the ignition process by creating a higher discharge probability and lowering the breakdown strength of the insulating dielectric fluid. As a result, MRRis increased, TWR and SR are lowered due to the improvement in sparking efficiency.
In 2008 Kang and Kim studied EDM in order to investigate the effects of EDM process conditions on the crack susceptibility of a nickel based super alloy revealed that depending on the dielectric fluid and the post-EDM process such as solution heat treatment, cracks exist in recast layer could propagate into substrate when a 20% strain tensile force was applied at room temperature [1]. When kerosene as dielectric, it was observed that carburization and sharp crack propagation along the grain boundary occurred after the heat treatment. However, using deionized water as dielectric the specimen after heat treatment underwent oxidation and showed no crack propagation behaviour
In the same year Han-Ming Chow and other scientist investigated the effect of using pure water and a SiC powder for titanium (Ti) alloy in micro-slit EDM, and found that by using pure water as an EDM dielectric fluid for titanium alloy yields a high MRR and relatively low electrode wear and small expanding-slit by employing negative polarity (NP) processes [2]. Pure water and a SiC powder cause high conductivity; therefore, the gap was larger than using pure water in the EDM processes. Pure water and a SiC powder could disperse the discharging energy that refines the surface roughness effectively and also attains a higher MRR simultaneously than that of pure water.
Azad et al. [3] optimized multiple performances of micro-EDM process parameters for a set of target performances when Ti-6Al-4V is EDMed. It has been revealed that the most influential factors are voltage and current in the optimization of single quality characteristics.
These factors are not influential in multiple quality characteristics. The predicted optimum condition has been verified experimentally. Ekmekci et al. [4] investigated the effect SiC powder added dielectric fluid on surface modification by using SEM and EDX analysis of plastic mould steel. They used dielectric fluid as tap water and mixed SiC particles at various conditions. Experiments were conducted in parametrical order; the investigated input parameters are discharge current, pulse on duration and concentration of SiC particles and electrolytic copper as electrode material with reverse polarity. It has been concluded that high discharge current and low pulse on duration conditions are well suitable for the tap water mixed SiC particles dielectric fluid.
Zakaria et al. [5] studied the effect of tantalum carbide (TaC) powder mixed dielectric fluid on EDM of SUS 304 steel. Pure copper electrode was employed with straight polarity. The TaC powder mixed (25g/L) in kerosene was used as a dielectric fluid. The process parameters are discharge current, pulse on time and pulse off time on the measured performance characteristics like micro-hardness and corrosion characteristics. It has been observed that as the discharge current increases, micro-hardness is decreased. They concluded that TaC powder added kerosene can increase the corrosion resistance of workpiece rather than compared it without addition of TaC powder. Rajiv Kumar Sharma et al. [6] optimized PMEDM process parameters while machining of cobalt-bonded tungsten carbide with electrolytic copper. GRA-Taguchi method was applied to optimise the multi-performance characteristics of micro-hardness and SR. The measured input process parameters are pulse on time, pulse off time, discharge current, and powders. They observed that the analytical and experimental results indicated the most significant parameters as powder, pulse on time and discharge current.
Murahri et al. [7-10] conducted experiments on the addition of surfactant and surfactant with graphite and B4C powder into the dielectric fluid and compare the results with without the addition of surfactant into the dielectric fluid while machining of Ti-6Al4V using modified EDM process. It has been observed that, surfactant with graphite powder addition into the dielectric fluid show better performance compared to that of B4C powder addition. Although the influence of various dielectrics onthe stability of electrical discharge machining of titanium alloy has been studied extensively, including the material removal, surface roughness and recast layer thickness and the profile of the work piece and electrode to the best of our knowledge, there is little work reported in open literature regarding the use of drinking water as dielectric fluid for EDM of Titanium alloy.Ramarao et al. [11] has conducted around 30 experiments to determine the permissible range of input parameters to fit it into the orthogonal array which is to be considered for the main experiment. They have considered MRR, TWR and SR as the performance measures for their trail experiments.
Here in this research paper, Titanium grade V material has been considered for making indentations along with the copper tool material, where drinking water is as the dielectric fluid. Orthogonal array L27 has been
selected from the design of experiment for the response parameters MRR, TWR and SR. Multi objective optimization technique MTOPSISis applied separately to analyse and determine one set for the better values of the three-response parametric combination.
III. EXPERIMENTAION: A. Selection of workpiece material
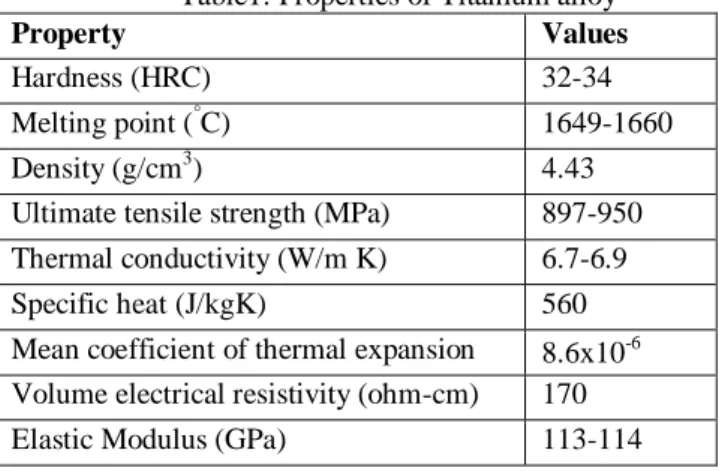
Here, the material of the workpiece is Ti-6Al-4V alloy. The size of the workpiece is of the dimensions - length 100 mm, width 50 mm and thickness 5 mm. MurahariKolli et al. [7-10] described the properties of the titanium alloy and are presented in below Table 1.
Table1: Properties of Titanium alloy
Property Values
Hardness (HRC) 32-34
Melting point (°C) 1649-1660
Density (g/cm3) 4.43
Ultimate tensile strength (MPa) 897-950
Thermal conductivity (W/m K) 6.7-6.9
Specific heat (J/kgK) 560
Mean coefficient of thermal expansion 8.6x10⁻⁶ Volume electrical resistivity (ohm-cm) 170
Elastic Modulus (GPa) 113-114
B. Selection of the dielectric: Drinking Water:
Even though many dielectric fluids are available for the study of EDM, water is selected as the dielectric fluid here because it is environmental friendly. Drinking water is colorless, odorless, harmless, and easily available. The specifications of Drinking water are listed in Table 2 below.
Table 2: Specifications of Drinking water
Characteristic Value
Appearance White / Almost colourless
Odour None
Density 0.9998 g/ml
Specific Gravity 1
Boiling point 99.980C
Flash Point (00C) Non-Flammable
Thermal conductivity 0.6065 W/m·K
Viscosity 0.890
Copper corrosion Almost zero (2.5 µm/year)
Conductivity 5-50 mS/m
Dielectric strength 60-70 Mv/m
C. PERFORMANCE MEASURES:
The performance measures considered here for the evaluation are Material Removal Rate (MRR), Tool Wear Rate (TWR), and Surface Roughness (SR). They are calculated using the following formulae,
Material Removal Rate (MRR):
The Material Removal Rate is calculated based on the workpiece weight loss for a particular time period and the relevant equation is given below,
Material Removal Rate,MRR = [(Wi −Wf )
(D X t) ] X 1000
Wi = Initial Weight in grams; Wf=Final Weight in grams
D=Density of the workpiece material in gm / cm3 t = Time Period of the experiment in minutes Units of MRR is mm3/min
Tool Wear Rate (TWR):
TWR is calculated on the basis of the material lost by the tool during the process, based on the change of weight of the tool material before and after the machining process which is shown in the below equation,
Tool Wear Rate,TWR = Ti−Tf
D X t X 1000
Ti = Initial Weight in grams: Tf=Final Weight in grams
Surface Roughness (SR):
The third machining parameter is surface roughness, SR. This measurement can be performed by using Talysurf, a portable type profilometer, in terms of Ra. Orthogonal array for L27 was obtained using MINITAB17.
D. Determination of preferred values through
MTOPSIS:
Determination of Weights using Standard Deviation Method:
The weights of machining parameters can be calculated using the Standard deviation method through the formula given below:
Wj = σj
σj
M k=1
Where Wj= Weights of the attributes
σj = Standard Deviation M = Number of Values
To find out the weights of the attributes, first it is required to find out the average of the eachmachining parameter, i.e., MRR, TWR& SR (XAVE). And then, the
average value of the machining parameter is subtracted from each value of the machining parameter (X-XAVE).
Calculation of the average values of the machining parameters along with the output of the subtracted values, i.e., X-XAVE of the three machining parameters are
calculated. The weights obtained are 0.6049 is for MRR and 0.0919 is for TWR and 0.3030 is for SR.
E. Analysis using MTOPSIS:
This method was developed during 1981 by Hwang and Yoon. This concept is based on the selection of ideal solution and is done with the shortest Euclidean distance and the farthest distance from the wrong solution. This gives the best solution from the available alternatives. Firstly normalisation can be done and then, the square roots of the sum of squares of each parameter are
calculated, which is used to divide each value to obtain normalized values.
Subsequently, R+ and R- of each machining parameter should be calculated. As we know, the material removal rate is the beneficial attribute and Tool wear rate along with the surface roughness are non-beneficial attributes. The values of (R-R+) and (R-R-) of each parameter are calculated which is called as normalised decision matrix. After obtaining the values of D+ and D-, the next immediate task is to find out the values of relative closeness Pi using the following formula and results are tabulated in the below Tables3-5.
Pi= D− (D++ D−) Table 3: Calculation of Pi - 1 MRR TWR SR D+ D- D+ D- D+ D- w(R-R+)2 w(R-R-)2 w(R-R+)2 w(R-R-)2 w(R-R+)2 w(R-R-)2 0.0218 0.0010 0.0003 0.0060 0.0017 0.0069 0.0301 0.0000 0.0001 0.0071 0.0055 0.0026 0.0246 0.0005 0.0006 0.0051 0.0002 0.0124 0.0196 0.0015 0.0000 0.0085 0.0075 0.0015 0.0298 0.0000 0.0001 0.0074 0.0052 0.0028 0.0252 0.0004 0.0000 0.0091 0.0015 0.0074 0.0251 0.0004 0.0000 0.0081 0.0012 0.0080 0.0321 0.0000 0.0000 0.0079 0.0015 0.0073 0.0252 0.0004 0.0000 0.0084 0.0005 0.0104 0.0077 0.0084 0.0040 0.0011 0.0058 0.0024 0.0168 0.0024 0.0033 0.0015 0.0029 0.0050 0.0118 0.0050 0.0028 0.0018 0.0003 0.0113 0.0098 0.0064 0.0014 0.0033 0.0056 0.0025 0.0149 0.0033 0.0014 0.0033 0.0092 0.0008 0.0094 0.0067 0.0014 0.0034 0.0039 0.0039 0.0086 0.0075 0.0022 0.0024 0.0016 0.0072 0.0181 0.0020 0.0016 0.0037 0.0043 0.0035 0.0147 0.0034 0.0013 0.0035 0.0000 0.0156 0.0001 0.0285 0.0091 0.0000 0.0042 0.0036 0.0010 0.0216 0.0072 0.0001 0.0064 0.0020 0.0001 0.0281 0.0071 0.0001 0.0019 0.0067 0.0001 0.0282 0.0061 0.0003 0.0078 0.0013 0.0020 0.0182 0.0059 0.0003 0.0156 0.0000 0.0009 0.0224 0.0052 0.0005 0.0035 0.0043 0.0000 0.0321 0.0066 0.0002 0.0055 0.0026 0.0024 0.0171 0.0062 0.0003 0.0048 0.0031 0.0009 0.0221 0.0047 0.0007 0.0003 0.0118
Table 4: Calculation of Pi - 2 Sum Sqrt Pi D+ D- D+ D- 0.0239 0.0139 0.1546 0.1180 0.4330 0.0357 0.0098 0.1890 0.0988 0.3433 0.0253 0.0180 0.1592 0.1342 0.4575 0.0271 0.0115 0.1647 0.1072 0.3944 0.0350 0.0102 0.1871 0.1011 0.3508 0.0267 0.0170 0.1635 0.1303 0.4435 0.0264 0.0166 0.1625 0.1289 0.4423 0.0337 0.0152 0.1836 0.1235 0.4021 0.0258 0.0192 0.1605 0.1387 0.4635 0.0174 0.0119 0.1320 0.1089 0.4520 0.0230 0.0089 0.1518 0.0944 0.3835 0.0150 0.0181 0.1225 0.1344 0.5231 0.0169 0.0122 0.1300 0.1105 0.4594 0.0256 0.0074 0.1600 0.0861 0.3498 0.0147 0.0140 0.1213 0.1185 0.4941 0.0124 0.0171 0.1112 0.1307 0.5402 0.0240 0.0092 0.1549 0.0961 0.3827 0.0160 0.0225 0.1264 0.1499 0.5426 0.0135 0.0321 0.1162 0.1791 0.6066 0.0146 0.0237 0.1206 0.1540 0.5608 0.0091 0.0349 0.0953 0.1869 0.6624 0.0141 0.0298 0.1187 0.1727 0.5927 0.0235 0.0185 0.1532 0.1361 0.4705 0.0096 0.0272 0.0981 0.1650 0.6272 0.0121 0.0349 0.1101 0.1868 0.6292 0.0134 0.0204 0.1158 0.1429 0.5523 0.0059 0.0346 0.0771 0.1860 0.7070
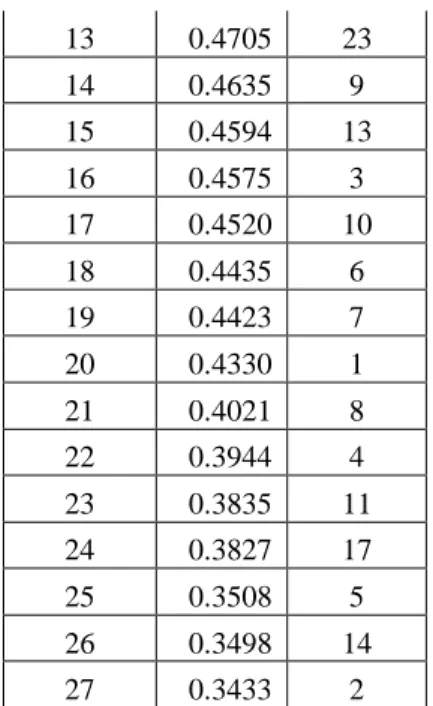
Table5: Descending order of relative closeness
Rank No Pi Run No 1 0.7070 27 2 0.6624 21 3 0.6292 25 4 0.6272 24 5 0.6066 19 6 0.5927 22 7 0.5608 20 8 0.5523 26 9 0.5426 18 10 0.5402 16 11 0.5231 12 12 0.4941 15 13 0.4705 23 14 0.4635 9 15 0.4594 13 16 0.4575 3 17 0.4520 10 18 0.4435 6 19 0.4423 7 20 0.4330 1 21 0.4021 8 22 0.3944 4 23 0.3835 11 24 0.3827 17 25 0.3508 5 26 0.3498 14 27 0.3433 2
As per the result obtained from the above table, it is very clear that the relative closeness value is high for 27th run of the L27 orthogonal array which means the set
values belongs to that run are the optimized set of values for the out puts considered.
IV. RESULTS:
The relative closeness is 0.7070 which is maximum among all the remaining values for the 27th run of the design of experiments which are conducted here. The relevant values of the 27th run are Discharge current is 20 Amp, Pulse ON time is 65 µs, Pulse OFF time is 48 µs, and Powder concentration is 10 g/lit.
BIBLIOGRAPHY:
[1] Kang, S. H., Kim, D.E., “Effect of electrical discharge machining process on crack susceptibility of nickel based heat resistant alloy.”, Materials Science and Technology, Vol. 21, (2005) pp.817– 823.
[2] Chow, H. M., Yang, L. D., Lin, C. T., Chen, Y. F., “The use of SiC powder in water as dielectric for micro-slit EDM machining.” Journal of materials processing technology, Vol. 195, (2008) pp. 160–170
[3] Azad M. S., Puri A. B. (2012) Simultaneous optimization of Multiple performance characteristics in Micro-EDM drilling of Titanium alloy. International Journal of Advanced Manufacturing Technology 61: 1231-1239
[4] BulentEkmekci., FevziUlusoz., NihalEkmekci.,
HamidullahYasar. (2014) Suspended SiC particle
deposition on plastic mold steel surface in powder mixed electrical discharge machining. Proceedings of Institute of Mechanical Engineers Part B: Journal of Engineering Manufacture DOI: 10.1177/0954405414530902.
[5] ZakariaMohd Zain., Mohammed Baba Ndaliman., Ahsan Ali Khan., Mohammad Yeakub Ali. (2014) Improving micro-hardness of stainless steel through powder mixed electrical discharge machining. Proceedings of Institute of Mechanical Engineers Part B: Journal of
[6] Rajiv Kumar Garg., KuladeepOjha. (2013) Parametric optimization of PMEDM process with chromium powder suspended dielectric for Triangular Electrodes. Advanced Materials Research 816-817: 23-27
[7] MurahariKolli and Adepu Kumar, Influence of Span 20 Surfactant and Graphite Powder Added in Dielectric Fluid on EDM of Titanium alloy, Bonifring Journal, 2014, Vol. 4 (2), 63- 67
[8] MurahariKolli and AdepuKumarParametric
Optimization of Boron Carbide Powder Added Electrical Discharge Machining of Titanium Alloy, Applied
Mechanics and material, 2014, Vol. 592-594, PP.578-
586.
[9] MurahariKolli and Adepu Kumar, Surfactant and Graphite Powder Assisted Electrical Discharge
Machining of Titanium Alloy, ProcIMechE part B:
Journal of Engineering Manufacture, 1-17, 2015,
DOI: 10.1177/0954405415579019.
[10] MurahariKolli and Adepu Kumar, Optimization of Surfactant mixed EDM parameters on Ti–6Al–4V Alloy using GRA-Taguchi Method, Journal of Material in
Technologie, DOI:mit.imt.si/Revija/ mit 249-2016, ImpactFactor:0.555.
[11] BSV Ramarao, Dr. P Shailesh&Dr. M
Sreenivasarao,” Obtaining the Output Parameters for
Different Powder Concentration in PMEDM”,
International Journal of Advance Engineering and Research Development, Volume 3, Issue 6, June -2016 e-ISSN (O): 2348-4470 p-e-ISSN (P): 2348-6406.
Author Personal Profile:
Dr B S V Ramarao is working as Professor at Aurora’s
Scientific and Technological Institute, Hyderabad. His qualifications are DME- Diploma in Mechanical Engineering, BE in Mechanical Engineering, ME in Automation & Robotics, MBA in Marketing and PhD in Mechanical Engineering. He is having 17 years of teaching experience for UG and PG students in various Engineering colleges.