Journal of the International Society of Sports Nutrition. 3(2): 12-18, 2006. (www.sportsnutritionsociety.org)
Effect of Protein Intake on Strength, Body
Composition and Endocrine Changes in
Strength/Power Athletes
Jay R. Hoffman, Nicholas A. Ratamess, Jie Kang, Michael J. Falvo, Avery D. Faigenbaum
The College of New Jersey, Ewing, NJ. Address correspondence to [email protected]
Received May 12, 2006/Accepted November 8, 2006
ABSTRACT
Comparison of protein intakes on strength, body composition and hormonal changes were examined in 23 experienced collegiate strength/power athletes participating in a 12-week resistance training program. Subjects were stratified into three groups depending upon their daily consumption of protein; below recommended levels (BL; 1.0 – 1.4 g⋅kg-1⋅day-1; n = 8), recommended levels (RL; 1.6 – 1.8 g⋅kg-1⋅day-1; n = 7) and above recommended levels (AL; > 2.0 g⋅kg-1⋅day-1; n = 8). Subjects were assessed for strength [one-repetition
maximum (1-RM) bench press and squat] and body composition. Resting blood samples were analyzed for total testosterone, cortisol, growth hormone, and insulin-like growth factor. No differences were seen in energy intake (3,171 ± 577 kcal) between the groups, and the energy intake for all groups were also below the recommended levels for strength/power athletes. No significant changes were seen in body mass, lean body mass or fat mass in any group. Significant improvements in 1-RM bench press and 1-RM squat were seen in all three groups, however no differences between the groups were observed. Subjects in AL experienced a 22% and 42% greater change in Δ 1-RM squat and Δ 1-RM bench press than subjects in RL, however these differences were not significant. No significant changes were seen in any of the resting hormonal concentrations. The results of this study do not provide support for protein intakes greater than recommended levels in collegiate strength/power athletes for body composition improvements, or alterations in resting hormonal concentrations. Journal of the International Society of Sports Nutrition. 3(2):12-18, 2006
Key Words: Sport Nutrition, Resistance Training, Hormones, Testosterone, Cortisol
INTRODUCTION
Relative to endurance athletes and the sedentary population, a greater protein need exists for strength/power athletes 1-3. For strength trained individuals to maintain a positive nitrogen balance it appears that daily protein consumption should be between 1.6 to 1.8 g⋅kg-1⋅day-1 1,3. The greater protein
requirement is thought to be related to the enhanced protein synthesis necessary to assist in the repair and remodeling process of skeletal muscle fibers damaged during a resistance exercise session 3-6. This has important implications for improving both muscle size and strength. The beneficial effects of a high protein intake may also be reflected by improvements in body composition through increasing lean tissue accruement 7. In addition,
protein intake has been suggested to influence the anabolic hormones involved with muscle remodeling
2,8,9. High protein diets and a high protein to
carbohydrate ratio have been associated with altering resting concentrations of testosterone 9, 10, cortisol 11 and insulin-like growth factor concentrations 4,12, but its effect on resting growth hormone concentrations remain inconclusive. Both increases 13 and no change 11 in resting growth hormone levels have been
seen following protein consumption.
Recommendations of a greater protein requirement for resistance-trained athletes have been based on studies that have primarily examined recreationally-trained individuals and not competitive athletes. This may suggest that the protein requirements for experienced resistance trained competitive athletes may be even higher than what is presently accepted. Since protein supplementation is considered to be one of the more common nutritional supplements used by collegiate athletes 14, it is likely that many
competitive athletes have daily protein intakes that exceed the recommended daily allowances. Whether
daily protein intakes greater than what is presently accepted (> 1.8 g⋅kg-1⋅day-1) is efficacious for
strength/power athletes is not well understood. Unfortunately many competitive athletes using nutritional supplementation often go by the ‘more is better’ philosophy, causing many athletes to make uneducated decisions regarding their supplementation habits 15. Thus, to provide for a better understanding of the protein needs of these individuals the protein intakes of collegiate strength/power athletes were stratified into three separate categories of daily protein consumption; below recommended levels (1.0 – 1.4 g⋅kg-1⋅day-1), recommended levels (1.6 – 1.8
g⋅kg-1⋅day-1) and above recommended levels (> 2.0
g⋅kg-1⋅day-1). The effect of these varying daily
protein intakes was examined on strength, body composition and endocrine changes during a 12-week resistance training program.
METHODS
Subjects: Twenty-three male collegiate
strength/power athletes volunteered for this study. Following an explanation of all procedures, risks and benefits each subject gave his informed consent to participate in this study. The Institutional Review Board of the College approved the research protocol. Subjects were not permitted to use any anabolic agents known to increase performance such as creatine, testosterone precursors, growth hormone or anabolic steroids for the six months prior to the onset of the study. Protein supplementation was considered to be acceptable for inclusion in this study to enable an increase in protein consumption. Screening for anabolic hormone use and additional supplementation was accomplished via a health questionnaire filled out during subject recruitment.
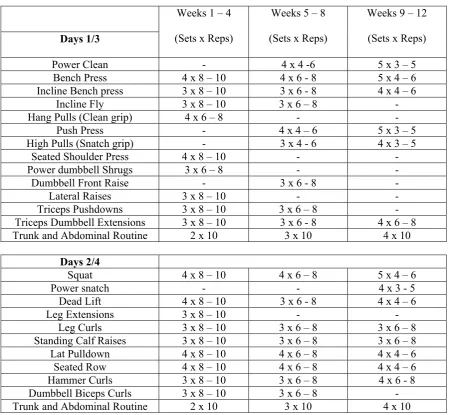
All subjects were experienced resistance trained athletes from the college’s football team or sprinters or throwers from the college’s track and field team with at least 2 years of resistance training experience. All subjects performed the same resistance training program for 12 weeks. The training program was a 4-day per week, split routine (see Table 1) that was supervised by research personnel. All subjects completed a daily training log and turned it in at the end of each week. In addition, all subjects completed a 3-day dietary recall every week. Based upon the average weekly protein intakes determined for the 12-week study the subjects were categorized into three groups; below recommended daily protein intake (BL; 1.0 – 1.4 g⋅kg-1⋅day-1; n = 8; 21.0 ± 1.3 y;
183.4 ± 5.1 cm; 99.7 ± 8.4 kg), recommended daily
protein intake (RL; 1.6 – 1.8 g⋅kg-1⋅day-1; n = 7; 20.3
± 1.5 y; 184.1 ± 4.0 cm; 93.3 ± 9.3 kg) and above recommended daily protein intake (AL; > 2.0 g⋅kg -1⋅day-1; n = 8; 20.7 ± 1.6 y; 179.6 ± 6.2 cm; 95.1 ± 7.5
kg).
Dietary Recall. Dietary intake was continuously monitored throughout the study using 3-day dietary records every week. Subjects were instructed to record as accurately as possible everything they consumed during the day including between meal and late evening snacks.
Testing Protocol. Subjects reported to the Human Performance Laboratory on two separate occasions. The first testing session occurred prior to the onset of the training program (PRE) and the second testing session occurred at the conclusion of the 12-week training program (POST). All testing sessions occurred at the same time of day.
Blood Measurements. Subjects were required to arrive at the laboratory in the early morning following an overnight fast for blood draws. All blood draws occurred at the same time of day for each testing session. Each blood sample was obtained from an antecubital arm vein using a 20-gauge disposable needle equipped with a Vacutainer® tube holder (Becton Dickinson, Franklin Lakes, NJ) with the subject in a seated position. Blood samples were collected into a Vacutainer® tube containing SST® Gel and Clot Activator. Serum was allowed to clot at room temperature and subsequently centrifuged at 1500 x g for 15 minutes. The resulting serum was placed into separate 1.8ml microcentrifuge tubes and frozen at -80°C for later analyses.
Journal of the International Society of Sports Nutrition. 3(2): 12-18, 2006. (www.sportsnutritionsociety.org) 14
Table 1. 12-week Resistance Training Program
Days 1/3
Weeks 1 – 4
(Sets x Reps)
Weeks 5 – 8
(Sets x Reps)
Weeks 9 – 12
(Sets x Reps)
Power Clean - 4 x 4 -6 5 x 3 – 5
Bench Press 4 x 8 – 10 4 x 6 - 8 5 x 4 – 6 Incline Bench press 3 x 8 – 10 3 x 6 - 8 4 x 4 – 6
Incline Fly 3 x 8 – 10 3 x 6 – 8 - Hang Pulls (Clean grip) 4 x 6 – 8 - -
Push Press - 4 x 4 – 6 5 x 3 – 5
High Pulls (Snatch grip) - 3 x 4 - 6 4 x 3 – 5 Seated Shoulder Press 4 x 8 – 10 - -
Power dumbbell Shrugs 3 x 6 – 8 - -
Dumbbell Front Raise - 3 x 6 - 8 -
Lateral Raises 3 x 8 – 10 - -
Triceps Pushdowns 3 x 8 – 10 3 x 6 – 8 - Triceps Dumbbell Extensions 3 x 8 – 10 3 x 6 - 8 4 x 6 – 8 Trunk and Abdominal Routine 2 x 10 3 x 10 4 x 10
Days 2/4
Squat 4 x 8 – 10 4 x 6 – 8 5 x 4 – 6
Power snatch - - 4 x 3 - 5
Dead Lift 4 x 8 – 10 3 x 6 - 8 4 x 4 – 6
Leg Extensions 3 x 8 – 10 - -
Leg Curls 3 x 8 – 10 3 x 6 – 8 3 x 6 – 8 Standing Calf Raises 3 x 8 – 10 3 x 6 – 8 3 x 6 – 8 Lat Pulldown 4 x 8 – 10 4 x 6 – 8 4 x 4 – 6 Seated Row 4 x 8 – 10 4 x 6 – 8 4 x 4 – 6 Hammer Curls 3 x 8 – 10 3 x 6 – 8 4 x 6 - 8 Dumbbell Biceps Curls 3 x 8 – 10 3 x 6 – 8 - Trunk and Abdominal Routine 2 x 10 3 x 10 4 x 10 All exercises performed to a repetition maximum range
Body Composition. Body composition was deter- mined using whole body-dual energy x-ray absorptiometry (DEXA) scans (Prodigy™; Lunar Corporation, Madison, WI). Total body estimates of percent fat, bone mineral density and bodily content of bone, fat and non-bone lean tissue was determined using company’s recommended procedures and supplied algorithms. All measures were performed by the same technician. Quality assurance was assessed by daily calibrations and was performed prior to all scans using a calibration block provided by the manufacturer.
Strength Measures. During each testing session subjects performed a one-repetition maximum (1-RM) strength test on the squat and bench press exercises. Each subject performed a warm-up set using a resistance that was approximately 40-60% of
his perceived maximum, and then performed three to four subsequent attempts to determine the 1-RM. A 3 – 5 minute rest period was provided between each lift.
Statistical Analysis. Statistical evaluation of the data was accomplished by a repeated measures analysis of variance. In the event of a significant F- ratio, LSD post-hoc tests were used for pairwise comparisons. In addition, Δ comparisons between groups were analyzed with independent student’s t-tests. Pearson product-moment correlation was used to examine selected bivariate correlations. A criterion alpha level of p≤ 0.05 was used to determine statistical significance. All data are reported as mean ± SD.
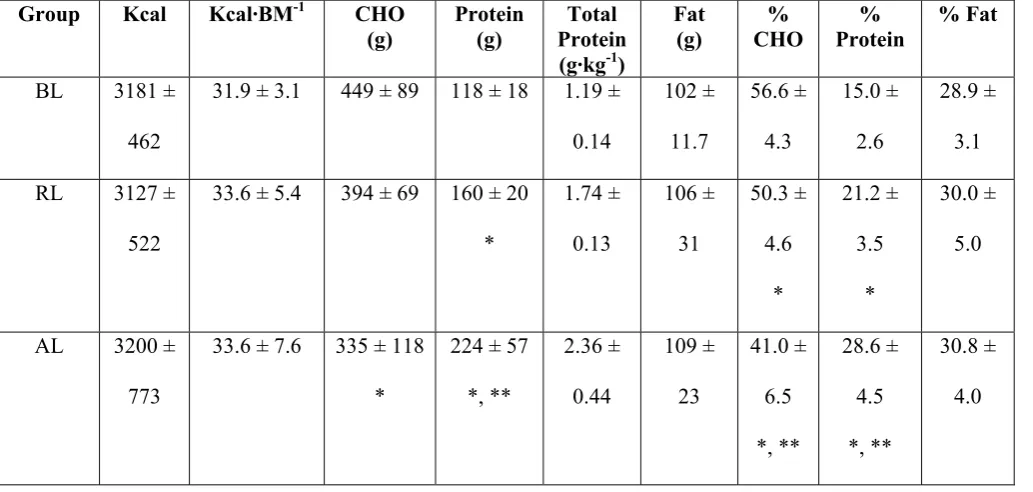
Table 2. Average Daily Dietary Intake
Group Kcal Kcal·BM-1 CHO
(g)
Protein (g)
Total Protein
(g·kg-1)
Fat (g)
% CHO
% Protein
% Fat
BL 3181 ±
462
31.9 ± 3.1 449 ± 89 118 ± 18 1.19 ±
0.14
102 ±
11.7
56.6 ±
4.3
15.0 ±
2.6
28.9 ±
3.1
RL 3127 ±
522
33.6 ± 5.4 394 ± 69 160 ± 20
*
1.74 ±
0.13
106 ±
31
50.3 ±
4.6
*
21.2 ±
3.5
*
30.0 ±
5.0
AL 3200 ±
773
33.6 ± 7.6 335 ± 118
*
224 ± 57
*, **
2.36 ±
0.44
109 ±
23
41.0 ±
6.5
*, **
28.6 ±
4.5
*, **
30.8 ±
4.0
BL = below recommended protein intake; RL = recommended protein intake; AL = above recommended protein intake. * = significantly different (p < 0.05) than BL; ** = significantly different (p < 0.05) than RL
RESULTS
Average daily dietary intake is shown in Table 2. No significant difference in daily caloric intake was seen between the groups. However, significant differences in total and relative protein intake were seen between all three groups. Significant differences were also observed in carbohydrate intake between BL and AL. The protein and carbohydrate composition of the diet was also significantly different between all three groups.
No changes from PRE in body mass, lean body mass or percent body fat were observed in any group, and no between group differences were observed (see Table 3). Interestingly, Δ lean body mass was increased by 1.1 ± 2.2 kg in AL, 0.8 ± 1.5 kg in RL and no change (0.0 ± 1.6 kg) seen in BL. However, these changes were not significantly different.
Significant increases in strength from PRE were seen for all groups in the 1-RM squat and 1-RM bench press (see Table 3). However, no significant differences between the groups were seen. Although Δ strength comparisons showed that subjects in AL had the largest magnitude in strength improvements in both 1-RM squat (63% and 22% greater than BL and RL, respectively) and 1-RM bench press strength (35% and 42% greater than BL and RL,
respectively), these differences were not statistically different.
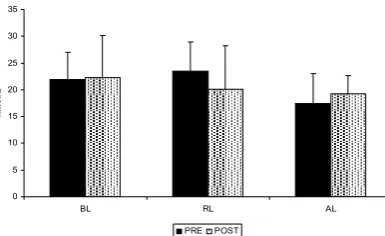
Resting total testosterone, cortisol, T/C ratio, growth hormone, and IGF-I concentrations are shown in Figures 1-5, respectively. No significant changes from PRE were observed in any of the groups, and no between groups differences were seen in any of the hormones measured. In addition, no correlations were seen between testosterone concentrations and dietary protein intake (r = 0.09) and the protein/carbohydrate ratio (r = 0.08).
DISCUSSION
The purpose of this study was to examine whether protein intakes above recommended levels (> 2.0 g⋅kg-1⋅day-1) provided any additional benefit for
strength and body composition improvements in strength/power athletes. In addition, the effect of varying protein intakes on resting hormonal concentrations was also examined. Results were unable to show any significant evidence indicating that protein intakes above 2.0 g⋅kg-1⋅day-1 were
Journal of the International Society of Sports Nutrition. 3(2): 12-18, 2006. (www.sportsnutritionsociety.org) 16
Table 3. Anthropometric, Strength and Anaerobic Power Performance Results
Variable Group PRE POST Δ PRE – POSI
BL 99.7 ± 8.4 100.3 ± 9.5 0.59 ± 2.11
RL 93.3 ± 9.3 94.6 ± 9.8 1.32 ± 0.88 Body Mass (kg)
AL 95.1 ± 7.5 95.7 ± 7.7 0.51 ± 1.89
BL 76.8 ± 3.5 76.8 ± 4.6 -0.01 ± 1.63
RL 73.9 ± 4.6 74.7 ± 5.0 0.77 ± 1.49 Lean Body
Mass (kg)
AL 74.2 ± 7.1 75.3 ± 7.6 1.10 ± 2.22
BL 22.7 ± 6.1 23.1 ± 6.4 0.32 ± 1.51
RL 20.1 ± 8.1 20.0 ± 8.2 -0.09 ± 1.60 Body Fat (%)
AL 21.4 ± 3.3 20.3 ± 3.3 -1.10 ± 1.88
BL 166.9 ± 23.0 180.2 ± 17.1 13.3 ± 11.9
RL 146.8 ± 21.8 164.6 ± 30.2 17.8 ± 16.8 1-RM Squat
(kg)
AL 175.3 ± 45.5 197.1 ± 40.1 21.7 ± 12.4
BL 123.6 ± 13.4 132.1 ± 10.6 8.5 ± 5.5
RL 113.3 ± 17.6 121.4 ± 18.8 8.1 ± 6.5 1-RM Bench
Press (kg)
AL 132.4 ± 24.1 143.9 ± 21.7 ** 11.5 ± 8.1
BL = below recommended protein intake; RL = recommended protein intake; AL = above recommended protein intake. ** = significantly different (p < 0.05) than RL
However, results should be interpreted relative to energy intakes consumed by the subjects. Caloric intakes observed were low compared to levels generally recommended for strength/power athletes 1.
The low energy intakes observed in this study confirm previous reports that have shown that collegiate athletes generally do not meet their nutritional needs, specifically as it relates to energy intake 16, 17. Caloric intakes of strength/power athletes
should exceed 44 – 50 kcal⋅kgBM⋅day-1 1, however
the caloric intakes reported in this study (33.0 ± 5.5 kcal⋅kgBM⋅day-1) were below these recommended
0 5 10 15 20 25 30 35
BL RL AL
nm
ol
/L
PRE POST
Figure 1: Testosterone. BL = protein intake below recommended levels; RL = protein intake at recommended levels; AL = protein intake above recommended levels. All data are reported as mean ± SD.
0 100 200 300 400 500 600 700 800 900 1000
BL RL AL
nm
ol
/L
PRE POST
Figure 2: Cortisol. BL = protein intake below recommended levels; RL = protein intake at recommended levels; AL = protein intake above recommended levels. All data are reported as mean ± SD.
0 1 2 3 4 5 6 7 8 9
BL RL AL
x10
3
PRE POST
Figure 3: Testosterone/cortisol ratio. BL = protein intake below recommended levels; RL = protein intake at recommended levels; AL = protein intake above recommended levels. All data are reported as mean ± SD.
0 0.1 0.2 0.3 0.4 0.5 0.6 0.7 0.8 0.9 1
BL RL AL
ng/
m
l
PRE POST
Figure 4: IGF-1. BL = protein intake below recommended levels; RL = protein intake at recommended levels; AL = protein intake above recommended levels. All data are reported as mean ± SD.
levels and likely impacted the ability of these subjects to make significant gains in lean tissue accruement. Previous studies have shown that the combination of resistance training with elevated energy intake is important for stimulating significant gains in body mass and lean tissue 6, 7. It is likely that despite protein intakes that were at or above recommended levels, the inadequate caloric consumption limited body mass and lean tissue gains.
0.0 5.0 10.0 15.0 20.0 25.0 30.0 35.0 40.0 45.0
BL RL AL
nm
ol
/L
PRE POST
Figure 5: Growth Hormone. BL = protein intake below
recommended levels; RL = protein intake at recommended levels; AL = protein intake above recommended levels. All data are reported as mean ± SD.
Strength gains were seen in all three groups, however no significant differences were observed between the groups. Studies have shown that elevated protein intake is necessary for strength/power athletes to counteract the deleterious effects of muscle degradation seen following resistance exercise 4, 5, 18.
Evidence to date has only shown that protein intakes between 1.6 – 1.8 g⋅kg⋅day-1 is sufficient to maintain
a positive nitrogen balance 3. However, considering
that this recommendation was based primarily on research examining recreational athletes, it was of interest to determine whether competitive resistance-trained athletes would require a higher protein intake. The thought being that experienced, competitive strength/power athletes that exercise at a high intensity and volume of training may require a greater need of protein to stimulate muscle growth and strength development. Although the results of this study do not provide statistical support for this hypothesis, a 35% and 42% greater improvement (p>0.05) in Δ 1-RM bench press was seen by AL in comparison to BL and RL, respectively. In addition, improvements in Δ 1-RM squat were 63% and 22% greater (p>0.05) for AL compared to BL and RL, respectively.
Results of this study also indicated that dietary protein content does not appear to influence resting hormonal concentrations. These results are similar to those reported by Bird and colleagues who showed no change in resting cortisol concentrations following several weeks of protein supplementation 19. In
addition, both growth hormone and IGF-I have also been shown to remain unchanged following protein supplementation 11. Our results contrast with those
seen by other investigators that have shown high protein intakes to elevate resting IGF-I concentrations 4, 12. However, these studies suggested
Journal of the International Society of Sports Nutrition. 3(2): 12-18, 2006. (www.sportsnutritionsociety.org) 18
in addition to the high protein content contributed to the elevated resting IGF-1 response. It is likely that the relatively low energy intakes observed in the subjects of this study may have contributed to the lack of change seen in IGF-I.
No changes were observed in resting testosterone concentrations or in the T/C ratio. A limited number of studies have shown that high protein diets tend to reduce resting testosterone concentrations10 and that
both protein content and the protein-to-carbohydrate ratio are inversely related to resting testosterone concentrations 9,10. However, this may be a factor of
high relative dietary protein consumption. The protein content of RL (21.2%) and AL (28.6%) were lower than that reported by Anderson and colleagues (44% of total energy from protein) 10, and may not
influence resting testosterone concentrations to the same degree.
CONCLUSION
The results of this study do not provide any support for protein intakes greater than recommended levels in collegiate strength/power athletes for body composition improvements, or alterations in resting hormonal concentrations. Inadequate energy intakes likely contributed to these results. Although elevated protein content did not produce significantly greater strength improvements, results suggest that further study is warranted on the effect of high (> 2.0 g⋅kg -1⋅day-1) protein intake on strength and lean tissue
accruement. However, future research needs to insure appropriate caloric consumption in the examination of strength/power athletes.
REFERENCES
1. American Dietetic Association, Dietitians of Canada and the American College of Sports Medicine. Position stand: Nutrition and athletic performance. Med. Sci. Sports Exer. 2000; 32:2130-2145.
2. Lemon PWR, Tarnopolsky MA, MacDougal JD, Atkinson SA. Protein requirements and muscle mass/strength changes during intensive training in novice bodybuilders. J. Appl. Physiol. 1992; 73:767-775.
3. Tarnopolsky MA, Atkinson SA, MacDougal JD, et al., Evaluation of protein requirements for trained strength athletes. J. Appl.
Physiol. 1992; 73:1986-1995.
4. Kraemer WJ, Ratamess NA, Volek JS, et al., The effects of amino acid supplementation on hormonal responses to overreaching.
Metabolism. 2006; 55:282-291.
5. Ratamess NA, Kraemer WJ, Volek JS, et al., The effects of amino acid supplementation on muscular performance during resistance training overreaching. J. Strength Cond. Res. 2003; 17:250-258.
6. Roy BD, Fowles JR, Hill R, Tarnopolsky MA. Macronutrient intake and whole body protein metabolism following resistance exercise. Med. Sci. Sports Exerc. 1997; 32:1412-1418.
7. Rozenek R, Ward P, Long S, Garhammer J. Effects of high-calorie supplements on body composition and muscular strength following resistance training. J. Sports Med. Phys. Fitness. 2002; 42:340-347.
8. Chandler RM, Byrne K, Patterson JG, Ivy JL. Dietary supplements affect the anabolic hormones after weight-training. J. Appl.
Physiol. 1994; 76:839-845.
9. Volek JS, Kraemer WJ, Bush JA, et al., Testosterone and cortisol in relationship to dietary nutrients and resistance exercise. J.
Appl. Physiol. 1997; 82:49-54.
10. Anderson KE, Rosner W, Khan MS, et al., Diet-hormone interactions: protein/carbohydrate ratio alters the reciprocally the plasma levels of testosterone and cortisol and their respective binding globulins in man. Life Sci. 1987; 40:1761-1768.
11. Kraemer WJ, Volek JS, Bush JA, et al., Hormonal responses to consecutive days of heavy-resistance exercise with or without nutritional supplementation. J. Appl. Physiol. 1998; 85:1544-1555.
12. Forbes GB, Brown MR, Welle SL, Underwood LE. Hormonal response to overfeeding. Am. J. Clin. Nutr. 1989; 49: 608-611. 13. Bratusch-Marrain P, Waldäusi W. The influence of amino acids and somatostatin on prolactin and growth hormone release in man.
Acta Endocrinol. 1979; 90:403-408.
14. Schenk TL, Costley CD. When food becomes a drug: Nonanabolic nutritional supplement use in athletics. Amer. J. Sports Med. 2002; 30:907-916.
15. Hoffman J.R. Physiological Aspects of Sports Training and Performance. Champaign, IL: Human Kinetics. 2002.
16. Cole CR,. Salvaterra GF, Davis JE, et al., Evaluation of dietary practices of National Collegiate Athletic Association Division I football players. J. Strength Cond. Res. 2005; 19:490-494.
17. Hinton PS, Sanford TC, Davidson MM, et al., Nutrient intakes and dietary behaviors of male and female collegiate athletes. Int. J.
Sport Nutr. Exerc. Metab. 2004; 14:389-405.
18. Paddon-Jones D, Shefield-Moore M, Creson DL, et al., Hypercortisolemia alters muscle protein anabolism following ingestion of essential amino acids. Am. J. Physiol. Endocrinol. Metab. 2003; 284:E946-E953.