R E S E A R C H A R T I C L E
Open Access
Effect of glycemic index and carbohydrate
intake on kidney function in healthy adults
Stephen P. Juraschek
1, Alex R. Chang
2, Lawrence J. Appel
1, Cheryl A. M. Anderson
3, Deidra C. Crews
1,
Letitia Thomas
1, Jeanne Charleston
1and Edgar R. Miller III
1*Abstract
Background:Replacing carbohydrate with protein acutely increases glomerular filtration rate (GFR) but is associated with faster, long-term kidney disease progression. The effects of carbohydrate type (i.e. glycemic index, GI) on kidney function are unknown.
Methods:We conducted an ancillary study of a randomized, crossover feeding trial in overweight/obese adults
without diabetes or kidney disease (N= 163). Participants were fed each of four healthy, DASH-like diets for 5 weeks, separated by 2-week washout periods. Weight was kept constant. The four diets were: high GI (GI ≥65) with high %carb (58 % kcal) (reference diet), low GI (≤45) with low %carb (40 % kcal), low GI with high %carb; and high GI with low %carb. Plasma was collected at baseline and after each feeding period. Study outcomes were cystatin C, β2-microglobulin (β2M), and estimated GFR based on cystatin C (eGFRcys).
Results: Mean (SD) age was 52 (11) years; 52 % were women; 50 % were black. At baseline, mean (SD) cystatin
C,β2M, and eGFRcys were 0.8 (0.1) mg/L, 1.9 (0.4) mg/L, and 104 (16) mL/min/1.73 m2. Compared to the high GI/high %carb diet, reducing GI, %carb, or both increased eGFRcys by 1.9 mL/min/1.73 m2 (95 % CI: 1.1, 2.7; P< 0.001), 3.0 mL/min/1.73 m2 (1.9, 4.0; P< 0.001), and 4.5 mL/min/1.73 m2 (3.5, 5.4; P< 0.001), respectively. Increases in eGFRcys from reducing GI were significantly associated with increases in eGFRcys from reducing %carb (P< 0.001). Results for cystatin C andβ2M reflected eGFRcys.
Conclusions:Reducing GI increased GFR. Reducing %carb by increasing calories from protein and fat, also increased GFR. Future studies on GI should examine the long-term effects of this increase in GFR on kidney injury markers and clinical outcomes.
Trial registration:Clinical Trials.gov, number: NCT00608049 (first registered January 23, 2008)
Keywords:β2-microglobulin, Carbohydrate, Clinical trial, Creatinine, Cystatin C, Diet, Estimated glomerular filtration rate, Glycemic index
Abbreviations:β2M,β2-microglobulin; BMI, Body mass index; CG, The high carbohydrate, high glycemic index diet; Cg, The high carbohydrate, low glycemic index diet; cG, The low carbohydrate, high glycemic index diet; cg, The low carbohydrate, low glycemic index diet; CI, Confidence interval; DASH, Dietary approaches to stop hypertension; DBP, Diastolic blood pressure; GEE, Generalized estimating equation; GFR, Glomerular filtration rate; HDL, High density lipoprotein; LDL, Low density lipoprotein; OMNICARB, The effect of amount and type of dietary carbohydrates on risk for cardiovascular heart disease and diabetes study; SBP, Systolic blood pressure
* Correspondence:[email protected]
1
The Johns Hopkins School of Medicine, The Johns Hopkins Bloomberg School of Public Health, and The Welch Center for Prevention, Epidemiology and Clinical Research, Johns Hopkins Medical Institutions, 2024 East Monument Street, Suite 1–500, Baltimore, MD 21205, USA Full list of author information is available at the end of the article
Background
Replacing dietary carbohydrates with protein increases glomerular filtration rate (GFR) acutely and is associated with faster chronic kidney disease (CKD) progression over the long-term [1–3]. Whether carbohydrate quality affects GFR is unknown. Glycemic index (GI) is a meas-ure of carbohydrate quality, i.e. the amount of glucose released into circulation from carbohydrate-based foods [4]. GI is determined by comparing the area under a 2-h glucose curve measured after consumption of a stan-dardized amount of carbohydrates from two food items (the food of interest and a reference food) [5]. Previous observational studies demonstrated that higher GI is as-sociated with prevalent CKD [6]. However, this associ-ation has not been examined in a trial setting and could have implications for CKD prevention.
In this analysis of data from “The Effect of Amount and Type of Dietary Carbohydrates on Risk for Cardiovascular Heart Disease and Diabetes Study” (OMNICARB), we determined the effects of reducing GI or the proportion of carbohydrates (%carb) on GFR in relatively healthy adults, using a cystatin C estimating equation. We further estimated GFR with a creatinine-based equation for comparison. We hypothe-sized that reducing GI would increase GFR as a result of metabolic changes, and that reducing %carb (i.e. in-creasing the proportion of protein) would increase GFR. We reported this relationship to change in pro-tein intake in an earlier publication from a different feeding study (OMNI-HEART) [7]. A cystatin C-based equation, rather than a creatinine-based equation, was our primary outcome because of a concern that changes in dietary protein intake would influence
serum creatinine levels and interfere with accurate esti-mation of kidney function [7].
Methods
The rationale, design, and main effects of OMNICARB were described previously [8]. The current ancillary study utilized stored plasma specimens to examine the effects of amount and type of carbohydrates on markers of kidney function.
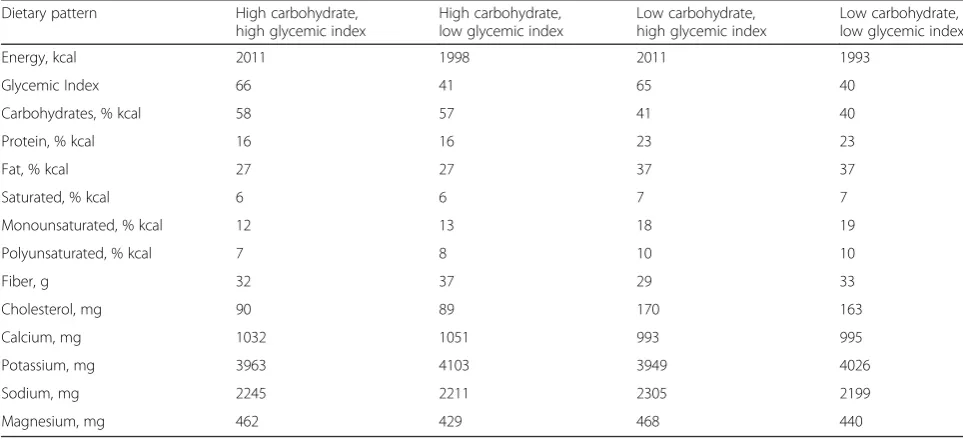
OMNICARB was a randomized, crossover trial, com-prising 4-dietary interventions: high GI (GI ≥65) with high %carb (58 % kcal from carbohydrates) (reference diet), low GI (GI ≤45) with low %carb (40 % kcal from carbohydrates), low GI with high %carb; and high GI with low %carb [8]. Other key nutrients were similar across the four diets (Table 1). By design, the diets were healthy using the core nutrient profile of the DASH diet [9]. Each diet was isocaloric, was prepared with com-monly available foods, and was low in saturated fat, cholesterol, and sodium, but rich in fruits, vegetables, fiber, potassium, and other minerals. Note that the low %carb diets were also higher in % protein.
Participant recruitment
Trial participants were adult men and women, residing in and around Boston, Massachusetts, and Baltimore, Maryland. Participants were≥30 years, had a body mass index ≥25 kg/m2with a systolic BP of 120–159 and a diastolic BP <100 mmHg. Persons with a prior diagno-sis of diabetes or cardiovascular disease were excluded [8]. Persons were also excluded if they had renal insuffi-ciency on screening labs, based on an estimated GFR <40 ml/min per 1.73 m2. Similarly, participants were
Table 1Nutrient composition of the four diets used in OmniCarba
Dietary pattern High carbohydrate,
high glycemic index
High carbohydrate, low glycemic index
Low carbohydrate, high glycemic index
Low carbohydrate, low glycemic index
Energy, kcal 2011 1998 2011 1993
Glycemic Index 66 41 65 40
Carbohydrates, % kcal 58 57 41 40
Protein, % kcal 16 16 23 23
Fat, % kcal 27 27 37 37
Saturated, % kcal 6 6 7 7
Monounsaturated, % kcal 12 13 18 19
Polyunsaturated, % kcal 7 8 10 10
Fiber, g 32 37 29 33
Cholesterol, mg 90 89 170 163
Calcium, mg 1032 1051 993 995
Potassium, mg 3963 4103 3949 4026
Sodium, mg 2245 2211 2305 2199
Magnesium, mg 462 429 468 440
a
Estimated from food analysis software (ESHA Food Processor SQL, version 10.2, ESHA Research)
deemed eligible for inclusion if baseline systolic blood pressure was 120–159 mmHg and diastolic blood pres-sure was <100 mmHg (mean over three screening visits). Anyone with stage 2 hypertension (systolic blood pressure > 160 or diastolic blood pressure > 100 mmHg) based on the mean of three screening visits were excluded. Anyone with a mean systolic blood pressure >170 or diastolic blood pressure >105 mmHg at any one visit were also excluded [8]. Institutional Re-view Boards approved the study protocol, and all partic-ipants provided written informed consent.
Controlled feeding
Controlled feeding began in August 2008 and was com-pleted in December 2010. Participants were randomly assigned to 1 of 8 dietary sequences of the 4 diets [8]. Feeding periods lasted for 5 weeks, separated by 2-week washout periods. Calorie targets were determined for each participant based on body size, sex, and physical activity level. Participants were provided all of their foods and caloric intake was adjusted to maintain weight within 2 % of participants’ baseline values. Participants were encouraged to maintain the same activity levels and alcohol consumption throughout the study. Every day, participants ate at least one meal at the study site and meal attendance and meal consumption were monitored. Participants also completed a diary in which they listed any consumption of non-protocol foods. Biochemical markers of dietary compliance were urine urea nitrogen, urine creatinine, urine so-dium, and urine potassium.
Measurement of outcomes
Laboratory specimens were collected for each partici-pant at baseline and at the completion of each 5-week feeding period. Cystatin C,β2 microglobulin (β2M), and creatinine were measured in plasma samples that were collected in tubes, centrifuged, and stored at −70 °C. Cystatin C andβ2M were used to estimate kidney func-tion, whereas plasma creatinine and estimated glomeru-lar filtration rate based on creatinine (eGFRcreat) were measured for purposes of comparison. When compared to creatinine, these markers are less influenced by fac-tors know to affect creatinine such as race [10] and diet (e.g. protein intake) [7]. Both cystatin C and β2M were measured with particle-enhanced immunonephelometric assays (N Latex Cystatin C assay and N Latex β2M assay, Dade Behring, IL). Inter-assay coefficients of vari-ation for cystatin C and β2M were 2.0 % (mean 0.917 mg/L) and 1.8 % (mean 2.184 mg/L), respectively. Creatinine was measured in stored plasma specimens using standardized laboratory assays with an inter-assay coefficient of variation of 6.6 % (mean 0.653 mg/dL). Glomerular filtration rate was estimated using the
Chronic Kidney Disease Epidemiology Collaboration cystatin C-based equation (eGFRcys) [11] and the Chronic Kidney Disease Epidemiology Collaboration creatinine-based GFR equation (eGFRcreat) [12]. As op-posed to other estimating equations, these equations were used because they were developed in a population sample that included individuals, who like the partici-pants of the OMNICARB trial, did not have chronic kidney disease (CKD).
Other covariate measurements and definitions
Additional laboratory and physical exam covariates were determined as follows. Body mass index (BMI) was cal-culated using baseline height and weight measurements and was dichotomized as 25–29.9 kg/m2or ≥30 kg/m2. Waist circumference (cm) was measured at the level of the umbilicus. Fasting glucose and insulin were mea-sured at baseline and at the end of each feeding period. The homeostasis model assessment index (HOMA) was calculated using HOMA = [(fasting serum insulin con-centration in μU/mL) x (fasting serum glucose concen-tration in mmol/L)]/22.5 and dichotomized based on the baseline median value of ≥1.48. Similarly, traditional as-says were used to measure total triglycerides and HDL cholesterol. LDL cholesterol levels were estimated by the Friedewald equation [13]. Triglycerides were dichoto-mized using the baseline median value of 83.8 mg/dL. Uric acid and high sensitivity C-reactive protein were also measured in plasma collected at baseline and the end of each feeding period.
Baseline hypertension status (yes or no) was deter-mined by an average of 3 baseline blood pressure measurements in which systolic blood pressure was >140 mmHg or diastolic blood pressure was >90 mmHg. No participants were taking antihypertensive medications. Blood pressure was also measured at the end of each feed-ing period as the average of 3 measurements by trained and certified staff using a validated automated oscillo-metric OMRON 907 device.
Mediators of glomerular filtration
At baseline and at the end of each feeding period, we assessed potential mediators of glomerular filtration, in-cluding markers of glucose homeostasis (fasting glucose, insulin, triglycerides), endothelial function (uric acid, systolic BP, diastolic BP), and inflammation (high sensi-tivity C-reactive protein).
Statistical analysis
and %carb for each outcome and generated forest plots for visual representation. In addition, we performed stratified analyses by covariates known to be associated with insulin resistance, namely, race (non-Hispanic black versus white), baseline hypertension status, baseline tri-glycerides, baseline BMI, and baseline HOMA. All of the above comparisons were performed via generalized esti-mating equation (GEE) regression models, using a Huber and White robust variance estimator [14], which assumed an exchangeable working correlation matrix.
P-values for each stratum were generated using inter-action terms. The above analyses were repeated for creatinine and eGFRcreat for comparison.
We also used linear regression to determine whether the change in eGFRcys which resulted from reducing GI was associated with change in eGFRcys which resulted from reducing %carb. A positive asso-ciation would suggest a common mechanism of action for GI and %carb on kidney function. We further per-formed a mediation analysis of eGFRcys, adjusting for concurrent changes in markers of glucose homeostasis (fasting glucose, insulin, triglycerides), endothelial function (uric acid, systolic blood pressure, diastolic blood pressure), and inflammation (high sensitivity C-reactive protein), all thought to influence GFR.
For dietary compliance measures, namely, urine urea nitrogen, urine creatinine, urine sodium, and urine potassium, we performed baseline and between-diet comparisons only, using similar models described above. A sensitivity analysis using feeding period 1 alone was conducted to eliminate potential carryover effects. We also performed a sensitivity analysis exam-ining every possible dietary comparison grouped by GI, %carb, or simultaneous changes in both GI and %carb. The purpose of this analysis was to confirm our primary comparison between diets, which utilized the high GI, high %carb diet as our reference group. All analyses were performed in STATA version 11.1 (Stata Corporation, College Station, TX, USA). Statis-tical significance was defined as P≤0.05. Missing data specimens were excluded from analyses as they were few (N= 4) and evenly distributed between feeding periods and diets.
Results
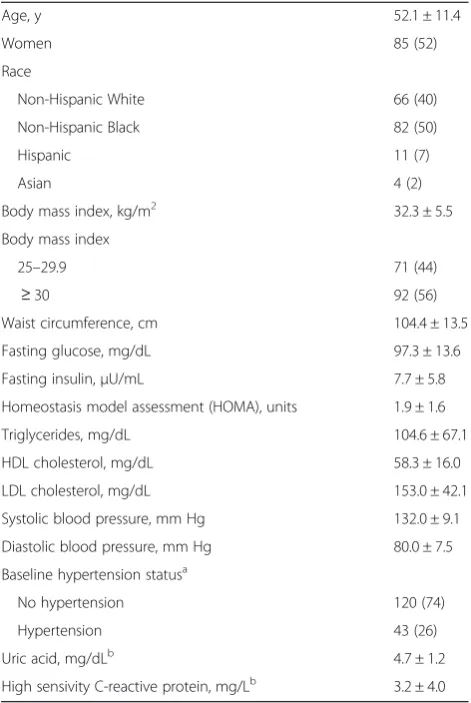
Baseline characteristics of the randomized, study popula-tion are shown in Table 2. Overall mean age was 52.1 ± 11.4 years; 52 % of the participants were women, and 50 % were non-Hispanic blacks. Furthermore, 56 % of participants were obese, and 26 % had hypertension.
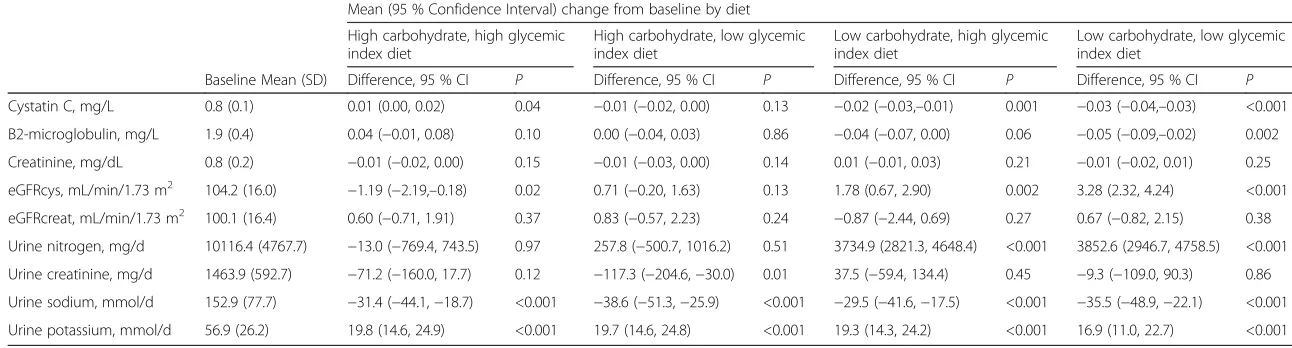
End-of-period measures were compared to baseline measures (Table 3). Cystatin C was significantly greater during the high GI, high %carb diet (P=0.04)
and significantly lower during the high GI/low %carb, and low GI/low %carb diets (both P≤0.001). β2M was significantly lower during the low GI/low %carb diet (P=0.002). While eGFRcys decreased significantly ~1 mL/min/1.73 m2 during the high GI/high %carb diet (P =0.02), it increased significantly during the high GI/low %carb (~2 mL/min/1.73 m2; P=0.002) and low GI/low %carb diets (~3 mL/min/1.73 m2; P<0.001). Creatinine did not change significantly during any dietary period throughout the trial. There was no sig-nificant difference between end-of-period eGFRcreat and baseline during any of the four diets.
When compared with baseline, urine urea nitrogen was significantly higher during the low %carb diets (P<0.001 for high GI/low %carb and P<0.001 for low GI/low %carb) consistent with the higher protein composition of these diets. Urine creatinine tended to decrease during the high %carb diets (P=0.12 for high GI/high %carb and P=0.01 for low GI/high Table 2Baseline characteristics of trial participants (N= 163), mean ± SD or No. (%)
Age, y 52.1 ± 11.4
Women 85 (52)
Race
Non-Hispanic White 66 (40)
Non-Hispanic Black 82 (50)
Hispanic 11 (7)
Asian 4 (2)
Body mass index, kg/m2 32.3 ± 5.5
Body mass index
25–29.9 71 (44)
≥30 92 (56)
Waist circumference, cm 104.4 ± 13.5
Fasting glucose, mg/dL 97.3 ± 13.6
Fasting insulin,μU/mL 7.7 ± 5.8
Homeostasis model assessment (HOMA), units 1.9 ± 1.6
Triglycerides, mg/dL 104.6 ± 67.1
HDL cholesterol, mg/dL 58.3 ± 16.0
LDL cholesterol, mg/dL 153.0 ± 42.1
Systolic blood pressure, mm Hg 132.0 ± 9.1
Diastolic blood pressure, mm Hg 80.0 ± 7.5
Baseline hypertension statusa
No hypertension 120 (74)
Hypertension 43 (26)
Uric acid, mg/dLb 4.7 ± 1.2
High sensivity C-reactive protein, mg/Lb 3.2 ± 4.0
a
Defined as baseline SBP≥140 or DBP≥90 mmHg b
Only measured in 159 participants due to lost specimens
Table 3Plasma markers of kidney function and urine markers of compliance,N= 159
Mean (95 % Confidence Interval) change from baseline by diet
High carbohydrate, high glycemic index diet
High carbohydrate, low glycemic index diet
Low carbohydrate, high glycemic index diet
Low carbohydrate, low glycemic index diet
Baseline Mean (SD) Difference, 95 % CI P Difference, 95 % CI P Difference, 95 % CI P Difference, 95 % CI P
Cystatin C, mg/L 0.8 (0.1) 0.01 (0.00, 0.02) 0.04 −0.01 (−0.02, 0.00) 0.13 −0.02 (−0.03,–0.01) 0.001 −0.03 (−0.04,–0.03) <0.001
B2-microglobulin, mg/L 1.9 (0.4) 0.04 (−0.01, 0.08) 0.10 0.00 (−0.04, 0.03) 0.86 −0.04 (−0.07, 0.00) 0.06 −0.05 (−0.09,–0.02) 0.002
Creatinine, mg/dL 0.8 (0.2) −0.01 (−0.02, 0.00) 0.15 −0.01 (−0.03, 0.00) 0.14 0.01 (−0.01, 0.03) 0.21 −0.01 (−0.02, 0.01) 0.25
eGFRcys, mL/min/1.73 m2 104.2 (16.0) −1.19 (−2.19,–0.18) 0.02 0.71 (−0.20, 1.63) 0.13 1.78 (0.67, 2.90) 0.002 3.28 (2.32, 4.24) <0.001
eGFRcreat, mL/min/1.73 m2 100.1 (16.4) 0.60 (−0.71, 1.91) 0.37 0.83 (−0.57, 2.23) 0.24 −0.87 (−2.44, 0.69) 0.27 0.67 (−0.82, 2.15) 0.38
Urine nitrogen, mg/d 10116.4 (4767.7) −13.0 (−769.4, 743.5) 0.97 257.8 (−500.7, 1016.2) 0.51 3734.9 (2821.3, 4648.4) <0.001 3852.6 (2946.7, 4758.5) <0.001
Urine creatinine, mg/d 1463.9 (592.7) −71.2 (−160.0, 17.7) 0.12 −117.3 (−204.6,−30.0) 0.01 37.5 (−59.4, 134.4) 0.45 −9.3 (−109.0, 90.3) 0.86
Urine sodium, mmol/d 152.9 (77.7) −31.4 (−44.1,−18.7) <0.001 −38.6 (−51.3,−25.9) <0.001 −29.5 (−41.6,−17.5) <0.001 −35.5 (−48.9,−22.1) <0.001
Urine potassium, mmol/d 56.9 (26.2) 19.8 (14.6, 24.9) <0.001 19.7 (14.6, 24.8) <0.001 19.3 (14.3, 24.2) <0.001 16.9 (11.0, 22.7) <0.001
Note: eGFRcys represents cystatin C-based estimated glomerular filtration rate; eGFRcreat represents creatinine-based estimated glomerular filtration rate
al.
BMC
Nephrology
(2016) 17:70
Page
5
of
%carb), consistent with the diets’ lower protein com-position (16 % vs. 23 %). For all diets, urine sodium significantly decreased and urine potassium increased (all P-values <0.001). This was expected given the low sodium and high fruits and vegetable-based foods inherent in all the OMNICARB diets.
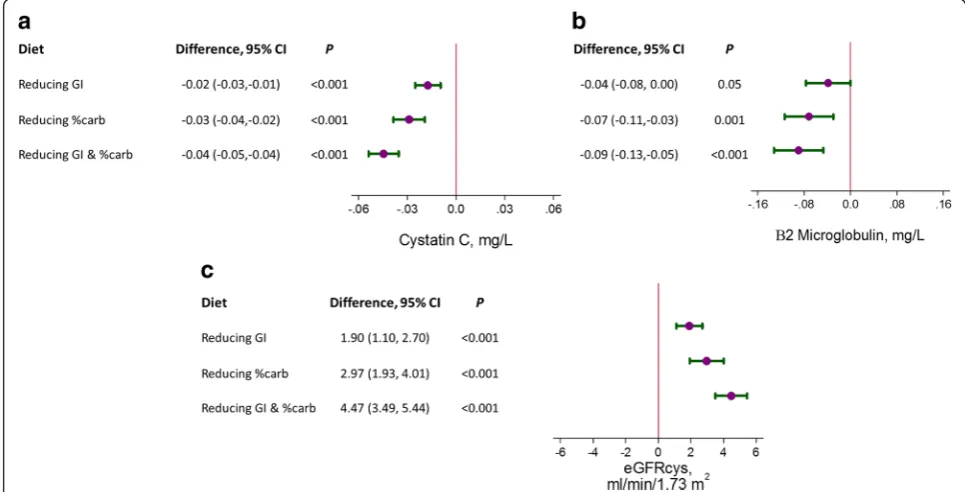
The effects of reducing GI or %carb on β2M, cysta-tin C, and eGFRcys were compared across diets, using the high GI,/high %carb diet as a reference (Fig. 1a-c). Re-ducing GI, %carb, or both GI and %carb significantly reduced cystatin C (P<0.001 for all three) and β2M (P<0.001 for all three). Each of the diets significantly increased eGFRcys (P<0.001 for all three). Further-more, the magnitude of effect was higher, ranging from ~2 mL/min/1.73 m2 (reduced GI) and ~3 mL/ min/1.73 m2 (reduced %carb) to 4.5 mL/min/1.73 m2, when both GI and %carb were reduced.
The effects of dietary carbohydrates on plasma cre-atinine and eGFRcreat were also assessed (Additional file 1: Figure S1A-B). While reducing %carb increased serum creatinine (P= 0.001), increased urine creatin-ine excretion (P= 0.007), and decreased eGFRcreat by 1.5 mL/min/1.73 m2 (P= 0.02), reducing GI or both factors had no effect on serum creatinine, urine cre-atinine excretion, or eGFRcreat.
In general, the observed effects on kidney markers and GFR described above were confirmed when every possible dietary comparison was performed with the exception of creatinine and eGFRcreat, which
demonstrated greater variability from changes in dietary factors (i.e. GI or %carb) (Additional file 1: Table S3).
We compared the diets’ effects on cystatin C, β2M, creatinine, eGFRcys, and eGFRcreat by strata of factors associated with CKD (Additional file 1: Table S1). There was no evidence of interactions by race, hyper-tension status, baseline triglycerides, BMI, and HOMA on any of the observed dietary effects. A sensitivity ana-lysis utilizing feeding period 1 alone may be found in Additional file 1: Table S2. While the patterns of associ-ation were unaltered, our results were attenuated when we restricted our analysis to feeding period 1 only.
Finally, we specifically examined the mechanism by which GI and %carb affected eGFRcys. We found that the renal response to reducing GI was significantly associated with the renal response to reducing %carb (P< 0.001) (Additional file 1: Figure S2). Further, the effects of reducing GI or %carb on eGFRcys were only mildly attenuated with adjustment for potential mediators of kidney function, specifically, fasting glu-cose, insulin, triglycerides, uric acid, systolic blood pressure, and diastolic blood pressure (Table 4).
Discussion
For the first time in a trial setting, we demonstrated that reducing GI, i.e. changing the type of carbohydrate, reduced markers of kidney function and increased glomerular filtration. Furthermore, this study confirmed prior observations that reducing %carb (i.e. increasing
Fig. 1The effects (95 % confidence intervals) of reducing glycemic index (GI), reducing the proportion of carbohydrates (%carb), or reducing both GI and %carb on: acystatin C (mg/L),bβ2-microglobulin (mg/L), andccystatin C-based estimated glomerular filtration rate (eGFRcys) (mL/min/1.73 m2) measured at the end of each feeding period. The reference diet was the high GI/high %carb diet
%protein/fat), increases kidney function. Moreover, an increase in eGFRcys from reducing GI tended to have a similar effect as that observed from reducing %carb, and these effects were additive, such that reducing both GI and %carb increased eGFRcys by 4.5 mL/min/ 1.73 m2. The effects persisted after adjustment for po-tential mediators of kidney function.
In our study, replacing carbohydrates with fat and pro-tein increased GFR as estimated by cystatin C andβ2M. These results are consistent with previous studies that test dietary effects on GFR [7]. Animal and human stud-ies have indicated that dietary protein increases renal blood flow and glomerular filtration rates via increased intraglomerular pressures, leading to progressive glom-erular sclerosis, particularly in the setting of decreased nephron mass [15–19]. These effects may be mediated by dietary effects on signaling molecules of the tubulo-glomerular feedback system, responsible for arteriolar constriction [20–22]. It is also believed that dietary pro-tein may increase neuronal nitric oxide synthase in the kidney cortex, which relaxes the afferent renal ar-teriole [23, 24]. Although fat was also higher in the low carbohydrate/high protein diet, there is much less evidence for a relationship between a higher fat diet and hyperfiltration [25], though some have hypothe-sized that such an association could be mediated through inflammation [26, 27].
This study is among the first to examine the effects of GI on GFR. GI, a metric of carbohydrate quality
determined by measuring the amount of glucose re-leased into circulation after consumption of a stand-ard amount of carbohydrates [4], could influence kidney function. Reducing GI has been reported to decrease inflammation [28]. Furthermore, animal models have shown that a high GI diet contributes to glomerular degeneration [29]. Recently, an observational study of 2,600 adults reported a cross-sectional association between dietary GI and an estimated GFR <60 mL/min per 1.73 m2 (OR = 1.55 [1.07–2.26]; P-trend =0.01), but dietary GI was not associated with incident CKD over a 5-year follow-up period [6]. Contrary to the above studies and our a priori hypothesis, we found that a lower GI diet decreased kidney filtration markers and increased eGFRcys. While the exact mechanism for this observation is unknown, several animal models have reported an association between complex carbo-hydrates (i.e. low GI foods) and improved renal endo-thelial nitric oxide synthase [30, 31] or decreased leukocyte binding with glomerular endothelial cells [32]. Whether or not the increased GFR observed in conjunction with the low GI diets contributes ad-versely to clinical outcomes long-term remains to be determined.
Our study suggests that reducing GI or %carb share a common pathway for affecting eGFRcys (Additional file 1: Figure S2). These changes are independent of markers of plasma glucose homeostasis, endothelial function, and inflammation, implying that dietary carbohydrates may Table 4Change in estimated glomerular filtration rate based on cystatin C adjusted for fasting glucose, fasting insulin, fasting triglycerides, uric acid, systolic blood pressure, diastolic blood pressure, and high sensitivity C-reactive protein
Reducing glycemic index Change in eGFRcys (95 % CI) P
eGFRcys, mL/min/1.73 m2, unadjusted 1.90 (1.10, 2.70) <0.001
Adjusted for fasting glucose, insulin, triglycerides 1.82 (1.01, 2.63) <0.001
Adjusted for uric acid, systolic blood pressure, diastolic blood pressure 1.47 (0.70, 2.23) <0.001
Adjusted for high sensitivity C-reactive protein 1.89 (1.09, 2.69) <0.001
Adjusted for all the above 1.38 (0.62, 2.15) <0.001
Reducing carbohydrate proportion
eGFRcys, mL/min/1.73 m2, unadjusted 2.97 (1.93, 4.01) <0.001
Adjusted for fasting glucose, insulin, triglycerides 2.51 (1.45, 3.56) <0.001
Adjusted for uric acid, systolic blood pressure, diastolic blood pressure 3.27 (2.28, 4.25) <0.001
Adjusted for high sensitivity C-reactive protein 2.96 (1.92, 4.00) <0.001
Adjusted for all the above 2.84 (1.83, 3.86) <0.001
Reducing both glycemic index and carbohydrate proportion
eGFRcys, mL/min/1.73 m2, unadjusted 4.47 (3.49, 5.44) <0.001
Adjusted for fasting glucose, insulin, triglycerides 3.88 (2.84, 4.92) <0.001
Adjusted for uric acid, systolic blood pressure, diastolic blood pressure 4.14 (3.22, 5.05) <0.001
Adjusted for high sensitivity C-reactive protein 4.50 (3.54, 5.46) <0.001
Adjusted for all the above 3.67 (2.70, 4.64) <0.001
have a direct effect on glomerular filtration [33]. We suspect that these short-term increases in glomerular fil-tration from reducing GI and/or %carb, represent hyper-filtration, a maladaptive response to abnormal renal hemodynamics and a harbinger of kidney injury and kidney disease progression [34, 35]. The long-term im-pact of these short-term changes in eGFRcys on clinical outcomes is unknown. Novel markers of kidney injury in urine [36] may help elucidate the benefit or harm of dietary carbohydrates in future studies.
Cystatin C and β2-microglobulin (β2M) are low mo-lecular mass plasma proteins that are alternative markers to creatinine for estimating GFR and predicting CKD progression [37–39]. Both cystatin C and β2M are gen-erated at a constant rate by all nucleated cells, freely fil-tered by glomeruli, then reabsorbed and metabolized by the proximal tubule with minimal reentry to the blood-stream [40–43]. Serum creatinine reflects GFR, but as a byproduct of protein metabolism it is influenced by diet-ary protein [7] while cystatin C andβ2M do not seem to be influenced by dietary protein [7, 16, 39]. Hence, these markers represent an attractive alternative to creatinine for quantifying GFR in feeding studies that involve changes in dietary protein [7].
In this trial, both cystatin C and β2M were affected by OMNICARB diets in a similar fashion, that is, lower %carb/higher protein or lower GI decreased plasma concentrations of both cystatin C andβ2M. In contrast, creatinine did not decline with lower GI and further in-creased during the low %carb (higher protein)/high GI diet. In absence of measured GFR, this could be inter-preted as either non-GFR effects on both cystatin C and β2M or non-GFR effects on creatinine. These ob-served effects had important ramifications on estimated GFR, which was significantly increased when estimated using cystatin C, but null or decreased when estimated using creatinine. Given the independent biosynthetic pathways of each of these three markers, it is more probable that non-GFR effects would influence one ra-ther than two markers [10], that is in this case, creatin-ine versus both cystatin C and β2M. This underscores the value of non-traditional markers in better estimat-ing changes in GFR [10, 44].
This study has limitations. The feeding periods were too brief to observe dietary effects on clinical events. Furthermore, the study did not include patients with diabetes or CKD, populations that might demonstrate greater changes in kidney function from alterations in dietary carbohydrates. Moreover, the diets were all DASH-like, healthful diets. It is possible that greater ef-fects on kidney function would be observed if the refer-ence diet was a typical American diet. Finally, it should be noted that by design reductions in %carb intake were coupled with increases in both fat and protein to keep
overall caloric intake constant between diets. Thus, it would be inaccurate to conclude that reducing %carb alone increased kidney function. A better interpretation would be that replacing calories from carbohydrates with calories from protein and fat increased kidney function.
This study also has strengths, including being an ancillary of a randomized trial with a diverse popula-tion and high follow-up rates that obtained repeat measures of kidney function. Diets were tightly con-trolled and isocaloric, eliminating the potential effect of weight change on outcomes. Furthermore, we uti-lized alternative kidney markers instead of creatinine, which permitted more accurate assessments of diet-induced changes in GFR [7].
Conclusion
In conclusion, we found that both a low GI and low %carb (i.e. higher protein/fat) diets increased GFR, which possibly reflects hyperfiltration or risk of kidney injury. At this point it is unclear whether the increase in GFR caused by low GI diets would be associated with adverse clinical outcomes. This should be an important focus of future studies on GI and kidney function.
Additional file
Additional file 1:Figure S1.The effects (95% confidence intervals) of reducing glycemic index (GI), reducing the proportion of carbohydrates (%carb), or reducing both GI and %carb on: (A) creatinine (mg/dL) and (B) creatinine-based estimated glomerular filtration rate (eGFRcreat) (mL/min/ 1.73 m2) measured at the end of each feeding period.Figure S2.Scatter plot of the change in cystatin C-based estimated glomerular filtration rate (eGFRcys) (mL/min/1.73 m2) from reducing glycemic index (y-axis) versus reducing proportion of carbohydrate (x-axis). A linear regression line (dashed line) overlays the data (P-value of the coefficient was < 0.001).Table S1.
Baseline change in glomerular filtration markers by subgroup (reference diet is the high glycemic index, high carbohydrate diet).Table S2.Between Diet Comparison Restricted to Visit 1 Only.Table S3.All Between Diet Comparisons. (DOCX 165 kb)
Acknowledgments
The following companies donated food: The Almond Board, International Tree Nut Council, Olivio Premium Products Inc, and The Peanut Institute. This trial is registered at clinicaltrials.gov, number: NCT00608049 (first registered January 23, 2008).
Funding
Funding for this study was provided through grants HL084568 and HL084568 from the National Institutes of Health. SPJ is supported by a NIH/NIDDK T32DK007732-20 Renal Disease Epidemiology Training Grant. ERM was supported by NIH/NHLBI R01HL095448-04.
Availability of data and materials
Data may be made available by contacting the corresponding author.
Authors’contributions
SPJ analyzed data, wrote manuscript. ERM designed study, wrote manuscript. JC & LT participated in the design of the study. LA participated in the design of the study and provided critical edits. AC, CA, and DC provided critical edits. All authors read and approved the final manuscript.
Authors’information
SPJ, LJA, DCC, LT, JC, ERM: The Johns Hopkins School of Medicine, The Johns Hopkins Bloomberg School of Public Health, and The Welch Center for Prevention, Epidemiology and Clinical Research, Johns Hopkins Medical Institutions, Baltimore MD
ARC: Geisinger Health System, Danville, PA
CAMA: University of California San Diego, San Diego, CA.
Competing interests
The authors have no conflicts of interest to report. Portions of this manuscript were presented as an oral presentation at the American Heart Association Epidemiology and Prevention, Lifestyle and Cardiometabolic Health Conference on March 5th, 2015.
Consent for publication
Not applicable.
Ethics approval and consent to participate
Institutional Review Boards at Harvard University and Johns Hopkins University approved the study protocol, and all participants provided written informed consent.
Author details
1The Johns Hopkins School of Medicine, The Johns Hopkins Bloomberg School of Public Health, and The Welch Center for Prevention, Epidemiology and Clinical Research, Johns Hopkins Medical Institutions, 2024 East Monument Street, Suite 1–500, Baltimore, MD 21205, USA.2Geisinger Health System, Danville, PA, USA.3University of California San Diego, San Diego, CA, USA.
Received: 21 September 2015 Accepted: 24 June 2016
References
1. Levey AS, Adler S, Caggiula AW, England BK, Greene T, Hunsicker LG, Kusek JW, Rogers NL, Teschan PE. Effects of dietary protein restriction on the progression of advanced renal disease in the modification of diet in renal disease study. Am J Kidney Dis. 1996;27:652–63.
2. Pedrini MT, Levey AS, Lau J, Chalmers TC, Wang PH. The effect of dietary protein restriction on the progression of diabetic and nondiabetic renal diseases: a meta-analysis. Ann Intern Med. 1996;124:627–32.
3. Fouque D, Laville M, Boissel JP. Low protein diets for chronic kidney disease in non diabetic adults. Cochrane Database Syst Rev. 2006;2:CD001892. 4. Jenkins DJ, Wolever TM, Taylor RH, Barker H, Fielden H, Baldwin JM, Bowling
AC, Newman HC, Jenkins AL, Goff DV. Glycemic index of foods: a physiological basis for carbohydrate exchange. Am J Clin Nutr. 1981;34:362–6.
5. A Report of the Panel on Macronutrients, Subcommittees on Upper Reference Levels of Nutrients and Interpretation and Uses of Dietary Reference Intakes, Standing Committee on the Scientific Evaluation of Dietary Reference Intakes.“6 Dietary Carbohydrates: Sugars and Starches.” Dietary Reference Intakes for Energy, Carbohydrate, Fiber, Fat, Fatty Acids, Cholesterol, Protein, and Amino Acids (Macronutrients). Washington, DC: The National Academies Press; 2005.
6. Gopinath B, Harris DC, Flood VM, Burlutsky G, Brand-Miller J, Mitchell P. Carbohydrate nutrition is associated with the 5-year incidence of chronic kidney disease. J Nutr. 2011;141:433–9.
7. Juraschek SP, Appel LJ, Anderson CAM, Miller 3rd ER. Effect of a high-protein diet on kidney function in healthy adults: results from the OmniHeart trial. Am J Kidney Dis. 2013;61:547–54.
8. Sacks FM, Carey VJ, Anderson CAM, Miller ER, Copeland T, Charleston J, Harshfield BJ, Laranjo N, McCarron P, Swain J, White K, Yee K, Appel LJ. Effects of high vs low glycemic index of dietary carbohydrate on cardiovascular disease risk factors and insulin sensitivity: the OmniCarb randomized clinical trial. JAMA. 2014;312:2531–41.
9. Appel LJ, Moore TJ, Obarzanek E, Vollmer WM, Svetkey LP, Sacks FM, Bray GA, Vogt TM, Cutler JA, Windhauser MM, Lin PH, Karanja N. A clinical trial of the effects of dietary patterns on blood pressure. DASH Collaborative Research Group. N Engl J Med. 1997;336:1117–24.
10. Juraschek SP, Coresh J, Inker LA, Levey AS, Köttgen A, Foster MC, Astor BC, Eckfeldt JH, Selvin E. Comparison of Serum Concentrations ofβ-Trace
Protein,β2-Microglobulin, Cystatin C, and Creatinine in the US Population. Clin J Am Soc Nephrol. 2013;8:584–92.
11. Inker LA, Schmid CH, Tighiouart H, Eckfeldt JH, Feldman HI, Greene T, Kusek JW, Manzi J, Van Lente F, Zhang YL, Coresh J, Levey AS. Estimating glomerular filtration rate from serum creatinine and cystatin C. N Engl J Med. 2012;367:20–9.
12. Levey AS, Stevens LA, Schmid CH, Zhang YL, Castro 3rd AF, Feldman HI, Kusek JW, Eggers P, Van Lente F, Greene T, Coresh J. A new equation to estimate glomerular filtration rate. Ann Intern Med. 2009; 150:604–12.
13. Friedewald WT, Levy RI, Fredrickson DS. Estimation of the concentration of low-density lipoprotein cholesterol in plasma, without use of the preparative ultracentrifuge. Clin Chem. 1972;18:499–502.
14. White H. A heteroskedasticity-consistent covariance matrix estimator and a direct test for heteroskedasticity. Econometrica. 1980;48:817–38. 15. Brenner BM, Meyer TW, Hostetter TH. Dietary protein intake and the
progressive nature of kidney disease: the role of hemodynamically mediated glomerular injury in the pathogenesis of progressive glomerular sclerosis in aging, renal ablation, and intrinsic renal disease. N Engl J Med. 1982;307:652–9.
16. Viberti G, Bognetti E, Wiseman MJ, Dodds R, Gross JL, Keen H. Effect of protein-restricted diet on renal response to a meat meal in humans. Am J Physiol. 1987;253(3 Pt 2):F388–393.
17. Alavi FK, Zawada ET, Simmons JL. Renal hemodynamic and histological consequences of diets high in unsaturated fat, protein or sucrose in obese Zucker rats. Clin Nephrol. 1995;43:122–30.
18. Schrijvers BF, Rasch R, Tilton RG, Flyvbjerg A. High protein-induced glomerular hypertrophy is vascular endothelial growth factor-dependent. Kidney Int. 2002;61:1600–4.
19. Meyer TW, Ichikawa I, Zatz R, Brenner BM. The renal hemodynamic response to amino acid infusion in the rat. Trans Assoc Am Physicians. 1983;96:76–83. 20. Seney FDJ, Persson EG, Wright FS. Modification of tubuloglomerular
feedback signal by dietary protein. Am J Physiol. 1987;252(1 Pt 2):F83–90. 21. Seney FDJ, Wright FS. Dietary protein suppresses feedback control of
glomerular filtration in rats. J Clin Invest. 1985;75:558–68.
22. Thomson SC, Vallon V, Blantz RC. Kidney function in early diabetes: the tubular hypothesis of glomerular filtration. Am J Physiol Renal Physiol. 2004;286:F8–15. 23. Yao B, Xu J, Qi Z, Harris RC, Zhang M-Z. Role of renal cortical
cyclooxygenase-2 expression in hyperfiltration in rats with high-protein intake. Am J Physiol Renal Physiol. 2006;291:F368–374.
24. Tolins JP, Shultz PJ, Westberg G, Raij L. Renal hemodynamic effects of dietary protein in the rat: role of nitric oxide. J Lab Clin Med. 1995;125: 228–36.
25. Bouhanick B, Suraniti S, Berrut G, Bled F, Simard G, Lejeune JJ, Fressinaud P, Marre M. Relationship between fat intake and glomerular filtration rate in normotensive insulin-dependent diabetic patients. Diabete Metab. 1995;21:168–72.
26. Cao J, Inoue K, Sodhi K, Puri N, Peterson SJ, Rezzani R, Abraham NG. High-fat diet exacerbates renal dysfunction in SHR: reversal by induction of HO-1-adiponectin axis. Obesity (Silver Spring). 2012;20:945–53.
27. Lu J, Bankovic-Calic N, Ogborn M, Saboorian MH, Aukema HM. Detrimental effects of a high fat diet in early renal injury are ameliorated by fish oil in Han:SPRD-cy rats. J Nutr. 2003;133:180–6.
28. Buyken AE, Flood V, Empson M, Rochtchina E, Barclay AW, Brand-Miller J, Mitchell P. Carbohydrate nutrition and inflammatory disease mortality in older adults. Am J Clin Nutr. 2010;92:634–43.
29. Adeyi AO, Idowu BA, Mafiana CF, Oluwalana SA, Ajayi OL, Akinloye OA. Rat model of food-induced non-obese-type 2 diabetes mellitus: comparative pathophysiology and histopathology. Int J Physiol Pathophysiol Pharmacol. 2012;4:51–8.
30. Roberts CK, Barnard RJ, Sindhu RK, Jurczak M, Ehdaie A, Vaziri ND. A high-fat, refined-carbohydrate diet induces endothelial dysfunction and oxidant/ antioxidant imbalance and depresses NOS protein expression. J Appl Physiol. 2005;98:203–10.
31. Roberts CK, Vaziri ND, Sindhu RK, Barnard RJ. A high-fat, refined-carbohydrate diet affects renal NO synthase protein expression and salt sensitivity. J Appl Physiol. 2003;94:941–6.
33. Schwingshackl L, Hoffmann G. Comparison of high vs. normal/low protein diets on renal function in subjects without chronic kidney disease: a systematic review and meta-analysis. PLoS One. 2014;9:e97656. 34. Premaratne E, Macisaac RJ, Tsalamandris C, Panagiotopoulos S, Smith T,
Jerums G. Renal hyperfiltration in type 2 diabetes: effect of age-related decline in glomerular filtration rate. Diabetologia. 2005;48:2486–93. 35. Brenner BM, Lawler EV, Mackenzie HS. The hyperfiltration theory: a paradigm
shift in nephrology. Kidney Int. 1996;49:1774–7.
36. Miller ER, Juraschek SP, Anderson CA, Guallar E, Henoch-Ryugo K, Charleston J, Turban S, Bennett MR, Appel LJ. The effects of n-3 long-chain polyunsaturated fatty acid supplementation on biomarkers of kidney injury in adults with diabetes: results of the GO-FISH trial. Diabetes Care. 2013;36:1462–9. 37. Aksun SA, Ozmen D, Ozmen B, Parildar Z, Mutaf I, Turgan N, Habif S,
Kumanliogluc K, Bayindir O. Beta2-microglobulin and cystatin C in type 2 diabetes: assessment of diabetic nephropathy. Experimental and clinical endocrinology & diabetes : official journal, German Society of Endocrinology [and] German Diabetes Association. 2004;112:195–200.
38. Viberti GC, Keen H, Mackintosh D. Beta 2-microglobulinaemia: a sensitive index of diminishing renal function in diabetics. Br Med J (Clin Res Ed). 1981;282:95–8.
39. Tangri N, Inker LA, Tighiouart H, Sorensen E, Menon V, Beck G, Shlipak M, Coresh J, Levey AS, Sarnak MJ. Filtration markers may have prognostic value independent of glomerular filtration rate. J Am Soc Nephrol. 2012;23: 351–9.
40. Vincent C, Revillard JP. Beta-2-microglobulin and HLA-related glycoproteins in human urine and serum. Contrib Nephrol. 1981;26:66–88.
41. Filler G, Bökenkamp A, Hofmann W, Le Bricon T, Martínez-Brú C, Grubb A. Cystatin C as a marker of GFR–history, indications, and future research. Clin Biochem. 2005;38:1–8.
42. Finney H, Newman DJ, Gruber W, Merle P, Price CP. Initial evaluation of cystatin C measurement by particle-enhanced immunonephelometry on the Behring nephelometer systems (BNA, BN II). Clin Chem. 1997;43(6 Pt 1): 1016–22.
43. Filler G, Priem F, Lepage N, Sinha P, Vollmer I, Clark H, Keely E, Matzinger M, Akbari A, Althaus H, Jung K. Beta-trace protein, cystatin C, beta(2)-microglobulin, and creatinine compared for detecting impaired glomerular filtration rates in children. Clin Chem. 2002;48:729–36. 44. Rebholz CM, Grams ME, Matsushita K, Selvin E, Coresh J. Change in novel
filtration markers and risk of ESRD. Am J Kidney Dis. 2014.
• We accept pre-submission inquiries
• Our selector tool helps you to find the most relevant journal • We provide round the clock customer support
• Convenient online submission • Thorough peer review
• Inclusion in PubMed and all major indexing services • Maximum visibility for your research
Submit your manuscript at www.biomedcentral.com/submit