R E S E A R C H
Open Access
Physical activity and sedentary behavior patterns
using accelerometry from a national sample of
United States adults
Kelly R Evenson
1*, Fang Wen
1, Jesse S Metzger
2and Amy H Herring
3Abstract
Background:This study described the patterns of accelerometer-determined physical activity and sedentary behavior among adults using a nationally representative sample from the United States.
Methods:Using 2003-2006 National Health and Nutrition Examination Survey (NHANES) data, 7931 adults at least 18 years old wore an ActiGraph accelerometer for one week, providing at least 3 days of wear for >=8 hours/day. Cutpoints defined moderate to vigorous physical activity (MVPA; >= 2020 and >=760 counts/minute), vigorous physical activity (> = 5999 counts/minute), and sedentary behavior (<100 counts/minute). Latent class analysis (LCA) was used to estimate patterns of physical activity and sedentary behavior. All estimates were weighted to reflect the United States population.
Results: For weighted percent of MVPA out of total wearing time, 5 classes were identified from least to most active: 65.3% of population (weighted mean 9.3 minutes/day), 24.9% (32.1 minutes/day), 3.2% that was low on the weekdays but much higher on the weekends (52.0 minutes/day), 5.9% (59.9 minutes/day), and 0.7% in the highest class (113.6 minutes/day). Using the lower MVPA threshold, 6 classes emerged with each class ranging in population from 1.2% to 43.6%. A vigorous activity class could not be derived due to low prevalence. For weighted percent of sedentary behavior out of total wearing time, 5 classes were identified from most to least sedentary: 6.3% of population (weighted mean 660.2 minutes/day), 25.1% (546.8 minutes/day), 37.7% (453.9 minutes/day), 24.0% (354.8 minutes/day), and 7.0% (256.3 minutes/day). Four of the classes showed generally similar results across every day of the week, with the absolute percents differing across classes. In contrast, the least sedentary class showing a marked rise in percent of time spent in sedentary behavior on the weekend (weighted mean 336.7-346.5 minutes/day) compared to weekdays (weighted mean 255.2-292.4 minutes/day).
Conclusion:The LCA models provided a data reduction process to identify patterns using minute-by-minute accelerometry data in order to explore meaningful contrasts. The models supported 5 or 6 distinct patterns for MVPA and sedentary behavior. These physical activity and sedentary behavior patterns can be used as intervention targets and as independent or dependent variables in future studies of correlates, determinants, or outcomes.
Keywords:Accelerometry, Latent class analysis, Moderate to vigorous physical activity, Surveillance, Weekend warrior
* Correspondence:[email protected]
1Department of Epidemiology, Gillings School of Global Public Health,
University of North Carolina Chapel Hill, 137 East Franklin Street, Suite 306, Chapel Hill, NC, USA
Full list of author information is available at the end of the article
Introduction
In 2008, the United States government released its first physical activity recommendations [1] about the types and amounts of physical activity recommended to offer sub-stantial health benefits to all Americans. The guidelines were based, in part, on epidemiologic studies of health outcomes, including all-cause and cardiovascular disease mortality. Those studies relied almost exclusively on self-reported physical activity. Self-self-reported measures, such as questionnaires, have a limited ability to detect physical ac-tivity that is routine and interspersed throughout the day, such as unstructured activities. These tend to be activities that are light or sedentary. As a complement to self-report, accelerometers can provide detailed measures of time spent in both physical activity and sedentary behavior.
Prior epidemiologic work using accelerometry typic-ally categorizes physical activity into number of minutes or bout minutes (defined as extended periods of time in a certain level of intensity). While this grouping is useful, it ignores potential differences in the patterns of accumulated physical activity over time. For ex-ample, one weekly pattern of physical activity to emerge from self-reported questionnaires is the“weekend warrior” [2,3]. This pattern is characterized by accumulation of a high total volume of physical activity during the weekend and much less total volume on the weekdays. Lee et al. [2] quantified this as at least 1000 kilocalo-ries from sports or recreational activities over 1-2 days/ week, while Kruger et al. [3] quantified this as at least 150 minutes of moderate to vigorous physical activity (MVPA)/week performed on 1-2 days/week. Accelero-metry can provide information even down to the sec-ond on physical activity and sedentary behavior, allowing for more precise exploration into the patterning of these behaviors.
Latent class analysis (LCA) is a method that can be applied to accelerometry, whereby participants are as-sumed to belong to one of several mutually exclusive classes, but for which class membership is not known a priori. Through a statistical model, the latent class analysis assigns participants to a category (class) based on the associations among observed variables. This tech-nique provides a method to identify patterns of physical activity classes, such as the weekend warrior class. Thus far, only a few accelerometry studies of adults have applied LCA techniques [4,5] and we found no LCA studies of adults that explored sedentary behavior patterns. Thus, this study employed LCA techniques to describe patterns of accelerometer-assessed physical activity and sedentary behavior among a national sample of US adults. The resulting patterns were described by age, gender, and race/ ethnicity to understand how the patterns varied by socio-demographic characteristics.
Methods Data sources
Through in-person interviews and physical examinations, the National Health and Nutrition Examination Survey (NHANES) provides a cross-sectional assessment of nutri-tion and health of the US populanutri-tion. The data used in this study were obtained during 2003 to 2006, the most recently available data with accelerometer assessed phys-ical activity. Participants provided informed consent be-fore completing any questionnaires or measurements. The overarching project was reviewed by the University of North Carolina Institutional Review Board.
Physical activity measurement by accelerometry
Those who participated in the physical activity monitor examination were asked to wear the ActiGraph acceler-ometer (model #AM7164) on their hip for seven con-secutive days during waking hours and outside of any water-based activities. Beginning at midnight on the day following the clinic visit, the accelerometer recorded 1-minute epochs of analog acceleration and converted it to a digital signal [6]. Non-wear was defined by an inter-val of at least 90 consecutive minutes of zero counts/ minute, with allowance of 1 or 2 minutes of nonzero counts if no counts were detected during both the 30 minutes upstream and downstream from that interval; any nonzero counts except the allowed short intervals were considered as wear time [7]. Counts in the non-wear period were set to missing.
The ActiGraph accelerometer assessed acceleration using counts as the output metric. To interpret counts, re-searchers use cutpoints or thresholds to characterize activities by intensity, which includes sedentary, light, moderate, or vigorous activity. We used cutpoints origin-ally applied to NHANES [8]. Vigorous intensity was de-fined as > =5999 counts/minute and moderate intensity as 2020-5998 counts/minute. This higher cutpoint approxi-mates moderate activity based primarily on treadmill walking or running. A lower moderate intensity threshold was calculated based on studies that incorporated more lifestyle activities, defined as > =760 counts/minute [9]. We refer to these two MPVA cutpoints based on the first author’s last names (Troiano and Matthews, respectively). Another type of MVPA was categorized based on time spent in MVPA bouts, separately for the Troiano and Matthews cutpoints, with a bout defined as at least 10 minutes of consecutive MVPA with allowance for interruptions of up to 20% below the threshold and with <5 consecutive minutes below the threshold. A MVPA bout also had to start and end with a count over the threshold.
threshold and with <5 consecutive minutes above the threshold [11]. A sedentary bout had to start and end with a count below the threshold.
Other measures
Self-reported sociodemographic measures used in this study included age, gender, and race/ethnicity (Non-Hispanic White, Non-Hispanic Black, Hispanic, other). In the NHANES data, participants age 85 or older were top coded to age 85 in order to protect their confidentiality. We explored age in categories, so this categorization did not affect our results.
Statistical methods
The sample was limited to those age 18 years and older (n = 11,183), who participated in the accelerometer por-tion of NHANES during 2003-2006 (n = 9601). We fur-ther excluded 619 participants whose accelerometer was not in calibration or was faulty upon return (i.e., record-ing no counts) and 1051 who did not provide at least 3 days of accelerometer wear for 8 or more hours per day over a seven-day period. This left a final sample size of 7931 in which 5.8% wore it three days (n = 459), 8.1% wore it four days (n = 645), 12.6% wore it five days (n = 998), 21.9% wore it six days (n = 1740), and 51.6% wore it 7 days (n = 4089). In addition, we explored the latent class analyses only among those who contributed two adherent weekend days (and therefore at least one adherent week-day; n = 5430).
To account for the differential probability of selection, all percents and means were weighted to the 2000 census using the 4-year sample weights provided by NHANES. The data were nested (i.e., screener, household inter-view, examination), such that non-response and post-stratification adjustments were applied.
Using LCA, we used up to 7 adherent days from the participant’s accelerometer file to determine classes, or natural groupings, of participants who tended to accu-mulate their physical activity or sedentary behavior in a similar pattern. The derived classes were among participants who shared similar means, separately cal-culated for the following indicators (all weighted):
– counts/minute per day (an indicator of total volume),
– percent of MVPA out of total wearing time per day (using both the Troiano and Matthews cutpoints),
– percent of MVPA bouts out of total wearing time per day (using both the Troiano and Matthews cutpoints),
– percent of sedentary behavior out of total wearing time per day, and
– percent of sedentary bouts out of total wearing time per day.
While we explored using absolute minutes (both with and without control for wearing time), the final classes for MVPA and sedentary behavior were based on relative per-cents in order to best account for accelerometer wearing time. We also conducted analyses among a subset of par-ticipants with both weekend days, in order to make sure no unique pattern was missed due to non-wear. In the end, this only impacted sedentary bouts, for which more classes emerged as a result. We were unable to derive per-cent of time in vigorous activity out of total wearing time due to few participants engaging in vigorous activity.
Several criteria were used to select the final number of classes for each physical activity or sedentary behavior vari-able. These criteria included:
(1) the bootstrap likelihood ratio test, which compared the fit of k classes to (k-1) classes,
(2) sample size of the classes, requiring each class to have no fewer than 50 participants, and
(3) substantive knowledge, including a practical interpretation of what each class represented, along with visual inspection, to ensure that the classes were sufficiently separated from each other (entropy).
The LCA was performed using MPlus (version 7.11) [12], which allowed for the complex survey design in conjunc-tion with the modeling. Mixture modelling was applied to describe the relationship between up to 7 adherent days of accelerometry and the categorical latent variable using a set of linear regression equations. Due to the large number of participants with zero for percent of MVPA bouts out of total wearing time (Troiano or Matthews), the LCA with zero-inflated negative binomial models were used.
For each variable, a 4-class model was estimated first, based on two prior NHANES analyses [4,5]. We also ex-amined 3-class models and continued models up to 12 classes if necessary, but stopped at this point since the sample sizes of the most active and most sedentary classes usually became too small. Each participant was assigned to one class based on the highest posterior class member-ship probability (modal allocation), separately for each variable. Using SAS® release 9.3 (Cary, North Carolina), classes were explored using the weighted means of each variable by day of the week and by accelerometer wear time. Weighted means of class assignments were also cal-culated for all variables overall and by age, gender, and race/ethnicity. Spearman correlation coefficients were cal-culated to compare the two MVPA definitions.
Results
out of total wearing time per day. Using linear regression the bootstrap likelihood ratio test was <0.001 for each vari-able. Participants were classified into 6 classes for counts/ minute and percent of MVPA out of total wearing time per day (Matthews), and 7 classes for percent of sedentary bouts out of total wearing time per day. The bootstrap likelihood ratio test was <0.001 for each variable. For all variables, the graphs of the classes by day are shown in Figures 1, 2, 3, 4, 5, 6 and 7 and the weighted mean per-cents by day are detailed in Additional file 1.
For each variable, we explored accelerometer wearing time overall and by day within each derived class. For all seven variables, weighted mean weekly accelerometer wear time ranged from 13.3 to 14.6 hours/day by derived class. Generally longer mean wear was documented for classes with less MVPA and more sedentary behavior (Additional file 2).
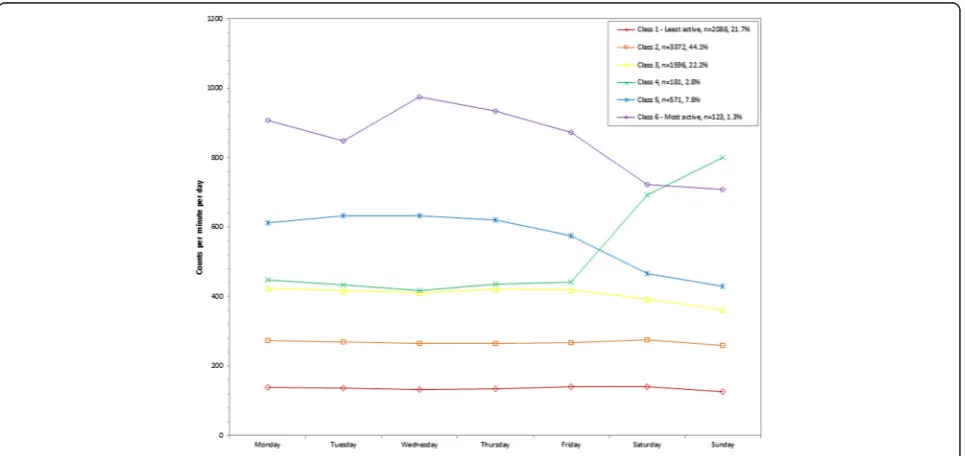
Total volume
An indicator of total volume of physical activity ranged from a weighted mean of 135.4 (class 1) to 852.4 (class 6) counts/minute across the 6 classes (Table 1). The two most active classes represented 9.1% of the population and indicated stable higher weighted means on the week-days (class 5: 575.6 (Friday) to 631.7 (Tuesday) counts/ minute; class 6: 846.8 (Tuesday) to 974.9 (Wednesday) counts/minute) and lower on the weekends (class 5: 429.4 (Sunday) to 465.3 (Saturday) counts/minute; class 6: 707.9 (Sunday) to 723.6 (Saturday) counts/minute) (Figure 1). A unique class emerged with lower weighted means on the weekdays (class 4: 417.5 (Wednesday) to 448.2 (Monday) counts/minute) and higher on the weekends (692.2
(Saturday) to 801.5 (Sunday) counts/minute). The remaining three classes (class 1-3) were relatively stable across the week and had the lowest weighted mean counts/minute.
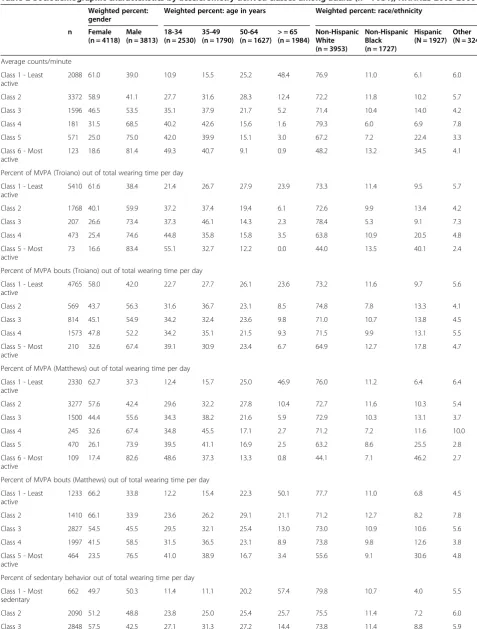
Females had higher representation in the least active two classes for weighted mean counts/minute (61.0% class 1, 58.9% class 2; Table 2). Males were much more likely to be represented in the most active three classes (68.5% to 81.4%). In the least active class, adults > =65 years (48.4%) and Non-Hispanic Whites (76.9%) had much higher rep-resentation compared to other categories. Adults 18-34 were over represented the most active class (49.3%).
MVPA
MVPA was explored using two definitions: a higher cut-point termed “Troiano” and a lower cutpoint termed “Matthews”. The Spearman correlation between the two was 0.62 for MVPA minutes/day and 0.57 for MVPA bout minutes/day.
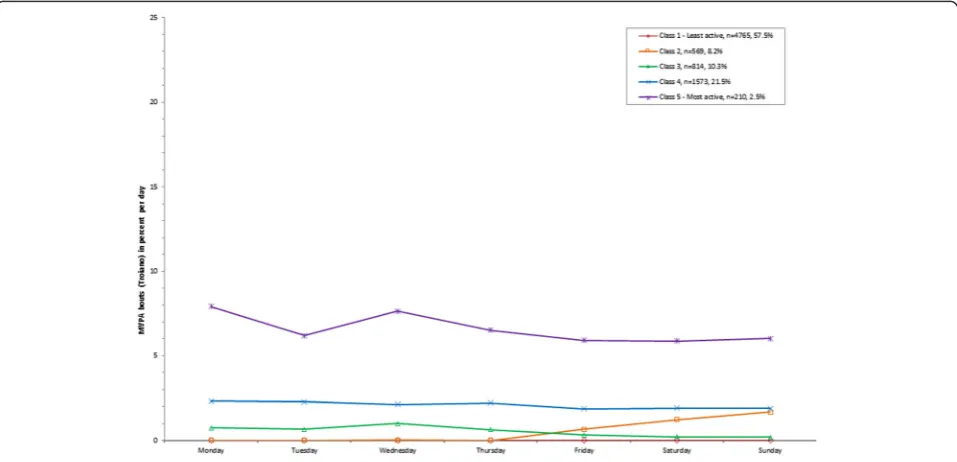
The weighted mean percent of MVPA (Troiano) out of total wearing time per day ranged from 1.2% (class 1) for the least active class to 16.1% (class 5) for the most active class (9.3 to 113.6 minutes/day) (Table 1). A week-end warrior class emerged for 3.2% of the population (class 3; Figure 2), with a weighted mean MVPA of 43.3 (Wednesday) to 51.4 (Thursday) minutes/day on week-days, 78.4 on Saturday, and 95.2 on Sunday. The most active class emerged for 0.7% of the population (class 5), with a higher percent of MVPA out of total wearing time on the weekdays (127.6 (Friday) to 159.6 (Wednesday) minutes/day) and a lower percent on the weekends (92.1 (Sunday) to 112.1 (Saturday) minutes/day), but still high relative to all other classes. A parallel class but with
lower absolute percentages also emerged for 5.9% of the sample (class 4), with a higher percent of MVPA out of total wearing time on the weekdays (68.5 (Friday) to 82.0 (Wednesday) minutes/day) and a lower percent on the weekends (39.0 (Sunday) to 47.6 (Saturday) minutes/day). In contrast, the least active class included 65.3% of the population (class 1) and ranged from a weighted mean of 8.9 (Sunday) to 10.8 (Monday) minutes/day in MVPA across the week.
The weighted mean percent of MVPA bouts (Troiano) out of total wearing time per day ranged from 0% (class 1) to 6.7% (class 5; 0 to 53.3 minutes/day; Table 1). The
least active class comprised 57.5% of the population and comprised all zeros for the weighted mean percent across the week (class 1; Figure 3). A variation of the weekend warrior class emerged for 8.2% of the population (class 2), with a low weighted mean percent of time spent in MVPA bouts for Monday through Thursday (0.0 to 0.2 minutes/ day) compared to Friday (5.8 minutes/day), Saturday (10.2 minutes/day), and Sunday (13.3 minutes/day). The most active class represented 2.5% of the population and had much higher percent of time spent in MVPA bouts for every day of the week, ranging from 45.0 (Sunday) to 66.5 (Monday) minutes/day.
Figure 2Latent class analysis plotted for weighted percent of moderate to vigorous physical activity (MVPA; Troiano) out of total wearing time per day; NHANES 2003-2006.
Using the lower Matthews cutpoint, the weighted mean percent of MVPA out of total wearing time per day ranged from 4.4% (class 1) to 39.5% (class 6; 34.6 to 266.3 mi-nutes/day; Table 1). A small percent of the population (1.2%) were assigned to the most active class (class 6) and had a higher percent of MVPA out of total wearing time on the weekdays (328.7 (Friday) to 358.6 (Monday) minutes/day) compared to the weekends (226.9 (Saturday)
to 237.0 (Sunday) minutes/day; Figure 4). A similar paral-lel class emerged with lower relative percents (class 5), ranging from 218.0 (Friday) to 255.1 (Tuesday) minutes/ day on the weekdays compared to 129.0 (Sunday) to 152.7 (Saturday) minutes/day on the weekends. Overall, 3.8% of the population was assigned to a class with lower percents on the weekdays (178.6 (Wednesday) to 198.1 (Monday) minutes/day) but higher on the weekends (246.4 (Sunday) Figure 4Latent class analysis plotted for weighted percent of moderate to vigorous physical activity (MVPA; Matthews) out of total wearing time per day; NHANES 2003-2006.
to 251.6 (Saturday) minutes/day; class 4). The least active class (class 1) included 24.3% of the population and the weighted mean percent of MVPA out of total wearing time ranged from 33.2 (Sunday) to 39.6 (Friday) minutes/ day across the week.
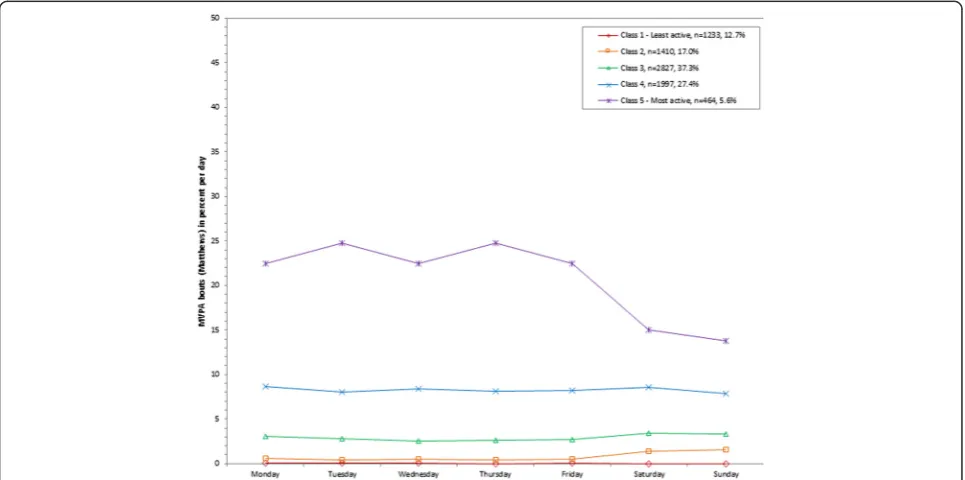
The weighted mean percent of MVPA bouts (Matthews) out of total wearing time per day ranged from 0% (class 1) to 21.3% (class 5; 0.2 to 175.4 minutes/day; Table 1). The most active class comprised 5.6% of the population, with higher percents both on the weekdays (185.4 (Friday) to 212.4 (Tuesday) minutes/day) and weekends (109.8 (Sunday) to 124.1 (Saturday) minutes/day) compared
to the other classes (Figure 5). The least active class (class 1) included 12.7% of the population with almost no time spent in MVPA bouts across all days of the week (0.0 to 0.3 minutes/day). A second class also with very few mi-nutes in MVPA bouts emerged for another 17.0% of the population (3.7 (Thursday) to 5.1 (Monday) minutes/day on weekdays; 11.4 (Saturday) to 12.5 (Sunday) minutes/ day on weekends; class 2).
Females comprised a higher percent of the least active class for weighted mean percent of MVPA and MVPA bouts (Troiano or Matthews) out of total wearing time (Table 2). Adults > =65 years comprised a higher percent Figure 6Latent class analysis plotted for weighted percent of sedentary behavior out of total wearing time per day;
NHANES 2003-2006.
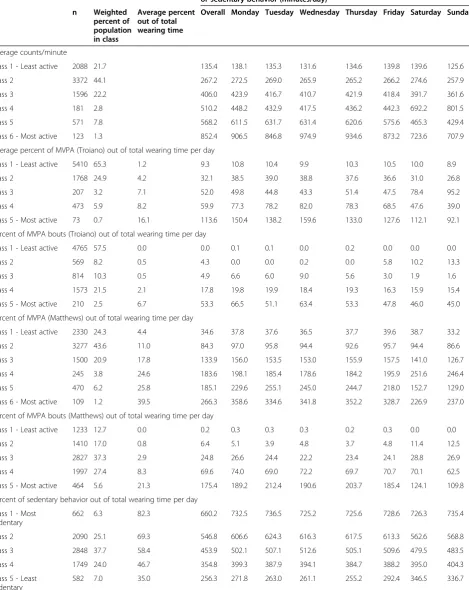
Table 1 Latent classes derived from accelerometry among adults (n = 7931); NHANES 2003-2006
Weighted mean of average counts/minute, MVPA (minutes/day), or sedentary behavior (minutes/day)
n Weighted
percent of population in class
Average percent out of total wearing time
Overall Monday Tuesday Wednesday Thursday Friday Saturday Sunday
Average counts/minute
Class 1 - Least active 2088 21.7 135.4 138.1 135.3 131.6 134.6 139.8 139.6 125.6
Class 2 3372 44.1 267.2 272.5 269.0 265.9 265.2 266.2 274.6 257.9
Class 3 1596 22.2 406.0 423.9 416.7 410.7 421.9 418.4 391.7 361.6
Class 4 181 2.8 510.2 448.2 432.9 417.5 436.2 442.3 692.2 801.5
Class 5 571 7.8 568.2 611.5 631.7 631.4 620.6 575.6 465.3 429.4
Class 6 - Most active 123 1.3 852.4 906.5 846.8 974.9 934.6 873.2 723.6 707.9
Average percent of MVPA (Troiano) out of total wearing time per day
Class 1 - Least active 5410 65.3 1.2 9.3 10.8 10.4 9.9 10.3 10.5 10.0 8.9
Class 2 1768 24.9 4.2 32.1 38.5 39.0 38.8 37.6 36.6 31.0 26.8
Class 3 207 3.2 7.1 52.0 49.8 44.8 43.3 51.4 47.5 78.4 95.2
Class 4 473 5.9 8.2 59.9 77.3 78.2 82.0 78.3 68.5 47.6 39.0
Class 5 - Most active 73 0.7 16.1 113.6 150.4 138.2 159.6 133.0 127.6 112.1 92.1
Percent of MVPA bouts (Troiano) out of total wearing time per day
Class 1 - Least active 4765 57.5 0.0 0.0 0.1 0.1 0.0 0.2 0.0 0.0 0.0
Class 2 569 8.2 0.5 4.3 0.0 0.0 0.2 0.0 5.8 10.2 13.3
Class 3 814 10.3 0.5 4.9 6.6 6.0 9.0 5.6 3.0 1.9 1.6
Class 4 1573 21.5 2.1 17.8 19.8 19.9 18.4 19.3 16.3 15.9 15.4
Class 5 - Most active 210 2.5 6.7 53.3 66.5 51.1 63.4 53.3 47.8 46.0 45.0
Percent of MVPA (Matthews) out of total wearing time per day
Class 1 - Least active 2330 24.3 4.4 34.6 37.8 37.6 36.5 37.7 39.6 38.7 33.2
Class 2 3277 43.6 11.0 84.3 97.0 95.8 94.4 92.6 95.7 94.4 86.6
Class 3 1500 20.9 17.8 133.9 156.0 153.5 153.0 155.9 157.5 141.0 126.7
Class 4 245 3.8 24.6 183.6 198.1 185.4 178.6 184.2 195.9 251.6 246.4
Class 5 470 6.2 25.8 185.1 229.6 255.1 245.0 244.7 218.0 152.7 129.0
Class 6 - Most active 109 1.2 39.5 266.3 358.6 334.6 341.8 352.2 328.7 226.9 237.0
Percent of MVPA bouts (Matthews) out of total wearing time per day
Class 1 - Least active 1233 12.7 0.0 0.2 0.3 0.3 0.3 0.2 0.3 0.0 0.0
Class 2 1410 17.0 0.8 6.4 5.1 3.9 4.8 3.7 4.8 11.4 12.5
Class 3 2827 37.3 2.9 24.8 26.6 24.4 22.2 23.4 24.1 28.8 26.9
Class 4 1997 27.4 8.3 69.6 74.0 69.0 72.2 69.7 70.7 70.1 62.5
Class 5 - Most active 464 5.6 21.3 175.4 189.2 212.4 190.6 203.7 185.4 124.1 109.8
Percent of sedentary behavior out of total wearing time per day
Class 1 - Most sedentary
662 6.3 82.3 660.2 732.5 736.5 725.2 725.6 728.6 726.3 735.4
Class 2 2090 25.1 69.3 546.8 606.6 624.3 616.3 617.5 613.3 562.6 568.8
Class 3 2848 37.7 58.4 453.9 502.1 507.1 512.6 505.1 509.6 479.5 483.5
Class 4 1749 24.0 46.7 354.8 399.3 387.9 394.1 384.7 388.2 395.0 404.3
Class 5 - Least sedentary
of the least active class for percent of MVPA and MVPA bouts (Matthews) out of total wearing time. When com-paring across classes, Hispanics comprised the highest relative proportion for the most active MVPA and MVPA bout classes (Troiano or Matthews).
Sedentary behavior
The weighted mean percent of sedentary behavior out of total wearing time per day ranged from 35.0% (class 5) to 82.3% (class 1; 256.3 to 660.2 minutes/day; Table 1). All classes were stable across each day of the week except for the least sedentary group, which showed higher values on the weekends (336.7 (Sunday) to 346.5 (Saturday) minutes/day) compared to weekdays (255.2 (Thursday) to 292.4 (Friday) minutes/day; Figure 6). Overall, 31.4% of population was in the two most sedentary classes (class 1 mean 660.2 minutes/day; class 2 mean 546.8 minutes/ day).
The weighted mean percent of sedentary bouts out of total wearing time per day ranged from 19.5% (class 7) to 85.6% (class 1; 159.0 to 746.7 minutes/day; Table 1). The class with the lowest percent of time spent in sed-entary bouts comprised 20.3% of the population, with lower percents relative to the other classes across all days of the week (144.8 (Wednesday) to 166.0 minutes/ day (Monday) on weekdays and 181.7 (Saturday) to 199.8 (Sunday) minutes/day on weekends; Figure 7). In contrast, 5.6% of the population was in the most sedentary class (749.0 (Wednesday) to 767.6 (Sunday) minutes/day across the week; class 1). A class emerged for 4.1% of adults wherein time spent in sedentary bouts was lower on the weekdays (186.6 (Thursday) to 288.2 (Friday) minutes/ day) but higher on the weekends (441.9 (Sunday) to 551.3 (Saturday) minutes/day; class 6). An opposite class emerged for 8.7% of adults wherein time spent in sed-entary bout was higher on the weekdays (420.9 (Friday) to 534.8 (Wednesday) minutes/day) but lower on the weekends (246.1 (Saturday) to 302.1 (Sunday) minutes/ day; class 3).
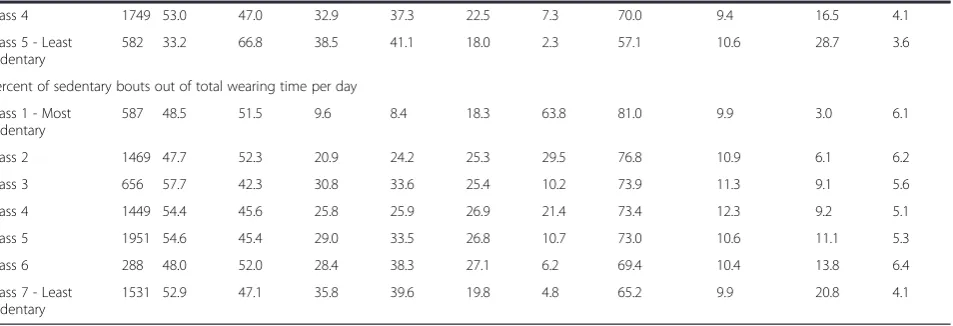
Males represented a higher weighted mean percent of the class with the lowest percent of sedentary behavior out of total wearing time, but not for sedentary bouts (Table 2). The most sedentary and sedentary bout classes (class 1) were over represented by adults > =65 years. When comparing across classes, Hispanics comprised the highest relative proportion for the least sedentary and sedentary bout classes.
Discussion
The LCA models provided a data reduction process to help identify patterns using minute-by-minute accelero-metry data in order to explore meaningful contrasts. The models supported at least 5 or more distinct pat-terns for indicators of the total volume of physical activity (i.e., counts/minute), as well as MVPA and sedentary be-havior both overall and in bouts. For both definitions of MVPA, the two least active classes represented the largest proportion of the population, and generally included a higher proportion of females and those 65 years and older. For sedentary behavior, most adults were assigned to the middle three sedentary classes (class 2 to 4).
As reported previously [8], participation in vigorous activity was low in the NHANES sample from 2003-2006, such that the LCA did not produce stable results when explored. This was also encountered by Metzger et al. [4] using 2003-2004 NHANES data on adults. Thus, we could only explore vigorous activity combined with moderate activity. In our analyses, we also explored other formulations of MVPA and MVPA bouts, including minutes/day and minutes/day controlling for total wear-ing time per day. We found that although wearwear-ing time did not affect the classification of MVPA very much, the MVPA time as a percent of wearing time was the best representation of this variable, since it accounted for total wearing time per day and most efficiently sepa-rated unique latent classes.
MVPA bouts (Troiano and Matthews) was particularly challenging to model correctly due to the skewness of
Table 1 Latent classes derived from accelerometry among adults (n = 7931); NHANES 2003-2006(Continued)
Percent of sedentary bouts out of total wearing time per day
Class 1 - Most sedentary
587 5.6 85.6 746.7 760.6 761.5 749.0 749.1 751.0 757.7 767.6
Class 2 1469 17.3 66.2 568.9 578.5 597.4 591.5 587.4 585.0 527.6 548.5
Class 3 656 8.7 49.2 425.7 448.0 518.5 534.8 523.0 420.9 246.1 302.1
Class 4 1449 17.9 51.0 441.0 436.8 426.1 416.1 418.2 446.1 490.0 486.1
Class 5 1951 26.0 35.6 300.8 305.2 293.6 315.9 306.6 308.2 274.4 323.0
Class 6 288 4.1 35.1 292.1 204.8 208.2 195.4 186.6 288.2 551.3 441.9
Class 7 - Least sedentary
1531 20.3 19.5 159.0 166.0 153.5 144.8 146.3 156.5 181.7 199.8
Table 2 Sociodemographic characteristics by accelerometry derived classes among adults (n = 7931); NHANES 2003-2006
Weighted percent: gender
Weighted percent: age in years Weighted percent: race/ethnicity
n Female
(n = 4118) Male (n = 3813)
18-34 (n = 2530)
35-49 (n = 1790)
50-64 (n = 1627)
> = 65 (n = 1984)
Non-Hispanic White (n = 3953)
Non-Hispanic Black (n = 1727)
Hispanic (N = 1927)
Other (N = 324)
Average counts/minute
Class 1 - Least active
2088 61.0 39.0 10.9 15.5 25.2 48.4 76.9 11.0 6.1 6.0
Class 2 3372 58.9 41.1 27.7 31.6 28.3 12.4 72.2 11.8 10.2 5.7
Class 3 1596 46.5 53.5 35.1 37.9 21.7 5.2 71.4 10.4 14.0 4.2
Class 4 181 31.5 68.5 40.2 42.6 15.6 1.6 79.3 6.0 6.9 7.8
Class 5 571 25.0 75.0 42.0 39.9 15.1 3.0 67.2 7.2 22.4 3.3
Class 6 - Most active
123 18.6 81.4 49.3 40.7 9.1 0.9 48.2 13.2 34.5 4.1
Percent of MVPA (Troiano) out of total wearing time per day
Class 1 - Least active
5410 61.6 38.4 21.4 26.7 27.9 23.9 73.3 11.4 9.5 5.7
Class 2 1768 40.1 59.9 37.2 37.4 19.4 6.1 72.6 9.9 13.4 4.2
Class 3 207 26.6 73.4 37.3 46.1 14.3 2.3 78.4 5.3 9.1 7.3
Class 4 473 25.4 74.6 44.8 35.8 15.8 3.5 63.8 10.9 20.5 4.8
Class 5 - Most active
73 16.6 83.4 55.1 32.7 12.2 0.0 44.0 13.5 40.1 2.4
Percent of MVPA bouts (Troiano) out of total wearing time per day
Class 1 - Least active
4765 58.0 42.0 22.7 27.7 26.1 23.6 73.2 11.6 9.7 5.6
Class 2 569 43.7 56.3 31.6 36.7 23.1 8.5 74.8 7.8 13.3 4.1
Class 3 814 45.1 54.9 34.2 32.4 23.6 9.8 71.0 10.7 13.8 4.5
Class 4 1573 47.8 52.2 34.2 35.1 21.5 9.3 71.5 9.9 13.1 5.5
Class 5 - Most active
210 32.6 67.4 39.1 30.9 23.4 6.7 64.9 12.7 17.8 4.7
Percent of MVPA (Matthews) out of total wearing time per day
Class 1 - Least active
2330 62.7 37.3 12.4 15.7 25.0 46.9 76.0 11.2 6.4 6.4
Class 2 3277 57.6 42.4 29.6 32.2 27.8 10.4 72.7 11.6 10.3 5.4
Class 3 1500 44.4 55.6 34.3 38.2 21.6 5.9 72.9 10.3 13.1 3.7
Class 4 245 32.6 67.4 34.8 45.5 17.1 2.7 71.2 7.2 11.6 10.0
Class 5 470 26.1 73.9 39.5 41.1 16.9 2.5 63.2 8.6 25.5 2.8
Class 6 - Most active
109 17.4 82.6 48.6 37.3 13.3 0.8 44.1 7.1 46.2 2.7
Percent of MVPA bouts (Matthews) out of total wearing time per day
Class 1 - Least active
1233 66.2 33.8 12.2 15.4 22.3 50.1 77.7 11.0 6.8 4.5
Class 2 1410 66.1 33.9 23.6 26.2 29.1 21.1 71.2 12.7 8.2 7.8
Class 3 2827 54.5 45.5 29.5 32.1 25.4 13.0 73.0 10.9 10.6 5.6
Class 4 1997 41.5 58.5 31.5 36.5 23.1 8.9 73.8 9.8 12.6 3.8
Class 5 - Most active
464 23.5 76.5 41.0 38.9 16.7 3.4 55.6 9.1 30.6 4.8
Percent of sedentary behavior out of total wearing time per day
Class 1 - Most sedentary
662 49.7 50.3 11.4 11.1 20.2 57.4 79.8 10.7 4.0 5.5
Class 2 2090 51.2 48.8 23.8 25.0 25.4 25.7 75.5 11.4 7.2 6.0
the data, with a high proportion of adults not engaging in any MVPA bouts. To handle zero inflation and over dispersion, a LCA with zero-inflated negative binomial model was used. Future studies applying LCA to accelero-metry should carefully assess the skewness of the data and when normality is violated, consider other types of model-ing approaches.
Based on self-reported national data from 1999-2004, approximately 1% to 3% of adults belonged to the week-end warrior group [3]. This distinct pattern was subse-quently confirmed using accelerometry from 2003-2004 NHANES data [4]. Using four years of NHANES data representing the US population, we also confirmed the weekend warrior pattern, identified among 3.2% of the sample (MVPA using the Troiano definition). Interest-ingly, the pattern of lower weekday and higher weekend for the total volume of physical activity was also identi-fied for 9.1% of adults when viewing total counts/minute (class 5 and 6). Previously, Lee et al [2] found that men classified as weekend warriors from self-reported data had a lower risk of all-cause mortality when compared to sed-entary men, particularly among those without major risk factors. Metzger et al. [5] found among adults that mem-bership to the weekend warrior class was associated with a lower odds of the metabolic syndrome when compared to the least active class. The classes we derived can be used to explore these associations using NHANES data.
Although Hispanics have often self-reported low levels of MVPA relative to Non-Hispanic Whites when asked about leisure-time physical activity [13] or walking [14], our analyses indicated that Hispanics comprised a rela-tively larger proportion of the more active classes. Thus, Hispanics may accumulate more of their MVPA in activ-ities other than during leisure, such as through active transportation and work activities.
Sedentary behavior, such as sitting, constitutes time spent in periods of little or no movement while awake, and at an energy expenditure ranging from 1.0-1.5 meta-bolic equivalents [15]. To our knowledge, this is the first paper to explore sedentary patterns among adults using LCA techniques. Of concern, the two most sedentary clas-ses represented 31.4% of the population, with a weighted mean of 9.3 (class 2) to 12.4 (class 1) hours/day of seden-tary behavior over the week. The least sedenseden-tary class that emerged had a relatively low percent of time spent in sed-entary behavior on the weekdays but higher on the week-ends (class 5). Even so, their percent of sedentary behavior was still lower on Saturdays and Sundays than the other four classes. When exploring bout minutes of sedentary behavior, several classes generally showed stable amounts throughout the week, though at different absolute cents. However, patterns also emerged with a lower per-cent of sedentary bouts out of total wearing time per day on the weekdays and more on the weekends (weekend couch potato), as well as higher percent of sedentary bouts out of total wearing time per day on the weekdays and fewer on the weekends (indicative of a weekend warrior pattern for sedentary behavior).
In our analyses, we also explored other formulations of sedentary behavior and sedentary bouts, including minutes/day and minutes/day controlling for seden-tary wearing time. We found that wearing time greatly affected the classification of sedentary behavior and that representing the time as a percent of wearing time was the best representation of this variable to both ac-count for wearing time and to maintain consistency throughout our analysis. Future use of this variable as an independent variable should also consider includ-ing accelerometer wear time as a potential confounder when appropriate.
Table 2 Sociodemographic characteristics by accelerometry derived classes among adults (n = 7931); NHANES 2003-2006
(Continued)
Class 4 1749 53.0 47.0 32.9 37.3 22.5 7.3 70.0 9.4 16.5 4.1
Class 5 - Least sedentary
582 33.2 66.8 38.5 41.1 18.0 2.3 57.1 10.6 28.7 3.6
Percent of sedentary bouts out of total wearing time per day
Class 1 - Most sedentary
587 48.5 51.5 9.6 8.4 18.3 63.8 81.0 9.9 3.0 6.1
Class 2 1469 47.7 52.3 20.9 24.2 25.3 29.5 76.8 10.9 6.1 6.2
Class 3 656 57.7 42.3 30.8 33.6 25.4 10.2 73.9 11.3 9.1 5.6
Class 4 1449 54.4 45.6 25.8 25.9 26.9 21.4 73.4 12.3 9.2 5.1
Class 5 1951 54.6 45.4 29.0 33.5 26.8 10.7 73.0 10.6 11.1 5.3
Class 6 288 48.0 52.0 28.4 38.3 27.1 6.2 69.4 10.4 13.8 6.4
Class 7 - Least sedentary
1531 52.9 47.1 35.8 39.6 19.8 4.8 65.2 9.9 20.8 4.1
Limitations
These analyses are subject to several limitations. First, the uniaxial accelerometer used by NHANES under counts some activities, such as bicycling and weight lift-ing, and misses other activities, such as swimmlift-ing, be-cause the monitor was not waterproof and participants were told to remove it for any water-based activity. Sec-ond, the LCA models with sampling weights applied to these data assume data are missing at random. This as-sumption may not always be true, particularly when the accelerometer is removed for water activities. However, national data indicate that the proportion of adults who report swimming regularly is relatively low [16].
Third, the bootstrap likelihood ratio test we applied was based on unweighted data, such that it does not ac-count for the sampling design in the test. However, we also used other criteria to make the final determination for the number of classes to use, including class sample size, substantive knowledge, and visual inspection. Fourth, it is possible that our latent class assignments still missed underlying patterns [4]. For example, there may be some workers whose weekend does not fall on Saturday or Sunday. The ordering of days could be explored differently, such as from least to most physical active, rather than from Monday to Sunday. Fifth, a strength is that our analyses re-sulted in latent class assignments that are available and can be used by others to address research questions (Additional file 3). The limitation is that this approach of deriving as-signments separately from the modeling has lower statis-tical efficiency. However, we felt this trade-off was justified because assignments will remain stable to enhance compar-ability across future analyses.
Conclusion
Using accelerometry data, this study identified patterns of overall physical activity, MVPA, and sedentary behav-ior from a national sample of adults. These findings can assist with intervention development to better under-stand how accelerometry-assessed physical activity and sedentary behavior are frequently patterned overall and by sociodemographic characteristics. Future NHANES analyses with these data can assess correlates of these patterns and associations with health outcomes. More-over, exploration into whether the latent classes contrib-ute over and above the absolcontrib-ute number of mincontrib-utes for the same variable (counts/minute, MVPA, sedentary be-havior) would help determine the further contribution of the patterning of the behavior.
There are also other possible uses of the LCA methods that could be applied to these data. For example, the methods can be used to develop clusters of health be-haviors, including lack of physical activity as others have done using self-reported data [17]. These methods have also been applied to explore longitudinal patterns of
self-reported leisure-time physical activity [18,19], walking [19], and bicycling [19] using an extension of LCA called latent class growth analysis. Another unique application combined self-report and accelerometry data to derive latent classes among a sample of youth [20]. These ex-amples, along with our findings, offer exciting possibilities into studying physical activity patterns using detailed physical activity data.
Additional files
Additional file 1:Weighted mean percents by day of week for latent classes derived from accelerometry among adults (n=7931); NHANES 2003-2006.
Additional file 2:Wear time by the latent classes derived from accelerometry among adults (n=7931); NHANES 2003-2006. Additional file 3:Data dictionary for latent classes variables based on accelerometry measures among adults (NHANES 2003-2006).
Abbreviations
LCA:Latent class analysis; MVPA: Moderate to vigorous physical activity; NHANES: National Health and Nutrition Examination Survey.
Competing interests
The authors declare that they have no competing interests.
Authors’contributions
KRE developed the aims of the study and drafted the paper, while all the remaining authors provided critical feedback on several earlier drafts of the paper. AHH, JM, and FW provided input on the statistical analysis of the study. FW wrote all analytic programs with help from JM and AHH. All authors read and approved the final manuscript.
Acknowledgment
This work was supported by the National Institutes of Health (NIH), National Heart, Lung, and Blood Institute #R21 HL115385. The content is solely the responsibility of the authors and does not necessarily represent the official views of the NIH.
Author details
1Department of Epidemiology, Gillings School of Global Public Health,
University of North Carolina Chapel Hill, 137 East Franklin Street, Suite 306, Chapel Hill, NC, USA.2Center for Behavioral Health Research and Services, University of Alaska–Anchorage, Anchorage, AK, USA.3Department of Biostatistics, Gillings School of Global Public Health, Carolina Population Center, University of North Carolina–Chapel Hill, Chapel Hill, NC, USA.
Received: 5 September 2014 Accepted: 3 February 2015
References
1. U.S. Department of Health and Human Services: 2008 Physical Activity Guidelines for Americans. ODPHP Publication No. U0036. Washington, D.C.; 2008: 1-61. Accessed September 4, 2014 at http://www.health.gov/ paguidelines/.
2. Lee I-M, Sesso H, Oguma Y, Paffenbarger Jr R. The“weekend warrior”and risk of mortality. Am J Epidemiol. 2004;160(7):636–41.
3. Kruger J, Ham SA, Kohl HW. Characteristics of a“weekend warrior”: results from two national surveys. Med Sci Sports Exerc. 2007;39(5):796–800. 4. Metzger JS, Catellier DJ, Evenson KR, Treuth MS, Rosamond WD, Siega-Riz
AM. Patterns of objectively measured physical activity in the United States. Med Sci Sports Exerc. 2008;40(4):630–8.
6. John D, Freedson P. ActiGraph and Actical physical activity monitors: a peek under the hood. Med Sci Sports Exerc. 2012;44(1 Suppl 1):S86–9.
7. Choi L, Liu Z, Matthews CE, Buchowski MS. Validation of accelerometer wear and nonwear time classification algorithm. Med Sci Sports Exerc. 2011;43(2):357–64.
8. Troiano R, Berrigan D, Dodd K, Masse L, Tilert T, McDowell M. Physical activity in the United States measured by accelerometer. Med Sci Sports Exerc. 2008;40(1):181–8.
9. Matthews C. Calibration of accelerometer output for adults. Med Sci Sports Exerc. 2005;37(11 Suppl):S512–22.
10. Matthews C, Chen K, Freedson P, Buchowski M, Beech B, Pate R, et al. Amount of time spent in sedentary behaviors in the United States, 2003-2004. Am J Epidemiol. 2008;167(7):875–81.
11. Carson V, Janssen I. Volume, patterns, and types of sedentary behavior and cardio-metabolic health in children and adolescents: a cross-sectional study. BMC Public Health. 2011;11:274.
12. Muthén LK, Muthén BO. Mplus user’s guide. 5thEdition (1998-2007). Los Angeles,
CA: Muthén and Muthén; 2007.
13. Centers for Disease Control and Prevention. Adult participation in aerobic and muscle-strengthening physical activities - United States, 2011. Morb Mort Week Rep. 2013;62(17):326–30.
14. Centers for Disease Control and Prevention. Vital signs: walking among adults - United States, 2005 and 2010. Morb Mort Week Rep. 2012;61 (31):595–601.
15. Owen N, Healy G, Matthews C, Dunstan D. Too much sitting: the population health science of sedentary behavior. Exerc Sport Sci Rev. 2010;38(3):105–13. 16. Evenson K, Huston S, Wood J, Bors P. Does the number of leisure activities
recalled change the estimated prevalence of activity? Med Sci Sports Exerc. 2003;35(11):1882–6.
17. Leventhal AM, Huh J, Dunton GF. Clustering of modifiable biobehavioral risk factors for chronic disease in US adults: a latent class analysis. Perspect Public Health. 2014;134(6):331–8.
18. Barnett TA, Gauvin L, Craig CL, Katzmarzyk PT. Distinct trajectories of leisure time physical activity and predictors of trajectory class membership: a 22 year cohort study. Intl J Behavioral Nutrition Phys Act. 2008;5:57. 19. Silverwood RJ, Nitsch D, Pierce M, Kuh D, Mishra GD. Characterizing
longitudinal patterns of physical activity in mid-adulthood using latent class analysis: results from a prospective cohort study. Am J Epidemiol. 2011;174(12):1406–15.
20. Patnode CD, Lytle LA, Erickson DJ, Sirard JR, Barr-Anderson DJ, Story M. Physical activity and sedentary activity patterns among children and adolescents: a latent class analysis approach. J Phys Act Health. 2011;8(4):457–67.
Submit your next manuscript to BioMed Central and take full advantage of:
• Convenient online submission
• Thorough peer review
• No space constraints or color figure charges
• Immediate publication on acceptance
• Inclusion in PubMed, CAS, Scopus and Google Scholar
• Research which is freely available for redistribution