Development and evaluation of ranitidine hydrochloride floating matrix tablet
11
0
0
Full text
(2) Harshal P Gahiwade. et al., Int. Journal of Pharmacy & Industrial Research Vol – 02 Issue – 03 Jul – Sep 2012. 321. intestine and has 50% absolute bioavailability.2. Materials and methods. Colonic metabolism of ranitidine is partly. Materials. responsible for the poor bioavailability of. Ranitidine hydrochloride was received as a gift. 3. ranitidine from the colon. It has been reported. sample from Cipla Pharmaceuticals Ltd, Goa,. that the oral action of gastric disorders with an. India. Hydroxypropyl methylcellulose (HPMC. H2 receptor antagonist used in grouping with. K4 M), HPMC K15 M, and Carbopol 940. antacids promotes local delivery of these drugs. were received as gift samples from Watson. to the receptor of parietal cell wall. Therefore. Healthcare. this attitude could be useful for humanizing. bicarbonate and citric acid anhydrous were. systemic. delivery of. purchased from Merck Chemicals, Mumbai,. Ranitidine, which would efficiently reduced. India. All other ingredients were of laboratory. as. well. as. gastric acid secretion.. 4. local. The gastro retentive. Ltd, Mumbai,. India. Sodium. grade.. drug delivery systems can be retained in the. Methods. stomach and assist in improving the oral. Preparation of Sustained Release Tablet of. sustained delivery of drugs that have an. Ranitidine Hydrochloride. absorption window in a particular region of the. All the ingredients were passed through 60. gastrointestinal tract. These systems help in. mesh sieve separately. Weighed quantity of. continuously releasing the drug before it. ranitidine hydrochloride and all the excipients. reaches the absorption window, thus ensuring. was showed in Table No.1 except lubricants. optimal bioavailability. Several approaches are. were mixed. Finally magnesium stearate and. currently used to prolong gastric retention. talc were added and mixed. Tablets were. time. These include floating drug delivery. compressed on a Multi station rotary punch. systems also known as hydrodynamically. tablet. balanced systems, swelling and expanding. Ahmedabad, India.) using round flat surface. systems,. punches of 12 mm diameter.8 The hardness of. polymeric. bioadhesive. systems,. compression. machine. (A-Jaguar,. modified-shape systems, high-density systems,. the tablet was maintained around 5.5 kg/cm2.. and other delayed gastric emptying devices.5,6. Preparation of Powder Blend of Ranitidine. The principle of buoyant preparation offers a. Hydrochloride. simple and practical approach to achieve. During preliminary studies, total 18 batches. increased gastric residence time for the dosage. were prepared by using different concentration. form and sustained drug release.. 7. of polymers. This was done to aid in choosing. In the current research on floating tablets of. the limits for the ingredients for further. ranitidine HCL were prepared by effervescent. evaluation.. approach using two different grades of HPMC. containing different concentration of polymers. these were as follow :- HPMC K4 and HPMC. alone or in combination keeping the total tablet. K15M and Carbopol 940 as release rate. weight constant. From above preliminary. retardant. The aim of the work was to evaluate. batches, depending upon floating time and. the effect of gel-forming polymer HPMC and. dissolution rate following eight formulations. Carbopol 940 on floating property and release. were prepared for further evaluation.. individuality of ranitidine tablets.. www.ijpir.com. Pre-optimization. investigation.
(3) 322. Harshal P Gahiwade. et al., Int. Journal of Pharmacy & Industrial Research Vol – 02 Issue – 03 Jul – Sep 2012. Table No. 01: Preparation of Powder Blends of Ranitidine Hydrochloride Floating Tablets FC. Drug (mg). A1 A2 A3 A4 A5 A6 A7 A8. 336 336 336 336 336 336 336 336. HPMC K4M (%) 15 20 20 10 15 20 20 15. HPMC K15M (%) 10 10 15 15 15 15 10 10. Carbopol 940P (%) 15 15 15 15 15. Sodium bicarbonate(%). Citric acid (%). 18 18 18 18 18 18 18 18. 5 5 5 5 5 5 5 5. (Each tablet formulation contains 18 % w/w sodium bicarbonate, 5% w/w citric acid, 1% w/w of magnesium stearate and 2%w/w talc, Lactose was added to each formulation upto 650 mg.) Drug Interaction Study. the time when there was no more decrease in. Fourier Transform Infrared (FTIR). the volume.11,12 Bulk density (ρb) and tapped. Spectroscopy. density (ρt) were calculated.13 Carr index (CI). Fourier transform infrared (FT-IR) spectrum. were calculated according to the equation. of. which are follows:- CI= ρt- ρb/ ρt. drug. was. obtained. using. FT-IR. Spectrophotometer and the spectrum was recorded in the wavelength region of 4000 to −1. Evaluation of Floating Tablet. 400 cm . The sample was mixed with. Characteristics. potassium bromide (KBr) in a mortar with the. The thickness of the tablets was determined. help of pastle. The potassium bromide was. using a micrometer screw gauge. Three tablets. 0. previously heated to 110 c for 1 hrs so it. from each type of formulation were used and. become anhydrous. to avoid the peaks of. average values were calculated.14 The weight. water of hydration. The sample was placed in. variation test was carried out for 20 tablets. the light path of sample cell and the spectrum. randomly as per Indian Pharmacopoeia.14,15. was obtained. 9. Tablet hardness was calculated by hardness tester and recorded in kg/cm2. Friability of. Evaluation of Powder Mixture. tablet was calculated by using Roach friability. Physical mixture of different formulations was. tester. Percentage loss should not more than. evaluated for pre compressional parameters.. 0.5 to 1.0 % and the % friability was. Angle of repose (θ) of the powder mixture was. calculated using the formula.16. determined by. The tan¯1 of (height of the pile / radius of its base) give the angle of repose.10 Powder mixture were poured gently through a glass funnel into a graduated cylinder cut exactly to 10 ml mark. Excess powder mixture was removed using a spatula and the weight of the cylinder with pellets required for filling the cylinder volume was calculated. The cylinder was then tapped from a height of 2.0cm until. W0 - W % Friability = ------------ × 100 W0 Where, W0 -Weight of tablet before test, W - Weight of tablet after test. The uniformity of content was determined as per official procedure. The tablet triturate equivalent to 100 mg of the drug was weighed. www.ijpir.com.
(4) Harshal P Gahiwade. et al., Int. Journal of Pharmacy & Industrial Research Vol – 02 Issue – 03 Jul – Sep 2012. 323. accurately, dissolved in pH 1.2 buffer and. gastric fluid pH 1.2. Absorbance was recorded. diluted to 100 ml with the same. Further. at 322 nm against the blank .The same. dilutions. procedure was repeated for nine tablets8. The. were. done. suitably to. get a. concentration of 10mcg/ml with simulated. formula used shown below,. Absorbance of standard Uniformity of Content = -----------------------------× 100 Absorbance of sample from the vessel wall. The sample withdrawn. Swelling Characteristics To. evaluate. the. water. penetration. was diluted to suitable volume with simulated. characteristics, the pre-weighted tablets were. gastric fluid and the absorbance was recorded. immersed in 500 ml beaker containing. at 322 nm using UV-VIS spectrophotometer.. simulated gastric fluid (SGF) and maintained. Cumulative percentage drug release was. 0. for 12 hrs at 37 ± 0.5 C. Swollen tablets were. calculated by using an equation obtained from. removed from the solution, immediately wiped. a standard curve. 18,19. with a paper towel to remove surface droplets, and weighed. was. 17. calculated. The % swelling index (Sw) according. the. following. equation,. Result and discussion Physical Parameters of Powder blend of Preliminary Batches of Floating Tablets The powder mixtures for all (F1-F18) batches. Wt - W0 % Swelling index (Sw) = --------------× 100. were evaluated for bulk density which ranged from 0.450 to 0.526 (g/ml), tapped density. W0 Where,. ranged from 0.589 to 0.648 (g/ml), Carr’s. W0 - Initial weight of tablet,. index ranged from 20.71% to 26.95% and. Wt - Weight of the swollen tablet at time t.. angle of repose ranged from 25.45 to 31.13°.All these results indicated that, the. In-vitro Dissolution Study. powder mixture possess satisfactory flow and. The In-vitro dissolution study was carried out. compressibility properties. Diameter of all. in USP Dissolution Test Apparatus, Type 2. tablets was found to be 11.950.02 mm. The. (paddle type). Simulated gastric fluid 900 ml. hardness of tablets was found to be 5.1 to 5.6. of pH 1.2 was used as dissolution medium.. kg/cm2. The formulations containing Carbopol. The temperature of dissolution media was. 940 and HPMC had shown maximum hardness. maintained at 37±0.5°C. The paddle rotation. so they shows less % friability and it was. speed was kept at 50 rpm. Aliquot 10 ml. of. found that hardness was increased with. was withdrawn at every 1-hour interval for 12. increase proportion of polymers. Thicknesses. hours and the same volume was replaced with. of tablets were found to be in the range of 4.06. pre warmed fresh dissolution media. Aliquots. - 4.16 mm. Formulations containing Carbopol. were withdrawn from a zone midway between. 940 P were found to be thicker than other. the surface of dissolution medium and the top. formulations as the Carbopol was fluffy in. of rotating paddle not less than 1 cm apart. nature. All the tablets shows % friability in the. www.ijpir.com.
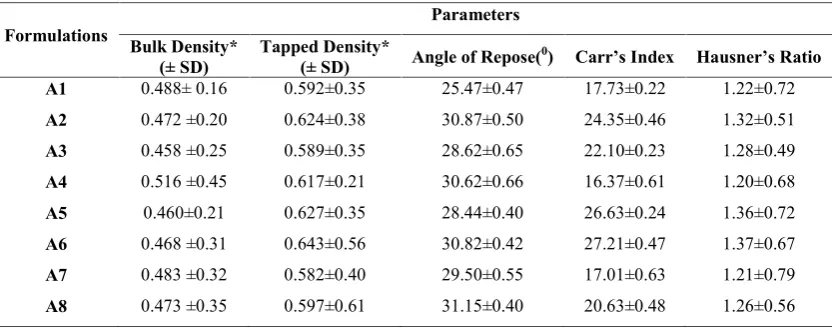
(5) 324. Harshal P Gahiwade. et al., Int. Journal of Pharmacy & Industrial Research Vol – 02 Issue – 03 Jul – Sep 2012. range of 0.39-0.64 % which was within the. variation test as all tablets within the range. limit. All the formulations pass the Weight. limit for weight variation.. Table No. 02: Evaluation of Powder Mixtures of Floating Tablets Formulations. Parameters Tapped Density* (± SD) 0.592±0.35. Angle of Repose(0). Carr’s Index. Hausner’s Ratio. A1. Bulk Density* (± SD) 0.488± 0.16. 25.47±0.47. 17.73±0.22. 1.22±0.72. A2. 0.472 ±0.20. 0.624±0.38. 30.87±0.50. 24.35±0.46. 1.32±0.51. A3. 0.458 ±0.25. 0.589±0.35. 28.62±0.65. 22.10±0.23. 1.28±0.49. A4. 0.516 ±0.45. 0.617±0.21. 30.62±0.66. 16.37±0.61. 1.20±0.68. A5. 0.460±0.21. 0.627±0.35. 28.44±0.40. 26.63±0.24. 1.36±0.72. A6. 0.468 ±0.31. 0.643±0.56. 30.82±0.42. 27.21±0.47. 1.37±0.67. A7. 0.483 ±0.32. 0.582±0.40. 29.50±0.55. 17.01±0.63. 1.21±0.79. A8. 0.473 ±0.35. 0.597±0.61. 31.15±0.40. 20.63±0.48. 1.26±0.56. Table No. 03: Physical Parameters of Ranitidine Hydrochloride Floating Tablets Parameters. Formulations. Hardness (kg/cm2)* (± SD). A1 A2 A3 A4 A5 A6 A7 A8. 5.2± 0.28 5.1± 0.26 5.3± 0.26 5.4± 0.35 5.6± 0.31 5.5± 0.50 5.4± 0.24 5.3± 0.57. Thickness (mm)*(± SD) 4.16±0.43 4.11±0.24 4.15±0.27 4.09±0.54 4.12±0.29 4.14±0.31 4.09±0.11 4.11±0.53. % Friability. % Wt Variation(mg). 0.31±0.24 0.46±0.59 0.61±0.65 0.46±0.53 0.61±0.58 0.76±0.51 0.62±0.25 0.46±0.22. 650.1±0.50 641.3±0.25 652.5±0.55 646.6±0.34 644.2±0.28 652.1±0.34 643.8±0.45 645.6±0.29. * n=3: Diameter of all tablets were found to be 11.950.02 mm The floating tablets of Ranitidine HCL were. each batch showed uniformity of content in the. prepared through direct compression technique. range 96.36 ± 0.69 -99.70 ± 0.52 % to 99.70 %. by means of HPMC (K4, K15M), sodium. which. bicarbonate, citric acid and Carbopol 940P.. specifications.. was. under. pharmacopoeial. The magnesium stearate was used as lubricant and talc was used as glidant. The results of the. Swelling Behavior. physicochemical characterization are given in. Hydrophilic matrices when immersed in water. Table No. 3. The Hardness of tablets was. get swells and eventually dissolved. When. 2. found in the range of 5.1 to 5.6 kg/cm . The. they are placed in water, swelling starts and. thickness of tablets was between 4.06 -4.16. the tablet thickness increases. Initially, water. mm. All the tablets showed loss of less than 1. diffuses through the polymeric matrix. As the. % in weight which was considered acceptable.. polymer chains become more hydrated and the. The percentage deviation from average tablet. gel becomes more diluted, the disentanglement. weight 650mg for all the tablet was found to. concentration may be reached that was the. be within the specified limits. Tablets from. critical polymer concentration below which the. www.ijpir.com.
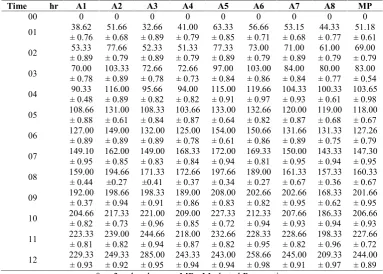
(6) Harshal P Gahiwade. et al., Int. Journal of Pharmacy & Industrial Research Vol – 02 Issue – 03 Jul – Sep 2012. 325. polymer chains disentangle and detach from. volume decreases slowly because of polymer. the gellified matrix. Thus there was a slow. dissolution. Polymeric matrices experience. diminution of the matrix thickness due to. simultaneously swelling, polymer dissolution. polymer dissolution. The polymer in the. and diffusion. As expected, Floating tablet. matrix. swelling,. with increasing polymer proportions showed. dissolution and diffusion into the bulk medium. increased hydration volumes. In floating tablet. undergoes. simultaneous. resulting in erosion of the polymer.. 20,21. 336 mg Ranitidine Hydrochloride and a. The matrices % swelling increases at the. variable quantity of a mixture composed of. beginning attains a maximum and then. polymers with 18% sodium bicarbonate. As. declines as showed in Figure No. 1. The. the matrix polymer proportion increases, the. matrices behavior can be ascribed to a natural. hydration volume increases as well as the time. hydration process. Hydrophilic matrices in. necessary to attain its maximum, while in. contact with water swell and increase their. another case, Floating tablet with high. volume and weight due to water diffusion. proportion of Carbopol 940P than HPMC. through the matrix. The polymer chains. K4M & HPMC K15M required more time.. continue the hydration process and the matrix. The swelling index of marketed preparation. gain more dissolution medium. The increasing. was compared with formulated batches, it was. water content dilutes the matrix until a. found. disentanglement concentration was attained.. formulation had values nearer to optimized. At this point, the polymer molecules are. batch A7. The swelling behavior was showed. released from the matrix and diffused to the. in Table No.4 & Figure No.1.. that swelling index of. marketed. bulk of the dissolution medium. The matrix Table No. 04: Swelling Behavior for Prepared Batches and Marketed Preparation Time. 00 01 02 03 04 05 06 07 08 09 10 11 12. hr. A1 0 38.62 ± 0.76 53.33 ± 0.89 70.00 ± 0.78 90.33 ± 0.48 108.66 ± 0.88 127.00 ± 0.89 149.10 ± 0.95 159.00 ± 0.44 192.00 ± 0.37 204.66 ± 0.82 223.33 ± 0.81 229.33 ± 0.93. A2 0 51.66 ± 0.68 77.66 ± 0.79 103.33 ± 0.89 116.00 ± 0.89 131.00 ± 0.61 149.00 ± 0.89 162.00 ± 0.85 194.66 ±0.27 198.66 ± 0.94 217.33 ± 0.73 239.00 ± 0.82 249.33 ± 0.92. * n=3. A3 0 32.66 ± 0.89 52.33 ± 0.89 72.66 ± 0.78 95.66 ± 0.82 108.33 ± 0.84 132.00 ± 0.89 149.00 ± 0.83 171.33 ±0.41 198.33 ± 0.91 221.00 ± 0.96 244.66 ± 0.94 285.00 ± 0.95. A4 0 41.00 ± 0.79 51.33 ± 0.79 72.66 ± 0.73 94.00 ± 0.82 103.66 ± 0.87 125.00 ± 0.78 168.33 ± 0.84 172.66 ± 0.37 189.00 ± 0.86 209.00 ± 0.85 218.00 ± 0.87 243.33 ± 0.94. A5 0 63.33 ± 0.85 77.33 ± 0.89 97.00 ± 0.84 115.00 ± 0.91 133.00 ± 0.64 154.00 ± 0.61 172.00 ± 0.94 197.66 ± 0.34 208.00 ± 0.83 227.33 ± 0.72 232.66 ± 0.82 243.00 ± 0.94. A6 0 56.66 ± 0.71 73.00 ± 0.79 103.00 ± 0.86 119.66 ± 0.97 132.66 ± 0.82 150.66 ± 0.86 169.33 ± 0.81 189.00 ± 0.27 202.66 ± 0.82 212.33 ± 0.94 228.33 ± 0.95 258.66 ± 0.98. A7 0 53.15 ± 0.68 71.00 ± 0.89 84.00 ± 0.84 104.33 ± 0.93 120.00 ± 0.87 131.66 ± 0.89 150.00 ± 0.95 161.33 ± 0.67 202.66 ± 0.95 207.66 ± 0.93 228.66 ± 0.82 245.00 ± 0.91. hr= hours, MP= Marketed Preparation www.ijpir.com. A8 0 44.33 ± 0.77 61.00 ± 0.79 80.00 ± 0.77 100.33 ± 0.61 119.00 ± 0.68 131.33 ± 0.75 143.33 ± 0.94 157.33 ± 0.36 168.33 ± 0.62 186.33 ± 0.94 198.33 ± 0.96 209.33 ± 0.97. MP 0 51.18 ± 0.61 69.00 ± 0.79 83.00 ± 0.54 103.65 ± 0.98 118.00 ± 0.67 127.26 ± 0.79 147.30 ± 0.95 160.33 ± 0.67 201.66 ± 0.95 206.66 ± 0.93 227.66 ± 0.72 244.00 ± 0.89.
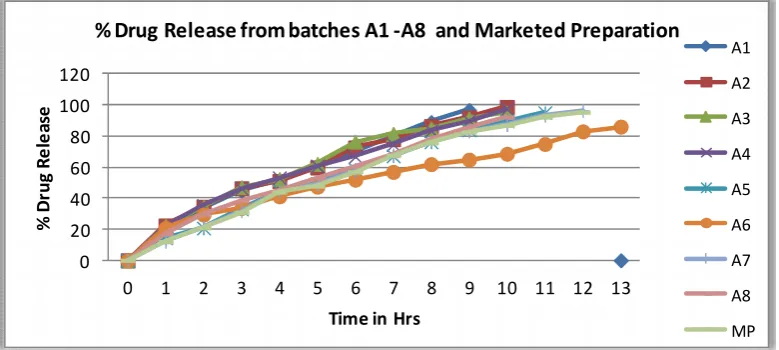
(7) 326. Harshal P Gahiwade. et al., Int. Journal of Pharmacy & Industrial Research Vol – 02 Issue – 03 Jul – Sep 2012. %Swlling index. 300 250. % Swelling index of batches A1 -A8 and marketed preparation A1 A2 A3 A4 A5 A6 A7 A8 MP. 200 150 100 50 0 0. 1. 2. 3. 4. 5. 6. 7. 8. 9. 10. 11. 12. Time in Hrs. Figure No. 01: % Swelling Index of Formulations A1 to A8 and Marketed Preparation. In- Vitro Drug Release The studies of the formulation Batches from. used. The results obtained were converted in. A1-A8 and marketed prparation were carried. the form of % drug release. The release. out to know the in-vitro drug release pattern.. behavior. The drug release at specified time intervals. preparation. Percent drug release studies were. was determined and calculated to know the. carried out for A1 to A8 batches and were. release at variable concentration of polymers. showed in Table No.5 & Figure No.2.. was. compared. with. marketed. Table No. 05: In-Vitro Dissolution Rate Study of Formulation A1 to A8 and Marketed Preparation Sr. No. Time (hrs). 01. 0. 02. 01. 03. 02. 04. 03. 05. 04. 06. 05. 07. 06. 08. 07. 09. 08. 10. 09. 11. 10. -. 12. 11. -. -. 13. 12. -. -. 14. 13. -. -. A1 0 20.89 ±0.23 33.13 ±0.35 44.70 ±0.62 51.68 ±0.71 60.73 ±0.48 70.47 ±0.88 80.03 ±0.59 89.10 ±0.59 96.79 ±0.23. A2 0 22.49 ±0.41 34.54 ±0.55 46.39 ±0.70 51.06 ±0.73 59.82 ±0.67 72.61 ±0.51 77.97 ±0.58 86.44 ±0.71 91.98 ±0.94 98.73 ±0.58. *n=3. % Drug Release ± SD A4 A5 A6 0 0 0 21.54 14.47 20.89 ±0.23 ±0.44 0.52 35.22 20.82 29.46 ±0.47 ±0.56 ±0.84 46.30 33.05 33.76 ±0.59 ±0.84 ±0.35 53.13 44.54 41.21 ±0.94 ±0.70 ±0.82 60.73 49.55 47.40 ±0.59 ±0.49 ±0.59 66.81 58.44 51.93 ±0.89 ±0.29 0.94 74.54 67.26 56.93 ±0.84 ±0.59 ±0.65 83.45 76.30 61.95 ±0.67 ±0.94 ±0.35 89.96 84.01 64.86 ±0.77 ±0.82 ±0.97 97.48 89.77 68.62 ±0.82 ±0.39 ±0.55 95.08 74.90 ±0.71 ±0.45 83.05 ±0.94 86.10 ±0.65 MP= Marketed Preparation A3 0 22.34 ±0.58 34.65 ±0.48 47.10 ±0.46 52.33 ±0.71 62.09 ±0.70 76.38 ±0.94 81.39 ±0.48 85.04 ±0.48 91.46 ±0.48 95.09 ±0.67. www.ijpir.com. A7 0 12.15 ±0.27 21.45 ±0.65 31.80 ±0.71 44.31 ±0.40 48.94 ±0.94 57.61 ±0.59 68.01 ±0.34 76.30 ±0.88 83.20 ±0.47 87.24 ±0.59 93.22 ±0.94 96.42 ±0.55. A8 0 16.96 ±0.17 29.52 ±0.25 38.45 ±0.48 45.13 ±0.35 52.74 ±0.59 60.42 ±0.75 68.16 ±0.88 77.88 ±0.35 85.34 ±0.97 92.15 ±0.75. -. -. -. MP 0 11.96 ±0.25 20.89 ±0.58 30.90 ±032 43.97 ±0.38 47.79 ±0.92 56.94 ±0.56 67.44 ±0.31 75.56 ±0.84 82.48 ±0.44 86.88 ±0.52 92.23 ±0.89 95.32 ±0.50.
(8) Harshal P Gahiwade. et al., Int. Journal of Pharmacy & Industrial Research Vol – 02 Issue – 03 Jul – Sep 2012. % Drug Release from batches A1 -A8 and Marketed Preparation. % Drug Release. 120. 327. A1 A2. 100. A3. 80. A4. 60. A5. 40 20. A6. 0. A7. 0. 1. 2. 3. 4. 5. 6. 7. 8. 9. 10 11 12 13. Time in Hrs. A8 MP. Figure No. 02: Comparison of % Release of Ranitidine Hydrochloride from Formulation A1and A8 and Marketed Preparation From the data (Table No.5) it was found that. drug release in 12 Hrs while formulation A6. A1 (15% HPMC K4M & 10% HPMC K15M),. had more retardation of release (86.10 % in 13. A2(20%. HPMC. Hrs). Retardation of concentration of HPMC. K15M),A3 ( 20% HPMC K4M &15% HPMC. K15 in formulation A5 caused drug release. K15M), were unable to sustain drug release for. completed in 11 Hrs. The drug release from. desired time period therefore’s not selected for. the marketed preparation was found to be. further study. The following Figure No.2. 95.32 % in 12 hrs and it was nearer to. showed the release of Ranitidine hydrochloride. optimized batch A7.. HPMC. K4M. &. 10%. from tablets. The tablets (A1) gave complete drug release in 9 hrs and the tablet (A2, A3) gave complete drug release in 10 hrs. Formulation containing Carbopol (A4-A8 ) showed extended drug release as compared to those without Carbopol 940 P (A1- A3 ). As concentration of polymers increases, the drug release found to. be decreased. Formulation. containing Carbopol 940P showed drug release in. between. 10-13. Hrs. depending. on. concentration of polymer. Formulation A4 and A5 showed drug release in 10 and 11 Hrs respectively. due to low polymer content. Formulation A7 showed maximum 96.42%. From the dissolution data, we can conclude that Carbopol has significant effect on release profile of drug. Formulation without Carbopol showed drug release in 9-11 Hrs. Drug Interaction Studies FT-IR Spectroscopy IR spectrum of Ranitidine Hydrochloride was compared with standard spectrum in Indian Pharmacopoeia. The FT-IR spectrum of drug shows the peaks which match to the functional groups which was indicated in official FTIR spectra so it confirmed the drug was Ranitidine Hydrochloride as showed in Fig. No.3 - 4.. www.ijpir.com.
(9) 328. Harshal P Gahiwade. et al., Int. Journal of Pharmacy & Industrial Research Vol – 02 Issue – 03 Jul – Sep 2012. Figure No. 03:- IR Spectrum of Ranitidine Hydrochloride. Figure No.4:- IR Spectrum of Optimized Formulation A7. The FT-IR spectrum did not show presence of. Acknowledgment. any additional peaks for new functional groups. The. indicating no chemical interaction between. Pharmaceuticals Ltd. Goa, India and Watson. Ranitidine. Healthcare Ltd. Mumbai, India for providing. Hydrochloride. &. the. used. polymers.. authors. are. grateful. to. Cipla. gift samples. The authors are thankful to TVES’S college of Pharmacy, Faizpur. for. Conclusion. providing necessary facility to carry out this. In conclusion, in the present research, the. research.. floating tablet of ranitidine hydrochloride were successfully prepared by using HPMC K4M,. References. HPMC K15M and Carbopol 940 to increase. 1.. the. hence. T., 2010. Formulation and evaluation of. bioavaibility of ranitidine hydrochloride. The. floating tablets of ranitidine hydrochloride. gas-generating agent sodium bicarbonate along. using natural and synthetic polymers. Int.. with citric acid was essential to achieve in-. J. pharm Tech Res., 2,2: 1513-1519.. vitro. gastric. residence. time. and. Yadav, S. K., Kavita, K., Tamizhamani,. buoyancy. The drug release from the. 2.. tablets was sufficiently controlled.. Lauritsen, K., 1990. Clinical pharmaco kinetics of drugs used in the treatment of. www.ijpir.com.
(10) Harshal P Gahiwade. et al., Int. Journal of Pharmacy & Industrial Research Vol – 02 Issue – 03 Jul – Sep 2012. gastrointestinal. diseases.. Clin. Form Design, second edition. Churchill L. Pharmacokinet. 19:11-31, 94-125. 3.. 4.. 5.. vingstone, London. pp. 136-137.. Grant, S., 1989. Ranitidine: an updated. 7.. 2002d.. Pharmaceutical. pharmacokinetic. and. Pharmaceutics: The Science of Dosage. therapeutic use in peptic ulcer and other. Form Design, second edition. Churchill L. allied diseases. Drugs., 37:801-870.. vingstone, London. pp.134.. properties. Aulton ME (ed).. Coffin, M., Parr, A., April 18, 1995.. 13. Banker, G.S., Anderson, N.R., 2003.. Ranitidine solid dosage form. US Patent. Tablets. In, Lachman, L., Lieberman,. 5407687.. H.A., Kanig, J.L., (ed). The Theory and. Arora, S., Ali, J., Ahuja, A., Khar, R. K.,. Practice of Industrial Pharmacy, third. Baboota, S., 2005. Floating drug delivery. edition.. system: A review. AAPS Pharma. Sci.. Bombay. pp. 293-301.. Varghese. publishing. house,. 14. Banker, G.S., Anderson, N.R., 2009.. Zawar, L. R., Savaliya, P. J., 2010.. Tablets. In, Lachman, L., Lieberman,. Formulation and evaluation of floating. H.A., Kanig, J.L., (ed). The Theory and. mucoadhesive tablet of clarithromycin. Int. Practice of Industrial Pharmacy, third. J Pharm & Bio Sci.; 1,2 :1-10.. edition.. Reddy, B. A., Rani, S. B., Vedha hari, B.. Bombay. pp. 293-317.. Punita,. S.,2010.. The. Varghese. publishing. house,. recent. 15. Indian Pharmacopoeia., 2007b. Govt. of. developments on gastric floating drug. India. Ministry of Health and Family. delivery system: An overview. Int J Pharm. Welfare,. Sci Tech. 2,1: 524-534. Commission, Ghaziabad. pp. 180-182,. Patel, R., Singh, R.P., Panchal, K. M.,. 240. 2011. Formulation and optimization of floating. 9.. J.,. Preformulation. in,. N.,. 8.. 12. Wells,. review of its pharmacodynamic and. Tech. 6,3: 372-390. 6.. 329. matrix. tablet. of. The. Indian. Pharmacopoeial. 16. Indian Pharmacopoeia., 2007c. Govt. of. ranitidine. India. Ministry of Health and Family. hydrochloride. Int. J. Com. Pharma. 2, 36-. Welfare,. 45.. commission, Ghaziabad. pp. 1320-1321.. Chatwal,. Instrumental method of chemical analysis.. T.S., 2010. Development of swelling/. Himalaya publishing house, New Delhi.. floating. pp. 2.29-2.51.. system based on a combination of 2002b.. Preformulation. in,. S.K.,. Pharmacopoeial. 17. Ray, N.C., Hsiu, O.H., Chiao, Y.Y., Ming,. J.,. Anand,. Indian. 2004.. 10. Wells,. G.R.,. The. Pharmaceutical. gastroretentive. hydroxyethyl. cellulose. drug and. delivery sodium. Aulton ME (ed).. carboxymethyl cellulose for losartan and. Pharmaceutics: The Science of Dosage. its clinical relevance in healthy volunteers. Form Design, second edition. Churchill L. with CYP2C9 polymorphism. Eur. J.. vingstone, London. pp.124-127.. Pharm. Sci. 39, 82-89.. 11. Wells,. J.,. 2002c.. Preformulation. in,. Pharmaceutical. 18. United States Pharmacopoeia., 27 NF 22.,. Aulton ME (ed).. Pharmaceutics: The Science of Dosage. www.ijpir.com. 2004.. The. Official. Compendia. of. Standard. Asian Edition. United States.
(11) 330. Harshal P Gahiwade. et al., Int. Journal of Pharmacy & Industrial Research Vol – 02 Issue – 03 Jul – Sep 2012. Pharmacopoeial. Convention. Inc,. 21. Kavanagh, N., Corrigan, O. I., 2004.. Rockville. pp. 3319.. Swelling. 19. Ghosh, N. S., Ghosh, S., Debnath, S.,. and. erosion. properties. of. hydroxypropylmethylcellulose. 2010. Formulation of immediate dosage. (Hypromellose) matrices- influence of. form of ranitidine hydrochloride tablets. agitation. using HPMC and starch acetate film. composition. Int. J. Pharm. 279, 1-2, 141-. former. J. Chem. Pharm. Res. 2, 3, 147-. 152.. 157. 20. Katzhendler, I., Hoffman, A., Friedman, M., 1997. Modeling of drug release from erodible tablets. J. Pharm. Sci. 86, 1, 110115.. www.ijpir.com. and. dissolution. medium.
(12)
Figure


+3

Related documents
An algorithm is defined as “a set of rules that precisely defines a sequence of operations such that each rule is effective and definite and such that the
In order to obtain the lowest field inside the enclosure and the highest amount of shielding effectiveness, we are using GA optimization method to find the optimum
Kevin Yonkers-Talz, a graduate student in the School of Education at the University of San Francisco, is doing a study on the influence of the Casa de la Solidaridad (Casa) program
Culturing of acute myeloid leukemia (AML) KG1a cells in FN-coated PU/PLLA 60:40 shows increased cell adhesion and cell adhesion-mediated drug resistance to the drugs cytarabine
To understand the impact of prophages on the epidemiology of various types of MRSA, the prophages in all SCC mec isolates collected in 2010 (322 isolates) and 2014 (232 isolates)
Recognizing that these criteria were developed spe- cifically for a nursing home population, Beers convened another expert panel in 1997 to develop criteria applica- ble to the
Kazemi M, Azma K, Tavana B, Rezaiee Moghaddam F, Panahi A: Autologous blood versus corticosteroid local injection in the short-term treatment of lateral elbow tendinopathy: a
A ttracting and retaining human capital , which is represented by the stock of senior professionals in them , constitutes the cornerstone of their competitive edge ( Calvo , 2011
