INTRODUCTION
In recent years1-5 lithium ion conducting superionic solids have been of interest because of their application potentialities in high power solid state batteries6-13. Most of the superionic solids undergo phase transition from normal to superionic phase. The critical study of phase transition has been done by many workers14-22. Rice et al16 have discussed the phenomenon of phase transition in superionic solids from ordered normal phase to cationically disordered superionic phase. The nature of phase transition is, however, not similar in all kinds of superionic solids and has been the subject of theoretical and experimental investigation. Theoretical progress is very fast but experimental situation which can confirm these results has not been very satisfactory till recent times. Fortunately a lot of experimental data has started coming in23-31 and is expected that mystery of phase transition in superionic solids will be resolved soon by well founded theoretical models. Normally all physical parameters of these materials show anomaly at phase transition temperature (Tp) and any of these can be used to look at the nature of phase transition.
Material Science Research India Vol. 4(2), 435-440 (2007)
Phase transition study in some superionic systems
RAJESH KUMAR PATEL, SATYENDRA SINGH and KANCHAN GAUR
Department of Physics, K.N. Government P.G. College, Gyanpur, Bhadohi (India).
(Received: August 14, 2007; Accepted: October 24, 2007)
ABSTRACT
The study of phase transition has been done in the temperature range 500 K to the melting point of the studied materials of the systems (1-x) Li3PO4 : x Li3VO4 with x = 0.0, 0.33, 0.50, 0.67 and 1.0 and Li3PO4 : x Li3VO4 with x = 0.0, 0.33, 0.50, 0.67, 1.0, 1.5 and 2.0. The molar magnetic susceptibility xM and dielectric constant (K) measurements have been performed for the study of phase transition. At phase transition materials under go from normal to superionic phase. An anomaly appears in xM and log K vs temperature (T) plots at phase transition. This is also reflected in electrical conductivity () and Seebeck coefficient (S) studies. All the studied material remains diamagnetic throughout the measurement.
Keywords: Phase transition, magnetic susceptibility, dielectric constant.
This paper reports the study of phase transition of the materials of the systems (1-x) Li3PO4 : xLi3VO4 and Li3PO4 : xLi3VO4 where x = 0.0, 0.33, 0.50, 0.67 and 1.0 and 0.0, 0.33, 0.50, 0.67, 1.0, 1.5 and 2.0 respectively.
RESULT AND DISCUSSION
The phase transition study has been done by molar magnetic susceptibility (xM), Seebeck coefficient (S) and dielectr ic constant (K) measurements. Measurement of xM is free from electrode, grain boundaries, shape and size of the sample. Similarly in S measurement no current flows
through the sample and thus it is a zero current process. Hence it is also free of electrode electrolyte contact problem, grain boundaries, air pores, shape and size of the sample. S data also provides information about the nature of charge carriers. Hence the result of S data has been utilized in deciding electrical conduction mechanism in the materials of the studied system.
Fig. 1: Plots of molar magnetic usceptibility xM against absolute temperature (T) of the
system (1-x) Li3PO4 : x Li3 VO4
Fig. 2: Plots of molar magnetic susceptibility xM against absolute temperature (T) of the
system (1-x) Li3PO4 : x Li3 VO4 Table 1: Values of Tp for the system (1 - x)
Li3PO4 : x Li3VO4 from , xM and K plots Material with x Tp (K) from the study
xM K
0.0 865 860 865
0.33 885 885 880
0.50 917 920 920
0.67 930 930 925
1.0 950 950 950
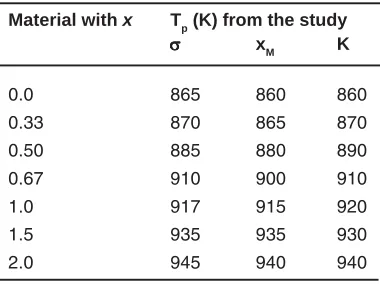
Table 2: Values of Tp for the system Li3PO4 : x Li3VO4 from s, XM and K plots Material with x Tp (K) from the study
xM K
0.0 865 860 860
0.33 870 865 870
0.50 885 880 890
0.67 910 900 910
1.0 917 915 920
1.5 935 935 930
Fig. 3: Plots of logarithm of dielectric constant (log K) against absolute temperature (T) of the
system (1-x) Li3PO4 : x Li3 VO4
Fig. 4: Plots of logarithm of dielectric constant (log K) against absolute temperature
(T) of the system (1-x) Li3PO4 : x Li3 VO4
Fig. 5: Plots of molar magnetic susceptibiilty xM against absolute temperature (T) of the
system (1-x) Li3PO4 : x Li3 VO4
Fig. 6: Plots of molar magnetic susceptibiilty xM against absolute temperature (T) of the
system (1-x) Li3PO4 : x Li3 VO4
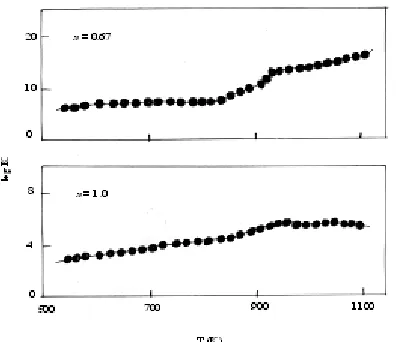
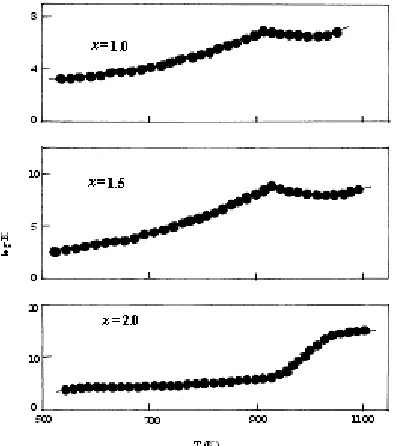
Fig. 7: Plots of logarithm of dielectric constant (log K) against absolute temperature (T) of the
system (1-x) Li3PO4 : x Li3 VO4
Fig. 8: Plots of logarithm of dielectric constant (log K) against absolute temperature
(T) of the system (1-x) Li3PO4 : x Li3 VO4 Both the molar magnetic susceptibility (xM)
and dielectric constant (K) studies are performed on two to three samples prepared in different lots from 500 K to 1100 K of the system (1-x) Li3PO4 : x Li3VO4. The xM variations with temperature (T) for this system are shown in Figs.1 and 2. It is seen from these plots that xM negative throughout the study for all the studied materials of the system indicating that the solids are diamagnetic. Initially xM remains constant with temperature and shows a drop at a particular temperature and then starts increasing for the solids with x = 0.0, 0.50 and 0.67. The materials for which x = 0.33 and 1.0, xM vary slowly with temperature, shows a peak and then becomes almost independent of temperature. The log K variations with temperature are shown in Figs. 3 and 4. The value of dielectric constant (K) is small but different for different solids. It increases slowly, shows a peak at a particular temperature and then becomes almost independent of temperature for all the solids but for the solid with x = 0.0, dielectric
constant increases very slowly but after showing a kink at a particular temperature it rises steeply. The anomalies in xM and log K against temperature plots are distinctly observed. Break temperatures xM of and log K against T plots are almost the same as have been observed in log T and S vs T-1 plots (Table 1).
The variation of molar magnetic susceptibility and dielectric constant of the system Li3PO4 : x Li3VO4 are shown in Figs. 5 and 6 as XM vs T and in Figs. 7 and 8 as log K vs T plots. It is seen from xM plots that the value of molar magnetic susceptibility is negative thought out the study showing that materials are diamagnetic in nature.
drop and then becomes almost independent of temperature. It is seen from Figs. 7 and 8 that dielectric constant increases slowly, shows a small peak and then increases very slowly again with temperature for the materials with x = 0.0, 0.67, 1.0 and 1.5. The log K vs T plot for x = 0.33, 0.50 and 2.0, initially vary very slowly with temperature, shows a knee, then increases and becomes constant. The temperatures at which anomalies are observed in and log K vs T plots are shown in Table 2 together with the break temperatures observed in log sT and S vs T-1 plots.
The materials of the studied superionic
systems (1 - x) Li3PO4 : x Li3VO4 with x = 0.00, 0.33, 0.050, 0.67 and 1.0, Li3PO4 : x Li3VO4 with x = 0.0, 0.33, 0.50, 0.67, 1.0, 1.5 and 2.0 and Li2O : V2O5 : P2O5 are ionic compounds and contain no magnetic ions. Thus they are diamagnetic as has been confirmed by the negative value of
M. Their diamagnetism depends upon their bonding configuration. The onset of disordering at phase transition disrupts the bonding configuration and leads to an abrupt change in XM Thus the temperature around which anomaly appears, is the phase transition temperature and is also confirmed by dielectric constant, electrical conductivity and Seebeck coefficient plots.1. Pizzini, S. J. Appl. Electrochem. 1: 153 (1971).
2. Lazzri, M. and Scrosati, B., J. Power Sources 1: 333 (1976).
3. Huggins, R.A, Electrochemica Acta, 22: 773 (1977).
4. Owens, B.B., Int. Symp. Solid Ionic and Ionic Electronic Conductors, Rome Sept. (1976) 5. Venkatasetty, H.V., Lithium Batter y
Technology, John Wiley and Sons, Inc. (1984).
6. Khandkar, A.C. and Wagner, J.B. Ibid. 20: 267 (1986).
7. Zhang, Li-Wei., Kobayashi, M. and Goto, K.S., Ibid. 18 and 19: 741 (1986).
8. Meghed, S., WI, Madison, (U.S.A.), Scrosati, B., J. Power Sources 51: 79 (1994). 9. Sakurai, Y., Sugihara, S., Shibata, Yamaki, M.
J., Rev. 7 60, (1995)
10. Ritchie, A.G., Giwa, C.O., Lee, J.C., Bowles, P., Gilmour, A., Allan, J., Rice, D.A., Brady, F., Tsang, S.C.E., J. Power Sources. 80: 98 (1999).
11. Wakihara, M., Mater Sci. Eng. R. Rep., R33: 109 (2001).
12. Takeuchi, E.S. and Leising, R.A. MRS Bull.
27: 624 (2004).
13. Kohler, V., Antonius, C., Bauerlein, P., J. Power Sources, 127: 45 (2006)
14. Sato H and Kikuchi R, J. Chem, Phys. 55: 677 (1971).
15. Huberman B.A., Phys. Rev. Lett. 32: 1000 (1974).
16. Rice M.J., Strossler S. and Toomb G., Phys. Rev. Lett. 32: 596, (1974).
17. Pardee W.J. and Mahan G.D., J. Solid State Chem. 15: 310 (1975).
18. Huberman B.A. and Martin R.M., Phys. Rev. B13: 1498 (1976).
19. Chandra S., ‘Superionic Solids’ Principle and Applications (North Holland Amsterdam, (1981).
20. Lal H.B., Gaur K. and Thakur A.N., J. Mat. Sci. 10: 1113 (1991).
21. Gaur K and Lal H.B., Z. Naturforsch. 47a: 1011 (1992).
22. Singh M., Thakur A.N., Gaur K. and Lal H.B., J. Mat. Sc. Lett. 11: 167 (1992).
23. Leavasseur A, Brethous J.C., Reau. J.M. Hagenmuller P. and Couzi M., Solid State Ionics 1: 177 (1980).
24. Muzushima K, Jones P.C. and Goodenough REFERENCES
J.B., Mat. Res. Bull. 15: 783 (1980).
25. Nilsson L., Thomas J.D. and Tofeld B.C., J. Phys. C. 13 (1980).
26. Khorassani A, Izquierdo G and West A.R., Mat. Res. Bull. 16: 1561 (1981).
27. Aronsson R, Barjesson L. and Torell L.M., Phys. Lett. 98A, (1983a).
28. Lunden A, Bengtzelius A, Kaber R., Nilsson L., Schrosder K. and Tarnerberg R, Solid State Ionics. 9: 1089, (1983).
29. Malugani J.P. and Mercier Rene, Solid State Ionics, 13: 293, 185 (1984-85).
30. Rodger A.R., Kuwano J. and West A.R., Solid State Ionics 15.
31. Picciotto dE L.A. and Thackeray M.M., Solid State Ionics. 18-19: 773 (1986).
32. Lal, H.B. and Srivastava, O.P., J. Mater. Sci. 77(A): 405 (1983)