RESEARCH
Proteotyping of biogas plant
microbiomes separates biogas plants according
to process temperature and reactor type
R. Heyer
1,2*, D. Benndorf
2*, F. Kohrs
2, J. De Vrieze
3, N. Boon
3, M. Hoffmann
1, E. Rapp
1, Andreas Schlüter
4,
Alexander Sczyrba
5and U. Reichl
1,2Abstract
Background: Methane yield and biogas productivity of biogas plants (BGPs) depend on microbial community struc-ture and function, substrate supply, and general biogas process parameters. So far, however, relatively little is known about correlations between microbial community function and process parameters. To close this knowledge gap, microbial communities of 40 samples from 35 different industrial biogas plants were evaluated by a metaproteomics approach in this study.
Results: Liquid chromatography coupled to tandem mass spectrometry (Orbitrap Elite™ Hybrid Ion Trap-Orbitrap Mass Spectrometer) of all 40 samples as triplicate enabled the identification of 3138 different metaproteins belong-ing to 162 biological processes and 75 different taxonomic orders. The respective database searches were performed against UniProtKB/Swiss-Prot and seven metagenome databases. Subsequent clustering and principal component analysis of these data allowed for the identification of four main clusters associated with mesophile and thermo-phile process conditions, the use of upflow anaerobic sludge blanket reactors and BGP feeding with sewage sludge. Observations confirm a previous phylogenetic study of the same BGP samples that was based on 16S rRNA gene sequencing by De Vrieze et al. (Water Res 75:312–323, 2015). In particular, we identified similar microbial key players of biogas processes, namely Bacillales, Enterobacteriales, Bacteriodales, Clostridiales, Rhizobiales and Thermoanaerobacte-riales as well as MethanobacteThermoanaerobacte-riales, Methanosarcinales and Methanococcales. For the elucidation of the main biomass degradation pathways, the most abundant 1 % of metaproteins was assigned to the KEGG map 1200 representing the central carbon metabolism. Additionally, the effect of the process parameters (i) temperature, (ii) organic loading rate (OLR), (iii) total ammonia nitrogen (TAN), and (iv) sludge retention time (SRT) on these pathways was investigated. For example, high TAN correlated with hydrogenotrophic methanogens and bacterial one-carbon metabolism, indicating syntrophic acetate oxidation.
Conclusions: This is the first large-scale metaproteome study of BGPs. Proteotyping of BGPs reveals general cor-relations between the microbial community structure and its function with process parameters. The monitoring of changes on the level of microbial key functions or even of the microbial community represents a well-directed tool for the identification of process problems and disturbances.
Keywords: Biogas, Biogas plant, Anaerobic digestion, Metaproteomics, Community function, Microbial resource management, MetaProteomeAnalyzer, Clustering, Principal component analysis, Network analysis machine learning
© 2016 The Author(s). This article is distributed under the terms of the Creative Commons Attribution 4.0 International License (http://creativecommons.org/licenses/by/4.0/), which permits unrestricted use, distribution, and reproduction in any medium, provided you give appropriate credit to the original author(s) and the source, provide a link to the Creative Commons license, and indicate if changes were made. The Creative Commons Public Domain Dedication waiver (http://creativecommons.org/ publicdomain/zero/1.0/) applies to the data made available in this article, unless otherwise stated.
Open Access
*Correspondence: [email protected]; benndorf@ mpi-magdeburg.mpg.de
1 Bioprocess Engineering, Max Planck Institute for Dynamics of Complex
Technical Systems, Sandtorstraße 1, 39106 Magdeburg, Germany
2 Bioprocess Engineering, Otto von Guericke University Magdeburg,
Universitätsplatz 2, 39106 Magdeburg, Germany
Background
The conversion of biological waste to methane in biogas plants (BGPs) is one of the main renewable energy sources in Germany. Currently, more than 8000 BGPs
cover about 3 % of the total annual energy demand [2].
Each BGP has its individual operation conditions and specific process parameters due to differences in plant design, regional substrate availability, and operator’s con-siderations. As a consequence, cultivation conditions dif-fer significantly between BPGs. Thus, each BGP has its own signature regarding the composition and function of the microbial community which catalyzes the conversion of complex substrates to methane and carbon dioxide.
Hydrolysis, fermentation, acetogenesis, and metha-nogenesis—the basic steps of anaerobic digestion—are catalyzed by different members of a microbial commu-nity interacting with each other. The interactions of the various strains in anaerobic digestion are characterized by dependencies on different trophic levels. For example, secondary fermenters are strictly dependent on hydrog-enotrophic methanogens. This syntrophic interaction,
characterized by interspecies hydrogen transfer [3], keeps
the concentration of hydrogen sufficiently low to make secondary fermentation thermodynamically feasible. Nevertheless, in situ bioaugmentation by hydrogen pro-ducers leads to intensified biogas production indicating
that hydrogen is a bottleneck in the overall process [4].
For robust biogas production with high yields, the rates of different reactions and, consequently, the occurrence and activity of the microbes in the community should be well balanced. Otherwise, undesired by-products, such as short chain organic acids, can accumulate caus-ing unwanted acidification of the BGP. Variations in the composition of substrates and process conditions, for example temperature, pH value or ammonia concentra-tion are challenging because the balance has to be read-justed immediately by metabolic adaptation of the actual community, and by long-term changes in the community composition. Accordingly, the composition of microbial communities of BGPs was reported to vary even after
small changes in process conditions [5]. On the other
hand, it may also remain at steady state over long periods
of operation [6]. Thus, robustness against external factors
is considered crucial for BGP operation. Several authors
[5, 7, 8] correlated BGP robustness with high values of
the ecological indice richness and low values of the eco-logical indice evenness. Hence, both highly abundant key players and less abundant species are required to achieve high performance and high process stability.
Correlations between process parameters and micro-bial communities cannot be inferred from analysis of a single BGP, due to individual operation conditions
and specific process parameters of each BGP. Studies involving a large number of BGPs demonstrated, for example, that the composition of microbial communi-ties was mainly correlated with the substrate, process
temperature and ammonia content of the BGPs [1, 9,
10]. So far, however, most studies were conducted by
sequencing of 16S rRNA genes covering exclusively community composition, but not metabolic function.
Therefore, metagenomic [11], metatranscriptomic [12]
or metaproteomic [13] approaches are more
informa-tive for the investigation of complex microbial
com-munities in BGPs [14]. While metagenomics covers the
genetic potential, metatranscriptomics and metaprot-eomics determine the actual gene expression and better represent the physiological state of the microbial com-munities. Interestingly, the comparison of metagenom-ics and metaproteommetagenom-ics results revealed differences
in the community composition [15]. In particular, the
proportion of methanogenic Archaea within microbial
communities has been underestimated using
metagen-omics or 16S rRNA sequencing in earlier studies [5].
Recent studies showed higher proportions of
metha-nogenic archaea [41, 42]. For 16S rRNA, sequencing
bias could be caused by the use of polymerase chain
reaction (PCR) [16, 17] whereas bias during
sam-ple extraction is a challenge for all omics approaches. Advantages and disadvantages of metaproteomics and other approaches for analysis of BGPs were extensively
reviewed by Heyer et al. [13].
Up to date, the lack of corresponding metagenome data and high experimental efforts prevented a widespread application of metaproteomics for routine analysis of BGPs. However, the availability of recent high-resolu-tion mass spectrometry (MS) increases tremendously the depth of metaproteome analyses and, therefore, ren-ders extensive sample pre-fractionation unnecessary. Furthermore, the identification and annotation of pro-teins in metaproteomics can be improved by specifically adapted software solutions (e.g., MetaProteomeAnalyzer
(MPA) [18]) and searching against specific metagenome
databases (e.g., metagenomes of agricultural BGPs). In the following, this approach was used to investigate the functional differences of microbial communities within different biogas plant and their correlations to the pro-cess conditions for nearly the same 40 samples as used in a 16S rRNA gene-based study recently published by De
Vrieze et al. [1].
taxonomic composition of the microbial communities as
the study of De Vrieze et al. [1], and revealed several
cor-relations between the process parameters and the func-tion of the microbial community.
Results and discussion Biogas plant process parameters
Forty samples from 35 different full-scale BGPs were investigated by metaproteomics concerning the taxo-nomic and functional composition of their microbial communities. Thirty-four samples were identical to
sam-ples previously analyzed by De Vrieze et al. [1] allowing
for a comparison of the taxonomic results based on this metaproteomics approach to the published data based on 16S rRNA amplicon sequencing and real-time PCR. The samples covered different reactor types, namely continu-ously stirred tank reactors (CSTRs) and upflow anaerobic sludge blanket (UASB) reactor systems as well as a wide range of substrates (agricultural substrates, industrial waste, slaughter house waste, sewage sludge, municipal
waste, mixed/unknown substrates) (Additional file 1:
Table S1). Other differences were: (i) mesophile (33– 35 °C) and thermophile (40–54 °C) process conditions, (ii) a range in the organic loading rate (OLR) from 1.5
kgCOD/(m3d) to 11 kgCOD/(m3d), and (iii) pH values from
7.1 to 8.6. Some process parameters were correlated, for example high temperatures and OLR with high biogas
productivity m3biogas/m3fermenter volumed (Additional
file 1: Table S2).
Protein identification
Proteins from all BGPs were successfully extracted and their quality was assessed by sodium dodecyl sulfate polyacrylamide gel electrophoresis. Subsequent LC– MS/MS based protein identification using an Orbitrap
Elite™ Hybrid Ion Trap-Orbitrap MS and database search
against UniProtKB/Swiss-Prot including several
metage-nomes [11, 15, 19, 20] using a false discovery rate of 1 %
revealed up to 4000 identified spectra and 8000 proteins for each BGP. Subsequent grouping of redundant pro-tein identifications to metapropro-teins by their affiliation
to UniRef 50 clusters [21] reduced the number of
differ-ent metaproteins to less than 900 for a single BGP and to 3138 for all BGPs. The quantity of metaproteins and the associated number of taxonomic orders and biologi-cal processes was further downsized by the application of a threshold to include only metaproteins represented by at least 1 % of the spectra in at least one BGP. In a last step, a correlation matrix of all metaproteins, taxonomic orders, biological processes, as well as process param-eters was generated for further analyses. For a detailed documentation of all these steps, please refer to the Note
1 (Additional files 2, 3, 4, 5, 6, 7).
Grouping of biogas plants based on cluster analysis and principal component analysis
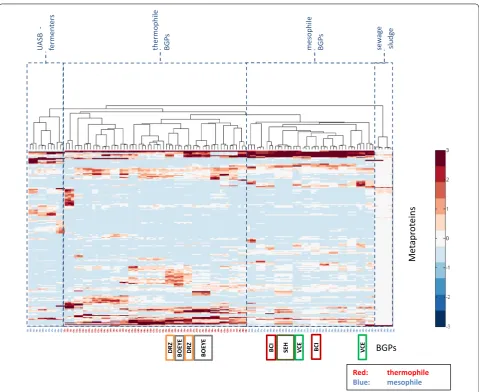
In comparison to 16S rRNA gene sequencing, metapro-teomics provides more extensive data sets for statisti-cal analysis, in particular with respect to the function of the identified metaproteins. Thus, it is to be expected that BGPs can be separated into different clusters cor-relating with reactor types, substrates or process condi-tions. In our study, hierarchical clustering analysis based
on metaproteins (Fig. 1) resulted in five to six branches
which could be combined to four main groups: UASB reactors, sewage sludge as substrate, mesophile, and
ther-mophile process conditions (p < 0.01 [22]).
As expected, the clustered heat map (Fig. 1) revealed a
close correlation of the triplicates. BGP 06 and BGP 07 formed one branch, which may be explained by similar process parameters. Furthermore, a BGP (SEH, Gent 20/ Gent22), which uses two fermenters operating in paral-lel clustered in one branch. Taken together, these results suggest good reproducibility of the whole workflow including sampling, protein extraction, and LC–MS/ MS. BGPs represented by at least two sampling time points (BGP: VCE, BCI, BOEYE, DRZ) also showed some similarity. However, these BGPs did not cluster in linked branches as reported previously for same BGPs
but different sampling time points by Heyer et al. [23] or
Werner et al. [9]. This could be due to differences in
pro-cess conditions influencing the community composition and the metabolic activity as described by Theuerl et al.
[5]. Indeed, the volatile acid content for these samples
changed drastically [from 5735 to 0 mgCOD/L for BGP
VCE (Gent 15/Gent 29) or from 5593 to 22,601 mgCOD/L
for BGP BCI (Gent 33/Gent 39)].
The four major groups of microbial communities revealed by cluster analysis were also identified by prin-cipal component analysis (PCA). However, the two main
components of the PCAs for taxonomic orders (Fig. 2a),
biological processes (Fig. 2b), and the metaproteins
(Fig. 2c) explained only 25, 33 and 28 % of the variances,
respectively. Probably, these low values are caused by the very high number of metaproteins, taxonomic orders, and biological processes considered in the statistical analysis as well as the large biological variation between individual plants. Despite this, the plots confirmed a high similarity of triplicates as well as a low sample to sample variation at different sampling time points from the same BGP. Furthermore, visual inspection of the loading plots
of the PCAs (Additional file 8: Figure S1) allows for
UA
SB
-fermente
rs
thermophile BGPs
Red: thermophile
Blue: mesophile
sew
ag
e
sludge
mesophile BGPs
Me
ta
pr
oteins
BGPs
BOEY
E
BOEY
E
SE
H BCI
BC
I
DR
Z
DR
Z
VC
E
VC
E
16
c16b16a36c36a36b17cb1717a40c40a40b12a12b12c03c03a03b02a02c02b01cb0101a04b04c04a14b14a14c13a13b13c09c09a09b08bc0808a06a06b07a07b07c06c20a20b20c35b35c35a25ac2525b27a27b27c23c23b23a10a10c10b05c05a05b11ac1111b28a28b28c31a31b31c37b37c37a39c39b39a24cb2424a22b22a22c29b29a29c21c21d21a33c33a33b32cb3232a26c26b26a30a30c30b38b38a38c15c15b15a18ab1818c19c19b19a34b34c34a
Fig. 1 Clustered heat map of all BGPs and their metaprotein profiles generated by hierarchical cluster analysis using the Matlab function
“clus-tergram”. The numbers of metaproteins were normalized to have a mean of 0 and a standard deviation of 1 (see also color key right of the figure).
Names of BGPs are below the figure, whereas blue names refer to BGPs operating with mesophilic and red names to BGPs operating with
thermo-philic process conditions. The colored groups are samples from the same BGP at different time points (dark green SEH) parallel fermenters [Gent 22
(2012-04-04), Gent 24 (2012-04-04)]; green VCE [Gent 15 (2011-10-10), Gent 29 (2012-04-10)]; gray BOEYE [Gent 23 14), Gent 27
(2012-04-11), Gent 35 (2011-09-29)]; orange DRZ [Gent 20 (2011-09-29), Gent 25 (2012-04-04)]; red BCI [Gent 33 (2012-04-11), Gent 39 (2011-09-29)]. After
visual assignment, four main clusters of microbial communities are proposed, namely UASB fermenters, thermophile BGPs, mesophile BGP as well as BGPs running with sewage sludge
PCA based on taxonomic orders (25% variance) PCA based on biological processes (33% variance) PCA based on metaproteins (28% variance)
Observ
aon
s
a b c
Fig. 2 Principal component analyses of all BGPs based on taxonomic order (a), biological processes (b) and metaproteins(c). Colored groups are
temperature methane is produced by several different pathways (acetoclastic, hydrogenotroph, methylotroph) and at thermophilic conditions mainly by the
hydrog-enotrophic pathway [24]. In contrast, more metaproteins
related to DNA recombination, DNA repair and amino acid biosynthesis were identified in thermophile BGPs. Comparing the results with a PCA based on 16S rRNA
taxonomic data [1], the observed groups were also rather
similar. Only the separation of mesophile and thermo-phile BGPs by metaproteome-based taxonomic orders
was insufficient (Fig. 2c). However, taxonomic
informa-tion extracted from metaproteomics experiments is not as accurate as data obtained from 16S rRNA sequencing
[1] due to the shorter length of tryptic peptides in
com-parison to fragments of sequenced 16S rRNA genes.
Significance of microbial community indices
Microbial community indices, such as the number of species (richness) and the equitability of these species
(evenness) [25–27], are widely applied to characterize
ecosystem function and stability. So far, however, the use of taxonomy-based metaproteome data was not consid-ered for the estimation of both indices. In the following, we test whether both indices show correlations with pro-cess parameters.
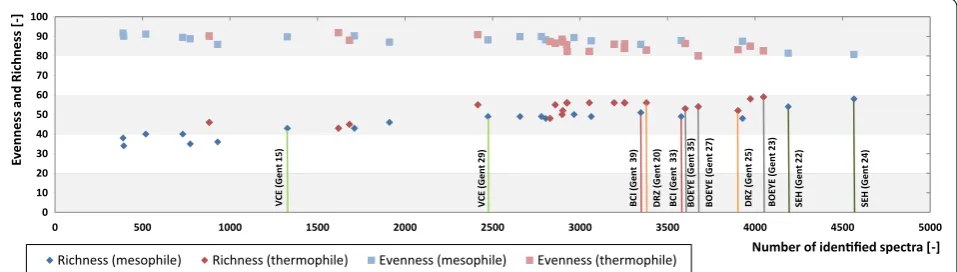
The richness index of samples from BGPs increased with the number of identified spectra from 38 to 58 tax-onomic microbial orders and reached a saturation level
above 4000 spectra (Fig. 3). In parallel, the evenness
index slightly decreased from 92 to 81 % (Gini Index)
[25–27]. Thus, a minimal number of approximately 4000
identified spectra seems to be required for the descrip-tion of microbial communities of BGPs.
Comparison of richness and evenness index for dif-ferent time points of similar BGPs revealed a high simi-larity for the BGP SHE (Gent 22, Richness/Gini Index: 34/70.1 %; Gent 24, Richness/Gini Index: 35/69.4 %)
and the DRZ (Gent 20: Richness/Gini Index: 33/73.1 %; Gent 25, Richness/Gini Index: 34/73.1 %). However, both indices differed for the other BGPs, as also shown by De
Vrieze et al. [1]. For the investigated BGPs, this was most
likely due to changes in volatile fatty acids concentra-tions or process temperatures. In general, higher process temperatures resulted in higher richness and lower even-ness indices. This is in contrast to the results obtained by
Leven et al. [7], who reported a lower richness index at
higher temperatures. This may be caused by a system-atic bias of metaproteomics data, i.e., as metaproteomic approaches tend to overestimate high abundant pro-teins and corresponding species. Probably, the richness index is underestimated in mesophile BGPs due to the high number of taxonomic orders below detection limit. Thus, both indices have to be interpreted with care when applied for the description of microbial communities based on metaproteome data.
Structure of the microbial community
Microbial communities in well-operating BGPs are
often at steady state [6]. The structure of the
commu-nity represents the taxonomic groups required for con-version of the complex substrate to biogas. Sampling a large number of BGPs might answer the question which microorganisms are essential for stable processes, thus
representing a core biogas microbiome [28]. In our study,
34.2 % of the identified spectra (median of all BGPs)
were assigned to Archaea and 67.78 % to Bacteria on the
superkingdom level, which fitted to the results of a
pre-vious metatranscriptome study [12]. The lowest amount
of Archaea (11.9 %) was found in BGP Gent 05 and the highest amount (77.7 %) in BGP Gent 16. In contrast, the
abundance of 16S rRNA genes of Archaea and Bacteria
identified by De Vrieze et al. [1] was significantly
differ-ent. Only 1 % Archaea (median) were identified with a
minimum of 0.18 % and a maximum of 48 %. Such strong
0 500 1000 1500 2000 2500 3000 3500 4000 4500 5000 0 10 20 30 40 50 60 70 80 90 100 0% 10% 20% 30% 40% 50% 60% 70% 80% 90% 100% Ev enness and Richness [-]
Number of idenfied spectra [-] Richness (mesophile) Richness (thermophile) Evenness (mesophile) Evenness (thermophile)
VCE (Gent 15 ) VCE (Gent 29 ) BC I(Gent 39) BCI (Gent 33) SEH (Gent 24) SEH (Gent 22) DRZ (Gent 20) DRZ (Gent 25) BOEY E (Gent 23) BOEY E( Gent 2 7) BOEY E (Gent 35)
Fig. 3 Microbial richness and evenness with increasing number of identified spectra. Evenness is computed as the Gini Index, ranging in value
differences between the abundance of Bacteria and
Archaea have been observed before, and are probably
caused by a methodical bias, for example, 4 % Archaea
(metagenomics) versus 20–30 % (metaproteomics) [15]
or 0.2/7 % Archaea (qPCR) versus 12/6 % (microscopy)
[29]. Interestingly, the Anaerobic Digestion Model 1
(ADM1) predicts 30–40 % of Archaea in mesophile,
agri-cultural CSTR-BGPs [30]. For some BGPs, in particular
with lower numbers of identified spectra (less than 4000
identified spectra), the amount of Archaea seems to be
overestimated, suggesting again that a minimal number of identified spectra is essential for the assignment of meaningful taxonomy profiles (see estimation of commu-nity indices above).
On the order level, bacterial profiles were dominated by Bacillales (23.8 %), Enterobacteriales (11.1 %), Bac-teriodales (11.1 %), Clostridiales (5.1 %), Rhizobiales
(4.7 %), and Thermoanaerobacteriales (4.6 %) (Fig. 4a),
and archaeal profiles comprised Methanobacteriales
(38.3 %), Methanosarcinales (30.1 %) and Methanococca-les (8.4 %) (Fig. 4b). The archaeal group Methanococcales
was not observed in the work of De Vrieze et al. [1], but it
was detected in other genome-based studies, for example
by Stolze et al. [31]. The corresponding genome-based
taxonomic profiles identified by De Vrieze et al. [1] were
dominated by Clostridia (Clostridiales 21.8 %, MBA08
9.8 %) and Bacteriodales (13.5 %), resp.
Methanobacteri-ales (63.2 %). Similar differences between the taxonomic
profiles based on metagenomics and metaproteomics approaches were reported previously by Hanreich et al.
[15].
The observed differences in the taxonomy profiles based on 16S rRNA amplicon sequencing and metaprot-eomics could be caused by methodical biases. In particu-lar, cell lysis and the yield of extractions for genomic and proteomic approaches are different. Moreover, genetic methods might be biased by variations of primer affini-ties to target genes and differences in copy numbers of
the 16S-RNA genes [32]. In contrast,
metaproteomics-based taxonomy profiles are limited by the presence of highly conserved sequences of identified peptides that prevent the assignment of approximately 50 % of the pep-tides to a certain order, so far.
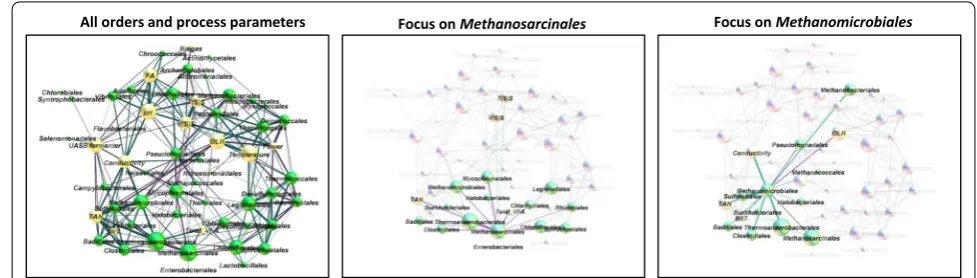
To identify microbial interactions and correlations of the microorganisms with process parameters, a network of taxonomic orders and all process parameters was
cre-ated using the software Gephi (Fig. 5). Therefore, all
taxo-nomic orders and process parameters were visualized as nodes and their correlations as edges, followed by a spa-tial separation based on the connectivity of the nodes and the force atlas algorithm.
Most of the positive correlations between taxo-nomic orders can be explained by preferences of the
corresponding microorganisms for similar process parameter. High temperatures seem to support the
enrichment of Thermotogales, Deinococcales,
Thermococ-cales and Spirochaetales. Several positive correlations for
Methanomicrobiales with, for example, Clostridiales or
Thermoanaerobacteriales were also observed. This
cor-relation corresponds to the role of Methanomicrobiales
as syntrophic hydrogen consumers [33]. Surprisingly, the
hydrogen-consuming order Methanobacteriales has only
one single positive correlation with Methanomicrobiales,
which could be explained by similar niche preferences
[34]. Furthermore, Methanosarcinales showed
exclu-sively negative correlations to other taxonomic orders,
for example, to Clostridiales, Thermoanaerobacteriales,
and Spirochaetales. This is most likely due to the fact
that Methanosarcinales either use acetate or hydrogen
for methanogenesis, which makes them independent of other species providing substrates. Instead, negative cor-relations to TAN and total VFA confirmed their sensitiv-ity for high ammonia concentrations and volatile fatty acids (VFA).
Based on the assumption that independent of the BGP design and of process condition, all major steps of AD are performed; it was tried to identify a core microbi-ome representing taxonomic orders that are present in all
BGPs. This is true for the bacterial orders Clostridiales,
Enterobacteriales and Rhizobiales that were identified in all BGPs with at least 1.0, 1.7 and 0.3 % of all spectra, respectively. These low abundances corresponded also with the abundances of core microorganisms calculated based on 16S-RNA amplicon sequencing data,
con-firming the existence of at least 0.4 % of the order
Bac-teroidales and 0.1 % of the order Clostridiales in each
BGP (light bars in Fig. 4a). Furthermore, the archaeal
orders Methanobacteriales (4.3 %) and
Methanosarcina-les (0.7 %) were detected in all BGPs by
metaproteom-ics (light bars in Fig. 4b), and also with 0.5 and 0.04 %
respectively, by real-time PCR [1]. With respect to the
low number of taxonomic core orders identified for all BGPs, the microbial communities were more diverse than expected, reflecting the broad range of substrates and process parameters.
In addition, as clustering and PCA showed four groups of BGPs, microbiomes were separately analyzed
(Addi-tional file 9: Table S1). The comparison revealed major
differences between groups, and explains the very low number of core orders taking into account for all BGPs. The variations within the groups were smaller and sev-eral taxonomic orders could be assigned to specific types of BGPs. For instance, thermophile BGPs were
linked with several thermophile orders, such as
Methanosarcinales, responsible for acetoclastic metha-nogenesis, was typical for UASB reactors and BGPs
with sewage sludge as substrate. Syntrophobacteriales,
associated with syntrophic interactions, were specific
for UASB reactors, whereas the order
Nitrosomonod-ales, performing nitrification [35], was typical for BGPs
Fig. 4 Bacterial (a) and archaeal (b) taxonomy profiles on the order level based on metaproteome data and genetic analyses of the 16S rRNA for all
BGPs. Calculations of the error bars were carried out using the standard deviation for all taxonomic orders of all BGPs. Additionally, for all profiles, the
core elements identified in all BGPs are shown in light red (blue) and labeled with the associated minimum value. Unlabeled and dark red (blue) bars
fed with sewage sludge. On the other hand, the class
Clostridia was a marker for mesophile BGPs, as well as
the methanogenic orders Methanobacteriales and
Meth-anomicrobiales, previously correlated with mesophile
conditions by Nettmann et al. [36]. Accordingly, future
attempts to define core microbiomes should focus on the analysis of groups of BGPs with comparable substrate supply and similar process conditions.
Biological processes and functions
The growth of microbial communities as well as conver-sion of complex substrates to biogas requires a minimum set of biological pathways and cellular functions. These are represented by metaproteins and may be grouped into biological processes. In our study, biological pro-cesses were dominated by methanogenesis (median: 21.0 %, min: 2.9 %), followed by transport (median: 15.9 %, min 7.7 %) and one-carbon metabolism (median:
5.2 %, min: 0.5 %) (Fig. 6a). Also, the abundance of
biolog-ical processes corresponded well with the most abundant metaproteins. Two of the three most abundant metapro-teins belonged to methanogenesis, namely
methyl-coen-zyme M reductase (MCR) (median α: 1.8 + 1.4 %, β:
2.5 %, ɣ: 1.4 %, min: 0.02 %), and
5,10-methylene-tetrahy-dromethanopterin reductase (5,10-methylene-H4MPT
reductase) (median: 1. 3/2.1 % min: 0.04 %) (Fig. 6b).
Proteins involved in transport and methanogenesis were expressed in all BGPs, ensuring the uptake of substrates and their degradation to methane.
Different process conditions associated with the four clusters of BGPs also correlate with differences in the abundance of metaproteins and biological functions
(Additional file 9: Table S2, S3). Thermophile BGPs
were dominated by metaproteins for DNA recombina-tion, DNA repair and amino acid biosynthesis, as already
observed in the loading plot of the PCA (Fig. 2).
Mark-ers for mesophile BGPs were metaproteins for short
chain fatty acid metabolism, lipid metabolism and one-carbon metabolism. The identification of specific core functions of BGPs treating sewage sludge or BGPs using UASB reactors was difficult, due to the low total number of metaproteins. Typical for sewage sludge as substrate was nitrate assimilation involving the uptake of inorganic nitrogen that is used as an electron acceptor. Further-more, a digestive enzyme from human chymotrypsin-like elastase family member IIIA (P09093, K01311) was detected. Although the latter enzyme is not involved in the biogas process, it might be a valuable marker for
human feces, as previously proposed by Kuhn et al. [37]
and Püttker et al. [38].
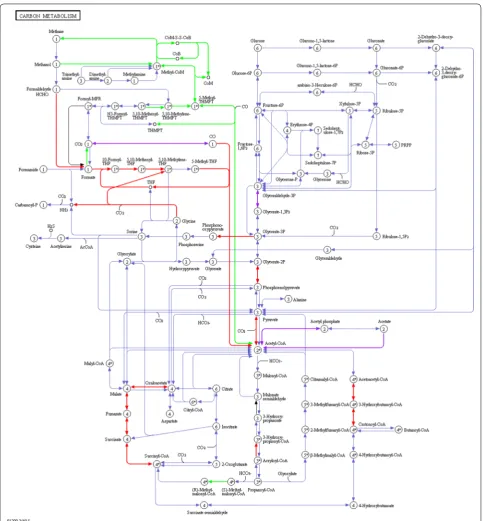
Many biological functions identified were linked to cel-lular metabolism. Therefore, metaproteins were mapped against different metabolic pathways. Best pathway cov-erage was achieved using the KEGG map 1200 (carbon
metabolism) (Fig. 7). Almost all steps of
hydrogeno-trophic and acetoclastic methanogenesis were observed
and assigned to Methanobacteriales and
Methanosarci-nales, respectively, as previously described [24, 39–42]. Numerous bacterial folate-dependent enzymes repre-senting one-carbon metabolism were detected that might be involved either in acetogenesis or in syntrophic acetate oxidation (SAO), as also observed by Campanaro et al.
[42]. Most of these were assigned to the homoacetogenic
species Moorella thermoacetica (Clostridium
thermoace-ticum), which actually performs homoacetogenesis [43]. Only the enzyme formate-tetrahydrofolate ligase was
assigned to a syntrophic species (Syntrophobacteriales).
Probably, the limited genome data of syntrophic acetate oxidizers hampered a correct identification and taxo-nomic assignment of this functional group that is essen-tial for thermophile BGPs.
Enzymes of the reductive TCA cycle were mainly
assigned to Proteobacteria, in particular to E. coli,
involved in the fermentation of pyruvate to succinate.
All orders and process parameters Focus on Methanosarcinales Focus on Methanomicrobiales
Fig. 5 Graph network of taxonomic orders (green nodes) and process parameters (yellow nodes). Node size depends on the number of edges. Blue
edges represent positive correlations, red edges negative correlation. In the second and third subfigure, only the correlations to Methanosarcinales
The identification of lactate dehydrogenase (not included
in KEGG map 1200 (Fig. 7) assigned to E. coli indicates
that mixed acid fermentation was also carried out. In addition to glycolytic enzymes that were mainly assigned to bacteria, several enzymes probably involved in butyrate fermentation were detected. The
assign-ment to Bacillales and not to Clostridiales is
surpris-ing, and might raise questions regarding the reliability of taxonomic assignments on that taxonomic level. In
Clostridiales, the enzymes amino methyltransferase (P54378, K00605) and glycine reductase complex com-ponent B (Q9R4G8, EC: 1.21.4.2) were identified. The first enzyme catalyzes the degradation of glycine to carbon dioxide, ammonia and methylene-THF, which could be further converted to acetate via the
Wood-Ljungdahl pathway [44]. The second enzyme enables
anaerobic degradation of glycine via the so-called Stickland reactions [not included in KEGG map 1200
(Fig. 7)].
Correlation of metaproteome data to the process parameters
A main objective of this large-scale analysis of 40 BGPs was to correlate taxonomic and functional data with pro-cess parameters. In particular, the temperature, TAN, OLR and SRT showed significant correlations with selected pathways represented in the KEGG map 1200 (carbon metabolism).
Since the influence of process temperature on
micro-bial community has been described previously [24, 45],
this parameter was investigated first. High temperature
(Additional file 10: Figure S1) correlated with an increased
amount of glycolytic enzymes, and lower temperature with a high number of methanogenic enzymes (Additional
file 11: Figure S2). The apparent increase of the
metapro-tein Acetyl-CoA decarbonylase/synthase at higher tem-perature contradicts the assumption that acetoclastic methanogenesis is not favored. However, only subunit delta 2 of this metaprotein was positively correlated with
Fig. 6 Core community. The top 20 core biological processes (a), as well as the top 20 core metaproteins (same UniRef50) (b) are shown, based
on the number of identified spectra and the median over all BGPs. Calculations of the error bars were carried out using the standard deviation of
each metaprotein (resp. biological process), calculated for all BGPs. Additionally, for all profiles, the core elements identified in all BGP are shown in
light red and labeled with the associated minimum value. Unlabeled and dark red bars indicate that these biological processes resp. metaproteins
were not observed in all BGPs. Two different types of S-layer protein and flagellin were identified in the samples. GAPD glyceraldehyde-3-phosphate
high temperatures, whereas all others observed subunits of the enzyme remained unchanged.
In addition, enzymes involved in butyrate and pro-pionate fermentation [acyl-CoA dehydrogenase (UniRef50_O32176, EC: 1.3.99.-); 3-ketoacyl-CoA thiolase
(UniRef50_O32177, K00632); 3-hydroxyacyl-CoA dehy-drogenase (O32178, EC: 1.1.1.35)] were correlated with lower temperature.
High TAN concentrations that are known as a stress
factor for BGPs [46] are correlated with increased
Fig. 7 Assignment of identified microbial proteins to the KEGG map 1200 (carbon metabolism) (greenArchaea, redBacteria, purple metaproteins of
bacterial one-carbon metabolism as well as enhanced
hydrogenotrophic methanogenesis by the families
Meth-anobacteriaceae and Methanosarcinaceae (Additional
file 12: Figure S3) [47]. Both of these biological
func-tions hint to syntrophic acetate oxidation (SAO). The
taxonomic orders Clostridiales, Thermoanaerobacteriales
and Methanomicrobiales were described as key
microor-ganisms involved in SAO [42, 46]. The high abundance
of key enzymes involved in hydrogenotrophic metha-nogenesis (5,10-methylenetetrahydromethanopterin
reductase; Euryarchaeota) and one-carbon metabolism
(Q3Z8K3 formate-tetrahydrofolate ligase;
Syntrophobac-ter fumaroxidans) confirmed this hypothesis. The latter enzyme might also function in reverse direction towards
homoacetogenesis, but the low number of
Methanosarci-nales identified and the presence of a key enzyme of the acetoclastic methanogenesis (P26692 Acetyl-CoA
decar-bonylase/synthase complex subunit alpha, Methanosaeta
concilii) at high TAN indicate that SAO is the preferred reaction. Finally, with decreasing TAN, acetoclastic
methanogenesis by Methanosaeta seems to become more
abundant (Additional file 13: Figure S4).
High OLRs were positively correlated with acetoclastic
methanogenesis (Methanosarcinales) and bacterial glycolysis
(Additional file 14: Figure S5). In contrast, at low OLR
(Addi-tional file 13: Figure S4) hydrogenotrophic methanogenesis
and bacterial one-carbon metabolism were increased.
Similar to the low OLR (Additional file 15: Figure S6), a
high SRT was linked to hydrogenotrophic methanogenesis
and bacterial one-carbon metabolism (Additional file 16:
Figure S7). In contrast, a low SRT was correlated with
ace-toclastic methanogenesis (Additional file 17: Figure S8).
Both high SRT and low OLR are supporting SAO, which is in accordance with low growth rates of bacteria carrying out SAO. However, in case of opposite conditions these
bacteria seem to be washed out from BGP [48].
Finally, the available data were used to identify single parameters as markers for certain process conditions.
Using decision tree learning, (Additional file 18: Table S1),
three potential markers were identified: (i)
5,10-methyl-enetetrahydromethanopterin reductase (Q8TXY4
Eur-yarchaeota) for high TAN, (ii) the order Thermotogales
for high process temperature [49], and (iii) a decrease of
MCR [P07962 MCR subunit alpha (Methanosarcina
bark-eri str. Fusaro)] for high OLR. The latter enzyme has been already proposed previously as a marker for
methanogen-esis [23, 50]. However, the lack of markers for many other
process conditions indicates that more BGPs should be sampled or additional data (e.g., higher depth of metapro-teome analysis) should be included in the future studies. Furthermore, the applied classification thresholds for the individual process parameters strongly influenced the identification of the markers. In most cases, classification
thresholds were taken from the literature [51–53];
oth-erwise, medians of the process parameters were applied. Unfortunately, threshold values of classifications reported in the literature often vary significantly. For instance, for the classification of BGPs with regard to TAN, Chen et al.
[52] applied a threshold of 4200 mg/L whereas Schnürer
et al. [53] used a threshold of 3000 mg/L. Using this lower
threshold for classification, the reliability of
5,10-methyl-enetetrahydromethanopterin reductase (Q8TXY4
Eur-yarchaeota) as an indicator for high TAN was increased, as indicated by the lower error rate for the classification (data not shown).
Conclusions
In this study, the first large-scale proteotyping of 40 BGP samples was conducted. The optimized workflow estab-lished for the investigation of microbial communities in BGPs did not require extensive pre-fractionation of sam-ples, but achieved a high coverage of proteins by apply-ing sensitive Orbitrap-MS, and searchapply-ing spectra against BGP metagenomes using a comprehensive bioinformat-ics platform.
The results of the proteotyping enabled the cluster-ing of data of biogas processes to identify (i) UASB fer-menters, (ii) feeding of sewage sludge as substrate, (iii) mesophile, and (iv) thermophile process conditions, as
previously reported by De Vrieze et al. [1] using a 16S
rRNA gene sequencing approach. Based on functional analysis, TAN, SRT, OLR, and temperature were identi-fied as key parameters determining the composition and function of microbial communities.
Although observed correlations (e.g., for high TAN and hydrogenotrophic methanogenesis) were mainly related to SAO and methanogenesis, metaproteome analysis has the potential for answering major ecological questions and for monitoring of the health of BGPs. Proteotyping BGPs in the follow-up studies should include the analy-sis of (i) healthy BGPs over longer periods, (ii) similar BGPs with different process conditions (e.g., feed com-position, OLR) and (iii) ‘sick’ BGPs with severe process disturbances (e.g., acidification, foaming). The approach could filter out more specific core taxonomies and core functions than presented in this paper. Based on these systematic studies, metaproteins or taxonomies could be identified as biomarkers. If the abundance of these biomarkers is rapidly changing or behave contradictory to selected process parameters, this might be a sign of (future) process failure.
Methods
The complete workflow included experimental and
com-putational steps (Additional file 19: Figure S1). All
or higher, and for LC–MS/MS measurements only MS grade chemicals were used.
Sampling and analytics
With the exception of four samples (BIE2, Oss2, Oss3, BCI3), the same samples of the BGP used in the study
of De Vrieze et al. [1] were analyzed. However, samples
from additional BGPs were taken into account resulting in a total number of 40 BGP samples. The pH values were measured directly after sampling. The TAN, volatile sol-ids (VS) and total solsol-ids (TS), and the conductivity were measured after storage at 4 °C, and VFA concentration
after storage at −20 °C [1]. The plant operators provided
information concerning the OLR, SRT, biogas produc-tion, temperature, reactor type (CSTR/UASB) and vol-ume, as well as on the substrate composition (Additional
file 1: Table S1, S2).
Metaproteomics
Protein extraction from digestate stored at −20 °C was
carried out by phenol extraction as described by Heyer
et al. [23]. Proteins were dissolved in a solution
con-taining 7 M urea, 2 M thiourea as well as 0.01 g/mL 1,4-dithiothreitol, and quantified with an amido black
assay [54]. For each sample, 200 µg of protein was
pre-cipitated by acetone, and separated by SDS-PAGE [55].
To pre-purify samples for MS/MS, 200 µg of proteins was loaded onto a SDS-PAGE but the separation was stopped after the proteins entered approximately 5 mm into the separation gel. The gel slices containing the entered proteins were digested with trypsin to obtain
peptides [24].
Peptides were analyzed by LC–MS/MS using an Ulti-Mate 3000 RSLCnano splitless liquid chromatography
system, coupled online to an Orbitrap Elite™ Hybrid Ion
Trap-Orbitrap MS (both from Thermo Fisher Scientific, Bremen, Germany). After injection, peptides were loaded isocratically on a trap column (Dionex Acclaim, nano
trap column, 100 μm i.d. × 2 cm, PepMap100 C18, 5 μm,
100 Å, nanoViper) with a flow rate of 7 μL/min chroma-tographic liquid phase A (98 % LC–MS Water, 2 % ACN, 0.05 % TFA) for desalting and concentration.
Chromatographic separation was performed on a Dionex Acclaim PepMap C18 RSLC nano reversed phase column (2 μm particle size, 100 Å pore size, 75 μm inner diameter and 250 mm length) at 40 °C column temperature. A flow rate of 300 nL/min was applied using a binary A/B-solvent gradient (solvent A: 98 % LC–MS Water, 2 % acetonitrile, 0.1 % formic acid; sol-vent B: 80 % acetonitrile, 10 % LC–MS Water, 10 % tri-fluorethanol, 0.1 % formic acid) starting with 4 % B for
4 min, continuing with a linear increase to 55 % B within 120 min, followed by a column wash with 90 % B for 5 min and a re-adjusted with 4 % B for 25 min. For MS acquisition, a data-dependent MS/MS method was cho-sen. For the conducted measurements, MS was operated in positive ion mode, and precursor ions were acquired in the orbital trap of the hybrid MS at a resolution of 30,000 and an m/z range of 350–2000. Subsequently, the frag-ment ion scan was proceeded in the linear ion trap of the hybrid MS with a mass range and a scan rate with “nor-mal” parameter settings for the top 20 most intense pre-cursors selected for collision-induced dissociation.
Data handling
The MS results were processed by the Proteome Dis-coverer Software 1.4 (Thermo Fisher Scientific, Bremen, Germany), and were exported as Mascot generic format
(.mgf). For data storing and database search with the MASCOT 2.5 software (Matrix Science, London,
Eng-land) [56], the mgf-files were imported into the
Protein-Scape software (Bruker Daltonics, Bremen, Deutschland, version 3.1.3.461). The following search parameters were applied: trypsin, one missed cleavage, monoisotopic mass, carbamidomethylation (cysteine) and oxidation
(methionine) as variable modifications, ±10 ppm
precur-sor and ±0.5 Da MS/MS fragment tolerance, 113C and
+2/+ 3 charged peptide ions, 1 % FDR (resp. Mascot
Score of 40 for Fig. 2). As protein database UniProtKB/
Swiss-Prot (version: 23.10.2014) [57] extended by seven
metagenomes [11, 15, 19, 20] was used. The results of
database search were submitted to PRIDE [58] with the
accession number PXD003526.
Mascot result files (.dat-files) were uploaded into an
extended version of the MPA Software [18] (https://
www.code.google.com/p/meta-proteome-analyzer/,
version 1.0.9) to add meta-information from the Uni-ProtKB/Swiss-Prot database concerning taxonomy and function (UniProtKB gs: biological process, Enzyme
Commission numbers (EC-number) [59] and KEGG
Orthology (KO) [60]). The extended version of the MPA
implements a BLAST search (NCBI-Blast-version 2.2.31
[61]) against the UniProtKB/Swiss-Prot database for
non-annotated sequences from metagenomes. The
Uni-ProtKB accession numbers of first hits (e value better
than 10^−4) were assigned to the hits from the
metage-nomes. Redundant protein identifications were grouped
by the UniRef50 Clusters [21] to the so-called
process profiles (UniProtKB keywords) of each BGP and their spectral abundance were exported as comma sepa-rated files.
Biostatistics
The software Matlab [The MathWorks GmbH, Ismaning, Germany, version 8.3.0.532 (R2014a)] was used with the statistic toolbox to identify correlations as well as pat-terns in the microbial community and its biological
func-tions (Additional files 20, 21, 22). First, fusion matrices
of the metaproteins resp. taxonomic orders or biological processes of all BGPs were generated. Second, unknown hits and contaminant keratin hits were excluded. Third, the abundances of spectra of metaproteins from each BGP were normalized to 100 % of the total number of spectra of that BGP. Finally, all matrices were filtered for entries, which were present in at least one BGP sample with at least 1 % of the spectra.
These matrices were used to investigate the similarity of the BGPs based on a hierarchical clustering analysis. The results are shown as clustered heat map (Matlab: “clus-tergram” (“Bioinformatics Toolbox”), distance “average”,
linkage “euclidian” + Matlab
“PermTest_cluster_com-parison”, number of replications “1000”, for bootstrapping
[22]) and as PCA [Matlab: “pca” (“Statistics and machine
learning toolbox”)].
The correlations of all variables with each other and with the process parameters were analyzed by the “corr”-function (Matlab “Statistics Toolbox”)
apply-ing the Spearman’s rank and p values of 0.05 and 0.01,
respectively. For visualization of correlations, a graph network was created based on correlations between the taxonomic orders and process parameters using Gephi
(version: 0.8.2.beta) [62] and the force atlas algorithm
(autostab strength “2000”, repulsion strength “1000”, attraction strength “1”, gravity “100”, attraction distrib. “checked”).
For the search of potential markers for high and low process parameters on the level of metaproteins, taxo-nomic orders or biological processes, decision tree learn-ing was applied [Matlab: “classregtree” (“Statistics and machine learning toolbox”)]. Therefore, the BGPs were classified in BGPs with high resp. low values of each pro-cess parameter and the decision tree algorithm was used to propose marker metaproteins, taxonomic orders or biological processes which explained the classification of the BGPs. Finally, the performance of the decision tree learning was investigated by randomly splitting the data-set into two subdata-sets for training (60 %) and testing (40 %). The community indices evenness and richness were calculated based on 1 % order profiles with in-house
excel sheets (Additional file 23) [25–27].
Additional files
Additional file 1: Tables S1 and S2. S1: Process parameters of the analyzed BGPs. Different substrate types marked by the different colors (green: agricultural substrates, orange: industrial waste, purple: slaughter house waste, blue: sewage sludge, red: municipal waste, grey: mixed/ unknown substrates. The column labeled with “Name*” corresponds to the BGP names in De Vrieze et al. [1]. S2: Correlations between process parameters visualized as generalized plot matrix [63].
Additional file 2: Figure S1. 12 % SDS-PAGE of all 40 BGPs loaded with 200 µg of proteins and stained with colloidal coomassie.
Additional file 3: Figure S2. Number of identified spectra for each BGP (average of triplicates). Each sample was searched against UniProtKB/ Swiss-Prot and UniProtKB/Swiss-Prot including several metagenomes, applying a Mascot score of 40 and a FDR of 1 %.
Additional file 4: Figure S3. Application of different cut-offs for metaprotein, taxonomic order and biological process matrices. In addition the average cumulative sum of identified spectra is shown for different cut-offs.
Additional file 5. Detailed description of protein identifications and list of all metaproteins, orders and biological processes.
Additional file 6: Tables S1, S2 and S3. S1: List of all identified metaproteins. S2: List of all identified taxonomic orders. S3: List of all identified biological processes.
Additional file 7: Tables S1 and S2. S1: Matrix of all correlations with a cut-off of 0.01. S2: Matrix of all correlations with a cut-off of 0.05. Additional file 8: Figure S1. Loading Plots for the PCAs shown in Fig. 2. Additional file 9: Tables S1, S2 and S3. S1: Microbial orders for the four main groups of BGPs, namely mesophile and thermophile BGPs, UASB reactors and sewage sludge BGPs. S2: Biological functions of the four main groups of BGPs, namely mesophile and thermophile BGPs, UASB reactors and sewage sludge BGPs. S3: Metaproteins of the four main groups of BGPs, namely mesophile and thermophile BGPs, UASB reactors and sew-age sludge BGPs.
Additional file 10: Figure S1. Carbon metabolism at high tempera-tures. Assignment of identified microbial proteins to the KEGG map 1200 (carbon metabolism) positively correlated with high temperature (green: Archaea, red: Bacteria, purple: Archaea or Bacteria).
Additional file 11: Figure S2. Carbon metabolism at low tempera-tures. Assignment of identified microbial proteins to the KEGG map 1200 (carbon metabolism) negatively correlated with high temperature (green: Archaea, red: Bacteria, purple: Archaea or Bacteria).
Additional file 12: Figure S3. Carbon metabolism at high TAN. Assign-ment of identified microbial proteins to the KEGG map 1200 (carbon metabolism) positively correlated with high TAN (green: Archaea, red: Bacteria, purple: Archaea or Bacteria).
Additional file 13: Figure S4. Carbon metabolism at low TAN. Assign-ment of identified microbial proteins to the KEGG map 1200 (carbon metabolism) negatively correlated with high TAN (green: Archaea, red: Bacteria, purple: Archaea or Bacteria).
Additional file 14: Figure S5. Carbon metabolism at high OLR. Assign-ment of identified microbial proteins to the KEGG map 1200 (carbon metabolism) positively correlated with high OLR (green: Archaea, red: Bacteria, purple: Archaea or Bacteria).
Additional file 15: Figure S6. Carbon metabolism at low OLR. Assign-ment of identified microbial proteins to the KEGG map 1200 (carbon metabolism) negatively correlated with high OLR (green: Archaea, red: Bacteria, purple: Archaea or Bacteria).
Abbreviations
BGP(s): biogas plant(s); CID: collision induced dissociation; COD: chemical oxygen demand; CSTR: continuously stirred tank reactor; FDR: false discovery rate; EC-number: Enzyme Commission number; FA: free ammonia; GAPD: glyceraldehyde-3-phosphate dehydrogenase; H4MPT:
tetrahydromethanop-terin; KO: KEGG orthology; LC: liquid chromatography; MCR: methyl-coenzyme M reductase; mgf: mascotgeneric file; MPA: MetaProteomeAnalyzer; MS: mass spectrometry/mass spectrometer; MS/MS: tandem mass spectrometry/tan-dem mass spectrometer; PCA: principal component analysis; PCR: polymerase chain reaction; OLR: organic loading rate; SAO: syntrophic acetate oxidation; SDS-PAGE: sodium dodecyl sulfate polyacrylamide gel electrophoresis; SRT: sludge retention time; TAN: total ammonia nitrogen; TS: total solids; UASB: upflow anaerobic sludge blanket reactor; VFA: volatile fatty acids; VS: volatile solids.
Authors’ contributions
RH performed the metaproteome analysis and evaluated the data together with DB as well as FK. JD and NB collected the BGP samples, and analyzed the process parameters. The metagenomes were provided by AS and AS. UR, MH and ER supported analysis and interpretation of data and critical revision of manuscript. All the authors contributed to the writing of the manuscript. All authors read and approved the final manuscript.
Author details
1 Bioprocess Engineering, Max Planck Institute for Dynamics of Complex
Technical Systems, Sandtorstraße 1, 39106 Magdeburg, Germany. 2 Bioprocess
Engineering, Otto von Guericke University Magdeburg, Universitätsplatz 2, 39106 Magdeburg, Germany. 3 Laboratory of Microbial Technology and
Ecol-ogy (LabMET), Ghent University, Coupure Links 653, 9000 Ghent, Belgium.
4 Center for Biotechnology, Genome Research of Industrial Microorganisms,
Universität Bielefeld, Universitätsstraße 25, 33615 Bielefeld, Germany. 5 Center
for Biotechnology, Computational Metagenomics, Universität Bielefeld, Univer-sitätsstr. 25, 33615 Bielefeld, Germany.
Acknowledgements
The authors thank C. Siewert and T. Lacoere for their valuable technical support.
Competing interests
The authors declare that they have no competing interests.
Availability of data and material
Proteome data were stored on Pride with the accession number PXD003526.
Funding
R. Heyer was supported by the German Environmental Foundation (DBU, Grant number 20011/136) and the German Academic Exchange Service (DAAD, Grant number 91529326, support program 2014/15-57044987. J. De Vrieze and Nico Boon were supported by a Grant of the Geconcentreerde Onderzoeksactie (GOA) of Ghent University (BOF09/GOA/005) and the Inter-University Attraction Pole (IUAP) ‘m-manager’, funded by the Belgian Science Policy (BELSPO, 305 P7/25) J. De Vrieze was also supported by the Research Foundation—Flanders (FWO).
Received: 4 February 2016 Accepted: 12 July 2016
References
1. De Vrieze J, Saunders AM, He Y, Fang J, Nielsen PH, Verstraete W, et al. Ammonia and temperature determine potential clustering in the anaero-bic digestion microbiome. Water Res. 2015;75:312–23. doi:10.1016/j. watres.2015.02.025.
2. Fachagentur Nachwachsende Rohstoffe e.V. Basisdaten Bioenergie. 2015. https://mediathek.fnr.de/basisdaten-bioenergie.html. Accessed 15 Jan 2016.
3. Stams AJM, Plugge CM. Electron transfer in syntrophic communities of anaerobic bacteria and archaea. Nat Rev Microbiol. 2009;7(8):568–77. doi:10.1038/nrmicro2166.
4. Bagi Z, Acs N, Balint B, Horvath L, Dobo K, Perei KR, et al. Biotechnologi-cal intensification of biogas production. Appl Microbiol Biotechnol. 2007;76(2):473–82. doi:10.1007/s00253-007-1009-6.
5. Theuerl S, Kohrs F, Benndorf D, Maus I, Wibberg D, Schluter A, et al. Com-munity shifts in a well-operating agricultural biogas plant: how process variations are handled by the microbiome. Appl Microbial Biotechnol. 2015;99(18):7791–803. doi:10.1007/s00253-015-6627-9.
6. Lucas R, Kuchenbuch A, Fetzer I, Harms H, Kleinsteuber S. Long-term monitoring reveals stable and remarkably similar microbial communi-ties in parallel full-scale biogas reactors digesting energy crops. FEMS Microbiol Ecol. 2015;91(3):fiv004. doi:10.1093/femsec/fiv004. 7. Leven L, Eriksson ARB, Schnurer A. Effect of process temperature on
bacterial and archaeal communities in two methanogenic bioreactors treating organic household waste. FEMS Microbiol Ecol. 2007;59(3):683– 93. doi:10.1111/j.1574-6941.2006.00263.x.
8. De Vrieze J, Verstraete W, Boon N. Repeated pulse feeding induces func-tional stability in anaerobic digestion. Microb Biotechnol. 2013;6(4):414– 24. doi:10.1111/1751-7915.12025.
9. Werner JJ, Knights D, Garcia ML, Scalfone NB, Smith S, Yarasheski K, et al. Bacterial community structures are unique and resilient in full-scale bioenergy systems. Proc Natl Acad Sci USA. 2011;108(10):4158–63. doi:10.1073/pnas.1015676108.
10. Ziganshin AM, Liebetrau J, Proter J, Kleinsteuber S. Microbial community structure and dynamics during anaerobic digestion of various agricul-tural waste materials. Appl Microbiol Biotechnol. 2013;97(11):5161–74. doi:10.1007/s00253-013-4867-0.
11. Schlüter A, Bekel T, Diaz NN, Dondrup M, Eichenlaub R, Gartemann KH, et al. The metagenome of a biogas-producing microbial community of a production-scale biogas plant fermenter analysed by the 454-pyrose-quencing technology. J Biotechnol. 2008;136(1–2):77–90. doi:10.1016/j. jbiotec.2008.05.008.
12. Zakrzewski M, Goesmann A, Jaenicke S, Junemann S, Eikmeyer F, Szc-zepanowski R, et al. Profiling of the metabolically active community from a production-scale biogas plant by means of high-throughput metatran-scriptome sequencing. J Biotechnol. 2012;158(4):248–58. doi:10.1016/j. jbiotec.2012.01.020.
Additional file 17: Figure S8. Carbon metabolism at low SRT. Assign-ment of identified microbial proteins to the KEGG map 1200 (carbon metabolism) negatively correlated with high SRT (green: Archaea, red: Bacteria, purple: Archaea or Bacteria).
Additional file 18: Table S1. Potential markers of process conditions identified by decision tree learning. The classification errors as well as the correlations to process parameters are shown (cut-off 5 %, Spearman’s rank, p value 0.01).
Additional file 19: Figure S1. Workflow.
Additional file 20. Matlab files for the statistical data evaluation. In order to execute the statistical data evaluation run the file “Additional_File_20_ Start_Data_Analysis.m”. After that you have to select subsequently all files for the taxonomic orders (“Additional_Files_20_Taxonomic_Order_ UniRef50_allSpecies_GentXXx.csv”), biological processes (“Additional_ Files_20_Gent_Biological_Process_UniRef50_allSpecies_GentXXx.csv”) as well metaproteins (“Additional_Files_20_Gent_Metaproteins_UniRef50_ allSpecies_GentXXx.m”).
Additional file 21. Analogous, decision tree learning can be execute by running the file “Additional_File_21_Start_DecissionTrees.m” and selecting the desired taxonomy matrix (“Additional_Files_21_Taxo-nomic_Order_Learning”), biological process matrix (“Additional_ Files_21_Biological_Processes_Learning”) or metaprotein matrix (“Additional_Files_21_Metaprotein_Learning”).
Additional file 22. Summary.
13. Heyer R, Kohrs F, Reichl U, Benndorf D. Metaproteomics of com-plex microbial communities in biogas plants. Microb Biotechnol. 2015;8(5):749–63. doi:10.1111/1751-7915.12276.
14. Vanwonterghem I, Jensen PD, Ho DP, Batstone DJ, Tyson GW. Linking microbial community structure, interactions and function in anaero-bic digesters using new molecular techniques. Curr Opin Biotechnol. 2014;27:55–64. doi:10.1016/j.copbio.2013.11.004.
15. Hanreich A, Schimpf U, Zakrzewski M, Schlüter A, Benndorf D, Heyer R, et al. Metagenome and metaproteome analyses of microbial communi-ties in mesophilic biogas-producing anaerobic batch fermentations indicate concerted plant carbohydrate degradation. Syst Appl Microbiol. 2013;36(5):330–8. doi:10.1016/j.syapm.2013.03.006.
16. Ong SH, Kukkillaya VU, Wilm A, Lay C, Ho EX, Low L, et al. Species identi-fication and profiling of complex microbial communities using shotgun illumina sequencing of 16S rRNA amplicon sequences. PLoS One. 2013;8(4):e60811. doi:10.1371/journal.pone.0060811.
17. Gonzalez JM, Portillo MC, Belda-Ferre P, Mira A. Amplification by PCR artificially reduces the proportion of the rare biosphere in microbial com-munities. PLoS One. 2012;7(1):e29973. doi:10.1371/journal.pone.0029973. 18. Muth T, Behne A, Heyer R, Kohrs F, Benndorf D, Hoffmann M, et al.
The MetaProteomeAnalyzer: a powerful open-source software suite for metaproteomics data analysis and interpretation. J Proteome Res. 2015;14(3):1557–65. doi:10.1021/pr501246w.
19. Joint Genome Institute PI. http://genome.jgi.doe.gov/BioPla1DNA1/BioP-la1DNA1.info.html. Proposal ID 1053. 2015. Accessed 15 Jan 2016. 20. Rademacher A, Zakrzewski M, Schlüter A, Schonberg M,
Szc-zepanowski R, Goesmann A, et al. Characterization of microbial biofilms in a thermophilic biogas system by high-throughput metagenome sequencing. FEMS Microbiol Ecol. 2012;79(3):785–99. doi:10.1111/j.1574-6941.2011.01265.x.
21. Suzek BE, Huang HZ, McGarvey P, Mazumder R, Wu CH. UniRef: compre-hensive and non-redundant UniProt reference clusters. Bioinformatics. 2007;23(10):1282–8. doi:10.1093/bioinformatics/btm098.
22. Pinelli C, Rastogi RK, Scandurra A, Jadhao AG, Aria M, D’Aniello B. A com-parative cluster analysis of nicotinamide adenine dinucleotide phosphate (NADPH)-diaphorase histochemistry in the brains of amphibians. J Comp Neurol. 2014;522(13):2980–3003. doi:10.1002/cne.23561.
23. Heyer R, Kohrs F, Benndorf D, Rapp E, Kausmann R, Heiermann M, et al. Metaproteome analysis of the microbial communities in agri-cultural biogas plants. N Biotechnol. 2013;30(6):614–22. doi:10.1016/j. nbt.2013.01.002.
24. Kohrs F, Heyer R, Magnussen A, Benndorf D, Muth T, Behne A, et al. Sample prefractionation with liquid isoelectric focusing enables in depth microbial metaproteome analysis of mesophilic and thermophilic biogas plants. Anaerobe. 2014;29:59–67. doi:10.1016/j.anaerobe.2013.11.009. 25. Marzorati M, Wittebolle L, Boon N, Daffonchio D, Verstraete W.
How to get more out of molecular fingerprints: practical tools for microbial ecology. Environ Microbiol. 2008;10(6):1571–81. doi:10.1111/j.1462-2920.2008.01572.x.
26. Mertens B, Boon N, Verstraete W. Stereospecific effect of hexachlorocy-clohexane on activity and structure of soil methanotrophic communities. Environ Microbiol. 2005;7(5):660–9. doi:10.1111/j.1462-2920.2004.00735.x. 27. Wittebolle L, Marzorati M, Clement L, Balloi A, Daffonchio D, Heylen K,
et al. Initial community evenness favours functionality under selective stress. Nature. 2009;458(7238):623–6. doi:10.1038/nature07840. 28. Shade A, Handelsman J. Beyond the Venn diagram: the hunt
for a core microbiome. Environ Microbiol. 2012;14(1):4–12. doi:10.1111/j.1462-2920.2011.02585.x.
29. Kim YS, Westerholm M, Scherer P. Dual investigation of metha-nogenic processes by quantitative PCR and quantitative micro-scopic fingerprinting. FEMS Microbiol Lett. 2014;360(1):76–84. doi:10.1111/1574-6968.12592.
30. Batstone DJ, Keller J, Angelidaki I, Kalyuzhnyi SV, Pavlostathis SG, Rozzi A, et al. The IWA anaerobic digestion model no 1 (ADM1). Water Sci Technol. 2002;45(10):65–73.
31. Stolze Y, Zakrzewski M, Maus I, Eikmeyer F, Jaenicke S, Rottmann N, et al. Comparative metagenomics of biogas-producing microbial communi-ties from production-scale biogas plants operating under wet or dry fermentation conditions. Biotechnol Biofuels. 2015;8:14. doi:10.1186/ s13068-014-0193-8.
32. Acinas SG, Marcelino LA, Klepac-Ceraj V, Polz MF. Divergence and redun-dancy of 16S rRNA sequences in genomes with multiple rrn operons. J Bacteriol. 2004;186(9):2629–35.
33. Karakashev D, Batstone DJ, Trably E, Angelidaki I. Acetate oxidation is the dominant methanogenic pathway from acetate in the absence of Metha-nosaetaceae. Appl Environ Microbiol. 2006;72(7):5138–41. doi:10.1128/ Aem.00489-06.
34. Liu YC, Whitman WB. Metabolic, phylogenetic, and ecological diversity of the methanogenic archaea. Ann NY Acad Sci. 2008;1125:171–89. doi:10.1196/annals.1419.019.
35. Brenner D, Krieg N, Staley J. Bergey’s manual® of systematic bacteriology. The proteobacteria part C: the alpha-, beta-, delta-, and epsilonproteo-bacteria, vol 2. US: Springer ; 2005.
36. Nettmann E, Bergmann I, Pramschufer S, Mundt K, Plogsties V, Herrmann C, et al. Polyphasic analyses of methanogenic archaeal communities in agricultural biogas plants. Appl Environ Microbiol. 2010;76(8):2540–8. doi:10.1128/Aem.01423-09.
37. Kuhn R, Benndorf D, Rapp E, Reichl U, Palese LL, Pollice A. Metaproteome analysis of sewage sludge from membrane bioreactors. Proteomics. 2011;11(13):2738–44. doi:10.1002/pmic.201000590.
38. Püttker S, Kohrs F, Benndorf D, Heyer R, Rapp E, Reichl U. Metaproteomics of activated sludge from a wastewater treatment plant—a pilot study. Proteomics. 2015;. doi:10.1002/pmic.201400559.
39. Kohrs F, Wolter S, Benndorf D, Heyer R, Hoffmann M, Rapp E, et al. Fractionation of biogas plant sludge material improves metaproteomic characterization to investigate metabolic activity of microbial communi-ties. Proteomics. 2015;. doi:10.1002/pmic.201400557.
40. Lu F, Bize A, Guillot A, Monnet V, Madigou C, Chapleur O, et al. Metapro-teomics of cellulose methanisation under thermophilic conditions reveals a surprisingly high proteolytic activity. ISME J. 2014;8(1):88–102. doi:10.1038/ismej.2013.120.
41. Bremges A, Maus I, Belmann P, Eikmeyer F, Winkler A, Albersmeier A, et al. Deeply sequenced metagenome and metatranscriptome of a biogas-producing microbial community from an agricultural production-scale biogas plant. Gigascience. 2015;4:33. doi:10.1186/ s13742-015-0073-6.
42. Campanaro S, Treu L, Kougias PG, De Francisci D, Valle G, Angelidaki I. Metagenomic analysis and functional characterization of the biogas micro-biome using high throughput shotgun sequencing and a novel binning strategy. Biotechnol Biofuels. 2016;9:26. doi:10.1186/s13068-016-0441-1. 43. Pierce E, Xie G, Barabote RD, Saunders E, Han CS, Detter JC, et al.
The complete genome sequence of Moorella thermoacetica (f. Clostridium thermoaceticum). Environ Microbiol. 2008;10(10):2550–73. doi:10.1111/j.1462-2920.2008.01679.x.
44. Okamura-Ikeda K, Fujiwara K, Motokawa Y. Mechanism of the glycine cleavage reaction. Properties of the reverse reaction catalyzed by T-protein. J Biol Chem. 1987;262(14):6746–9.
45. Gunnigle E, Siggins A, Botting CH, Fuszard M, O’Flaherty V, Abram F. Low-temperature anaerobic digestion is associated with differential metha-nogenic protein expression. FEMS Microbiol Lett. 2015;362(10):fnv059. doi:10.1093/femsle/fnv059.
46. Müller B, Sun L, Schnurer A. First insights into the syntrophic acetate-oxidizing bacteria—a genetic study. Microbiologyopen. 2013;2(1):35–53. doi:10.1002/mbo3.50.
47. Kovacs E, Wirth R, Maroti G, Bagi Z, Rakhely G, Kovacs KL. Biogas produc-tion from protein-rich biomass: fed-batch anaerobic fermentaproduc-tion of casein and of pig blood and associated changes in microbial com-munity composition. PLoS One. 2013;8(10):e77265. doi:10.1371/journal. pone.0077265.
48. Archer DB, Powell GE. Dependence of the specific growth rate of metha-nogenic mutualistic cocultures on the methanogen. Arch Microbiol. 1985;141(2):133–7.
49. Huber R, Hannig M. Thermotogales. In: Dworkin M, Falkow S, Rosenberg E, Schleifer KH, Stackebrandt E, editors. The prokaryotes, vol. 7. 3rd ed. Berlin: Springer; 2006. p. 899–922.
50. Munk B, Bauer C, Gronauer A, Lebuhn M. A metabolic quotient for metha-nogenic Archaea. Water Sci Technol. 2012;66(11):2311–7. doi:10.2166/ wst.2012.436.