VOLUME 41, ARTICLE 13, PAGES 367
-
392
PUBLISHED 26 JULY 2019
https://www.demographic-research.org/Volumes/Vol41/13/ DOI: 10.4054/DemRes.2019.41.13
Research Article
Subnational population forecasts:
Do users want to know about uncertainty?
Tom Wilson
Fiona Shalley
© 2019 Tom Wilson & Fiona Shalley.
This open-access work is published under the terms of the Creative Commons Attribution 3.0 Germany (CC BY 3.0 DE), which permits use, reproduction, and distribution in any medium, provided the original author(s) and source are given credit.
1 Introduction 368
2 Data and methods 370
3 Findings 372
3.1 Overview of online survey forecast users 372
3.2 Do users of population forecasts want to know about forecast uncertainty?
374
3.3 Do users understand forecast uncertainty concepts? 376 3.4 How do users want to receive information on forecast populations
and uncertainty?
380
3.5 Would the concept of a forecast shelf life assist in understanding uncertainty?
383
4 Discussion 385
4.1 Demand for forecast uncertainty information 385
4.2 The modelling challenge 386
4.3 The communication challenge 386
4.4 Limitations 388
4.5 Concluding remarks 388
5 Acknowledgments 388
Subnational population forecasts:
Do users want to know about uncertainty?
Tom Wilson1 Fiona Shalley2
Abstract
BACKGROUND
Subnational population forecasts form a key input to many significant investment and planning decisions, but these forecasts are often subject to considerable amounts of uncertainty, even in the short run. This uncertainty is rarely quantified at the subnational scale, and little attention has been given to how uncertainty can be effectively communicated to users.
OBJECTIVE
We wished to find out if users of subnational population forecasts want to know about forecast uncertainty, their understanding of uncertainty, and their views on various methods of communicating it.
METHODS
An online survey of users of population forecasts in Australia was undertaken, followed by focus groups to permit in-depth discussions of forecasting and uncertainty topics.
RESULTS
Nine out of ten survey respondents wanted uncertainty information. The majority also understood basic uncertainty concepts, although about one-third did not currently use any uncertainty information. Several demographic terms for populations and uncertainty were found to be confusing to users.
CONCLUSIONS
Discovering that uncertainty information is desired by most users is an encouraging finding. Further work is required to create fully developed models for doing so. Learning how users interpret various means of expressing uncertainty helps in designing more effective communication tools.
CONTRIBUTION
The paper makes an original contribution to the forecast uncertainty literature through its focus on forecast users. We present the results of a recent survey and focus groups of subnational population forecast users in Australia which asked for their views on forecast uncertainty.
1. Introduction
Subnational population forecasts are used by governments and the business sector for a variety of purposes, including service delivery, infrastructure requirements, workforce planning, site selection, and market assessments. They inform important and often multimillion dollar decisions, such as whether to build a new school, upgrade a sewage treatment plant, open a new department store, find land for a new cemetery, build a new metro line, or construct a new aged care facility.
But subnational population forecasts can prove to be quite inaccurate, as a number of studies have demonstrated. A recent evaluation of 30 years of local government area population forecasts in Australia found the median absolute percentage error to be 5.4% after ten years for local areas as a whole but much greater for the smallest populations, such as 13.3% for areas with under 1,000 people at the start of the forecasts (Wilson et al. 2018). That study found that forecast error tends to increase as population size decreases and generally increases the further into the future the forecasts extend, findings common to many forecast evaluation studies (e.g., Rayer 2008; Rayer and Smith 2014; Statistics New Zealand 2008; Tayman 2011; Yamauchi, Koike, and Kamata 2017). Some researchers have found a U-shaped relationship between error and base period growth rates (e.g., Rayer and Smith 2010) and a positive association with the volatility of net migration (e.g., Wilson 2012). As a general rule, forecast errors for subnational areas substantially exceed those at the national scale.
are being made freely available in software packages (e.g., Ševčíková and Raftery 2012).
However, there are three ways in which we believe this body of work on probabilistic forecasting and uncertainty could be developed further. First, the bulk of research on probabilistic forecasting has been confined to the national scale. But it is at the subnational scale that the need for warnings about forecast uncertainty is much greater because errors are larger. Only a handful of case studies of subnational population forecasts with prediction intervals exist (e.g., Lee, Miller, and Edwards 2003; Rayer, Smith, and Tayman 2009; Rees and Turton 1998; Simpson, Wilson, and Shalley 2018; Wilson 2013; Wisniowski and Raymer 2016). There is a pressing need for more work on the development of methods and software for quantifying the uncertainty of subnational population forecasts.
Second, prediction intervals in population forecasts have not been widely adopted outside the academic sector. It is certainly significant that Statistics New Zealand and Statistics Netherlands have switched to probabilistic population forecasts (Statistics New Zealand 2016; Statistics Netherlands 2017), and in recent years the United Nations Population Division has published population forecasts for most countries of the world with probabilistic fertility and mortality inputs (UN 2019). But measures of forecast uncertainty remain rare in population forecasts published by national and regional statistical agencies and those produced by the private sector. There is clearly reluctance on the part of statistical offices and other producers to prepare population forecasts which are accompanied by prediction intervals. Reasons may include an aversion to probabilistic thinking, a concern that wide prediction intervals may give the impression of incompetence, a view that current probabilistic methods need further development before they are suitable for real-world implementation, the perceived lack of interest from users, or perhaps the complexity, advanced statistical skills, staff costs, and time required to implement probabilistic methods.
The third issue – and the primary focus of this paper – concerns users’ opinions and requirements about uncertainty. We were particularly interested in the following questions:
(1) Do users of population forecasts want to know about forecast uncertainty?
If so:
(2) Do they understand forecast uncertainty concepts?
(4) Would the concept of a forecast ‘shelf life’ assist in understanding uncertainty?
Unlike other disciplines, notably meteorology (e.g., Joslyn and Savelli 2010; Morss, Demuth, and Lazo 2008; World Meteorological Organisation 2008), there has been relatively little engagement with end users of population forecasts to ascertain their views on measures of uncertainty and how they interpret them (but see Dunstan and Ball 2016; UNECE 2018). Answers to these questions should prove informative in guiding the development of approaches to communicating population forecast uncertainty and the extent to which effort needs to be put into persuading users of the value of uncertainty measures.
This paper addresses the questions above on users’ views about forecast uncertainty. It presents the findings of an online survey of users of subnational population forecasts in Australia, supplemented by focus groups. The survey instruments and data collected are described in Section 2 of the paper. Findings are summarised in Section 3. Section 4 discusses the results and their implications for demographic modelling and the way in which the uncertainty of subnational population forecasts is communicated to users. The paper finishes with some concluding remarks.
2. Data and methods
Australian users’ views and understanding of population forecast uncertainty were obtained through an online survey and follow-up focus groups which explored ideas in greater depth. Ethics approval was obtained from the Charles Darwin University Human Research Ethics Committee.
going live, five rounds of survey testing occurred using a small number of test participants, with improvements implemented after each cycle.
The survey was administered through SurveyMonkey and was open for a two-month period from 5 February 2018. It was publicised through Charles Darwin University’s social media feeds, including those advertising the 2018 Australian Population Association conference. A survey link was circulated to networks of known user groups, including state and territory government department client groups and population projection advisory groups, academics working in the areas of demography and planning, local government associations, business groups, and private consultants/analysts. No incentives or payments were provided. A total of 82 responses were received, with an average completion time of around 20 minutes. The only compulsory questions were associated with consent, and not all respondents answered all non-compulsory questions. Although convenience sampling was used, respondents came from all Australian states and territories and the occupation sectors of government, business, private research, and academia. The sample is probably biased towards those with an interest in uncertainty information, and we do not suggest that it is fully representative of the population forecast user community.
The main aim of the focus groups was to gain a more in-depth understanding of the topics covered in the online survey and to allow longer and more nuanced responses to questions. In particular we were interested to learn more about how people used population forecasts, how they understood the language used to communicate uncertainty, and how they reacted to different uncertainty concepts and data visualisations of prediction intervals. The discussion was guided by a series of key questions, with additional follow-up questions asked as appropriate. A handout of graphs and population forecasting definitions relating to the key questions was given to each of the participants. Nineteen individuals participated in three focus groups held during May 2018, lasting from one to two hours. The two largest focus groups were conducted in person in Darwin and Sydney, whilst the third was conducted by Skype. All focus group discussions were recorded and transcribed later.
Survey results were analysed using simple tables and graphs showing numbers and percentages of responses by category to survey questions. A more sophisticated statistical analysis was avoided given the small sample size and non-representative nature of the survey. Write-in responses are quoted in the paper where relevant. Key themes from focus group transcripts were identified, and selected quotes from participants which summarise views and responses are reported in the paper. Issues which provoked a range of views were noted, as were concepts and terms which were unclear to some users.
term population projection is widely used in Australia to mean forecast, we chose to use this term in the online survey and focus groups, and we use ‘projection’ and ‘forecast’ interchangeably in this paper.
3. Findings
3.1 Overview of online survey forecast users
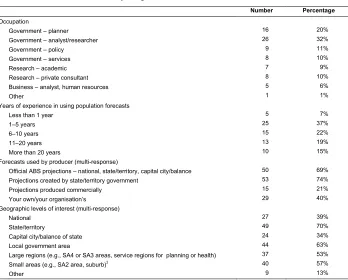
Table 1 provides an overview of respondents in the online survey, the type of population forecasts used, and the broad reasons for using them. More than half of the survey respondents worked for state or territory governments (55%), with the remaining number employed by local or federal government (10% and 8%), universities (11%), and private research and/or business industry groups (15%). As such, there was a predominance of respondents working in government analysis, research, or policy and service delivery. Others worked in research (as academics or consultants) or in business (as analysts or in human resources).
In terms of experience in using forecasts, just over a third of respondents had between one and five years of experience (37%) and another third had over ten years of experience (34%). About a fifth (22%) had been using population forecasts between six and ten years, with the remaining respondents having less than one year of experience (7%). In regards to usage, 40% regularly used population forecasts in their work (once a month or more frequently) while the remainder were occasional users. The majority of respondents made use of population forecasts produced by state and territory governments (74%) and those published by the Australian Bureau of Statistics (69%). About 40% used forecasts produced by their own organisations, while 21% made use of commercially produced forecasts.
Forecasts across a wide variety of geographic levels were used. The state/territory scale was the most common response (70%), though many also used forecasts for local government areas (63%) or even smaller areas (57%) and larger regions (53%) (defined as those consisting of more than one local government area). Fewer used national level forecasts (39%) or those for capital city/balance of state/territory (34%). Three respondents said that they used forecasts for very small areas or aggregations of these.
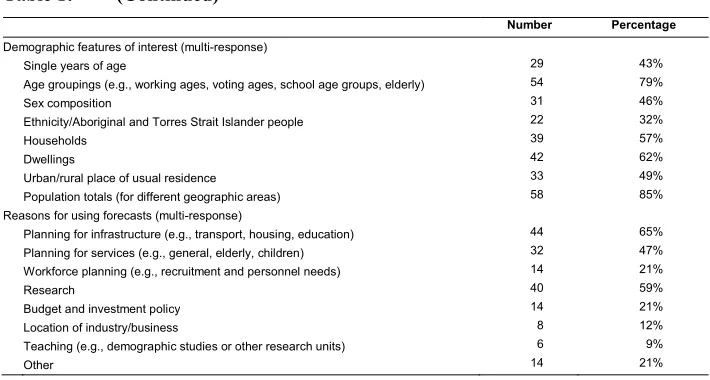
The uses of population forecasts were varied, as shown in the bottom panel of Table 1. Planning for infrastructure (65%) and planning for services (47%) were common uses, as was research (59%). Workforce planning and budget and investment policy were both used by 21% of respondents, while a smaller proportion made use of them for business location decisions (12%) and teaching (9%).
Table 1: Profile of survey respondents
Number Percentage
Occupation
Government – planner 16 20% Government – analyst/researcher 26 32%
Government – policy 9 11%
Government – services 8 10%
Research – academic 7 9%
Research – private consultant 8 10% Business – analyst, human resources 5 6%
Other 1 1%
Years of experience in using population forecasts
Less than 1 year 5 7%
1–5 years 25 37%
6–10 years 15 22%
11–20 years 13 19%
More than 20 years 10 15%
Forecasts used by producer (multi-response)
Official ABS projections – national, state/territory, capital city/balance 50 69% Projections created by state/territory government 53 74% Projections produced commercially 15 21% Your own/your organisation’s 29 40% Geographic levels of interest (multi-response)
National 27 39%
State/territory 49 70%
Capital city/balance of state 24 34% Local government area 44 63% Large regions (e.g., SA4 or SA3 areas, service regions for planning or health) 37 53% Small areas (e.g., SA2 area, suburb)3 40 57%
Other 9 13%
Table 1: (Continued)
Number Percentage
Demographic features of interest (multi-response)
Single years of age 29 43% Age groupings (e.g., working ages, voting ages, school age groups, elderly) 54 79%
Sex composition 31 46%
Ethnicity/Aboriginal and Torres Strait Islander people 22 32%
Households 39 57%
Dwellings 42 62%
Urban/rural place of usual residence 33 49% Population totals (for different geographic areas) 58 85% Reasons for using forecasts (multi-response)
Planning for infrastructure (e.g., transport, housing, education) 44 65% Planning for services (e.g., general, elderly, children) 32 47% Workforce planning (e.g., recruitment and personnel needs) 14 21%
Research 40 59%
Budget and investment policy 14 21% Location of industry/business 8 12% Teaching (e.g., demographic studies or other research units) 6 9%
Other 14 21%
Source: Charles Darwin University Using Population Projections Survey 2018.
3.2 Do users of population forecasts want to know about forecast uncertainty?
In response to the key question on whether they would like data and information about population forecast uncertainty, 90% of survey respondents who answered the question (60 out of 67) replied yes. Only 7% responded no while 3% replied that they did not know. Reasons selected from the list of options for wanting information on uncertainty consisted of the need to emphasise the fact that forecasts are not exact (73% of respondents to the question), to aid decision-making based on a range of projected population numbers (58%), and to allow consideration of risk or contingency strategies (57%).
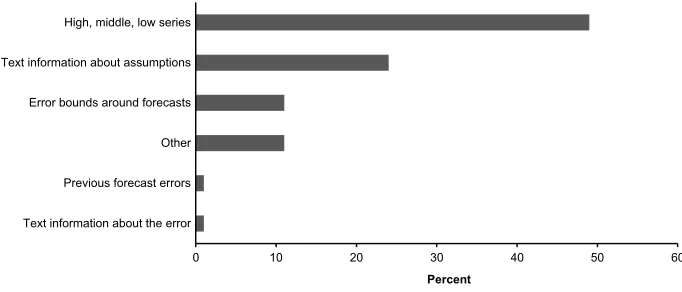
The survey also asked respondents if they currently made use of any information to provide guidance about forecast uncertainty: 61% replied yes and 30% no (with 9% responding that they did not know). Of those who said yes, the types of information drawn upon are shown in Figure 1. About half of respondents consult information on high, medium, and low variant projections, where high and low variants are created using alternative assumptions about fertility, migration, and sometimes mortality, which are judged by the forecaster to be high or low – all of these respondents were from the government sector, with most having more than five years of experience using population projections (63%). The reasons provided for using the high and low series indicated that respondents generally thought of them in terms of optimistic and pessimistic estimates or the “upper and lower range of possible combinations of outcomes.” Others thought that the high and low series assumed different levels of migration and replacement – “high = higher assumptions on net overseas migration and replacement rate … low = lower assumptions on net overseas migration and replacement rate.” Interestingly, about 10% of respondents reported using prediction intervals or error bounds around forecasts. These respondents were either government analysts or academics. Typically, half of these used the 95% prediction interval. About a quarter of respondents use text information about assumptions to take uncertainty into account. Only one respondent said that they used previous forecast error, applying them to “explain discrepancies.” In addition, it was clear that a number of respondents were confused about the terminology used in uncertainty information and felt it was too “mathematical.”
Figure 1: How users who currently take into account forecast uncertainty obtain information on it
Source: Charles Darwin University Using Population Projections Survey 2018.
0 10 20 30 40 50 60
High, middle, low series
Text information about assumptions
Error bounds around forecasts
Other
Previous forecast errors
Text information about the error
Focus group participants provided more nuanced discussion around the use of uncertainty information such as the high and low variants. Those dealing with small populations expected more volatility in future numbers: “Individual events can have a dramatic impact and influence on population. Therefore if you can’t update your figures after one of these events unfold then you are not able to adjust [for the impact] and you use a different scenario.” One participant was actively engaged in more “speculative” research that used types of sensitivity analysis and other population characteristics that were combined with the high/low variants, “so uncertainty is bundled together from all these sources.” In terms of using any type of bounds, participants appeared to feel more challenged by how to use them: “How do I translate this bound … [and] what does it mean for planning? Should we assume the upper bound is more likely? That’s why people stick to the middle because [they] can’t be accused of under or over investing.” Respondents also have low general confidence in understanding what they mean: “Very few people would be comfortable with it. Very few people draw insight from those figures.”
3.3 Do users understand forecast uncertainty concepts?
Ten questions in the online survey were used to assess respondents’ understanding of general uncertainty concepts associated with population forecasts. Four out of five respondents (80%) understood that uncertainty increased as the forecast horizon increases, and 75% recognised that uncertainty was greater for smaller geographical areas. The remaining understood these relationships incorrectly or did not know.
Most respondents (83%) knew that a principal projection was unlikely to be the exact population 30 years into the future and they were reasonably confident of their answer (average confidence rating of 76 out of 100). Similarly, most respondents (87%) could correctly identify the upper and lower limits of the 50% prediction interval from a table of labelled information, and overall they had higher levels of confidence in their answer (average confidence rating of 85 out of 100).
people thought the 95% prediction interval was even more likely to contain a future population (69%).
Understanding these uncertainty concepts appeared to be related to both occupation of the respondent and years of experience in using population forecasts (Figure 2). In response to the ten questions about uncertainty and prediction intervals, those working in the roles of academic or government research and government policy or planning provided more correct responses to the ten questions. Private consultants, business analysts, and those in government service roles generally answered fewer questions correctly. Nearly six in ten respondents with five years or less experience in using population forecasts responded correctly to five or more questions (57%) while three-quarters of those with more experience did so (76%).
Figure 2: Percentage of respondents by occupation who correctly answered five or more of ten questions on understanding uncertainty
Source: Charles Darwin University Using Population Projections Survey 2018.
The focus groups were used to discuss the understanding of prediction intervals in more detail. Discussion confirmed that people are using the high and low population projection series like prediction intervals. Although most agreed that prediction intervals were a better way of communicating an uncertain future, the concept was not easily understood: “Unless people are statistically minded then it is not appreciated enough. …Could easily fall into the trap of thinking they are similar.” Participants offered experiences that showed they do not necessarily want to deal with uncertainty all the time, rather they wanted to know that the ‘experts’ have dealt with it. Concepts
0 10 20 30 40 50 60 70 80 Research – academic
Government – analyst/researcher
Government – policy
Government – planner
Business – analyst
Government – services
Research – private consultant
such as forecast error and probability engendered an element of nervousness amongst some of the participants because they said ‘chance’ was difficult to understand.
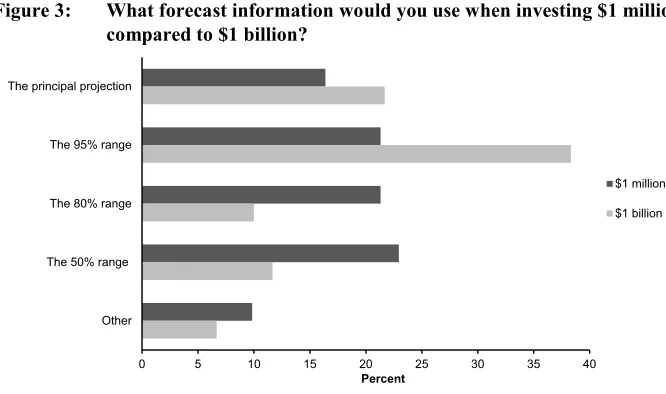
To understand if users make different judgements about uncertainty depending on the context we asked survey respondents about forecast uncertainty when faced with an investment of two very different amounts of money: $1 million and then $1 billion (Australian dollars). As the dollar investment increased we expected respondents to be more cautious about what a future population could be and thus more likely to select a wider range of possible populations. When prompted to make a judgement on a $1 million investment based on population numbers 30 years into the future, respondents provided a range of answers in response to which population forecast or prediction interval they would use (Figure 3). About one-sixth of respondents would use the principal projection (16%). For those who would use a range, similar numbers selected the 50% range (23%) and the 80% and 95% ranges (both at 21%). It should be noted that to some respondents $1 million was a significant investment, but to others it was “small and therefore low risk.” Many also commented that it would depend on what the investment was for: “It would depend on the requirements of the investment, and the consequences of getting it projection wrong [sic].”
Figure 3: What forecast information would you use when investing $1 million compared to $1 billion?
Source: Charles Darwin University Using Population Projections Survey 2018.
When explaining their choice, respondents gave answers which indicated that many people chose the principal projection because they thought it was the most likely, even for a large projection horizon. They provided comments such as “I believed the
0 5 10 15 20 25 30 35 40 The principal projection
The 95% range
The 80% range
The 50% range
Other
Percent
$1 million
principal projection to be the ‘most likely’ in projections. It’s the middle of the road choice” and “It is best to use a central estimate so that this investment can be compared against over [sic] investments like-for-like.” Of those who selected a projection range in their response, most indicated that they wanted to build in contingency and they wanted the range to acknowledge the risk associated with such a long projection horizon: “It demonstrates that there is less certainty about the population figures (bigger range) and more caution should be taken about committing investment.” Some respondents who indicated they would use a range felt the range was less useful if it was too broad. Although some respondents still felt they would be asked to provide just “one number,” they would also provide a range to prompt discussion amongst their client group or executive management.
Survey respondents were then asked how they would respond to increasing the investment amount to $1 billion. In this scenario, more than a third of respondents would choose the 95% range (38%); however, 22% would still choose the principal projection (Figure 3). Slightly less than two-thirds of respondents (60%) chose the same answer as for the $1 million investment scenario. Of those who chose a different answer, 56% selected a wider projection range.
Again respondents were asked to explain their choice. Those who stuck with their previous response expressed similar reasons: “Once I have decided the appropriate contingency it should not matter what the investment amount is” and “Although there is more risk associated with misspending this dollar amount, I would still use the principal and re-evaluate closer to 2046, circumstances permitting.” Many who chose the 95% interval indicated that it reflected the higher investment and associated higher risk which increased the need for greater certainty: “Certainty is more valuable in this case” and “More money, so reduce uncertainty.” Others were more circumspect in their explanation: “Similar to the previous response, although it does depend on what the investment is in. If it’s for a new hospital, it’s a waste to build it for a population that doesn’t exist, but it’s also silly to not make provision for the likely population. If the money was for a stadium, there could be good cause to use the lower limits, because there is no threat to lives if it is ‘undercooked.’” One respondent suggested that any judgement needed to consider both uncertainty and cost benefit: “The trick is communicating the risk of having a smaller population – does it make economic sense with a smaller population? There is a need to marry the population models with cost-benefit analyses on long-term investments.”
that prediction intervals were important to describing uncertainty statistically. Both pieces of information appeared important to decision-making.
3.4 How do users want to receive information on forecast populations and uncertainty?
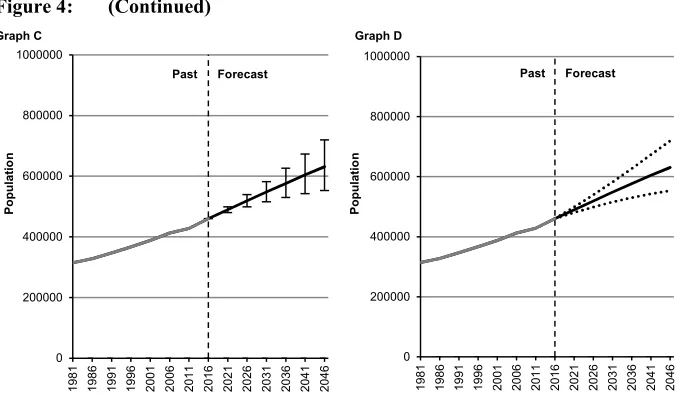
Graphs and selected terms on forecast populations and uncertainty were tested in both the online survey and focus groups to determine which were judged to be the most effective. Respondents to the online survey were shown the four graphs in Figure 4 illustrating 80% prediction intervals of a fictitious forecast of total population and asked which (if any) they preferred. No individual graph proved the overwhelming favourite. Graph A was preferred by 31%, followed by Graph B (24%), and then Graph D (22%). Graph C was not popular. Some respondents did not like any graph (6%) while 4% had no preference. One respondent commented that the graphs made the uncertainty more accessible: “Easier to get a feeling for these projections than just the raw numbers.”
Figure 4: Four ways of illustrating prediction intervals
Graph A Graph B
0 200000 400000 600000 800000 1000000
1981 1986 1991 1996 2001 2006 2011 2016 2021 2026 2031 2036 2041 2046
Populatio
n
Past Forecast
0 200000 400000 600000 800000 1000000
1981 1986 1991 1996 2001 2006 2011 2016 2021 2026 2031 2036 2041 2046
Populatio
n
Figure 4: (Continued)
Graph C Graph D
Note: Graphs show the 80% prediction interval, with Graph B also showing 67% and 50% intervals.
In response to a general question on using uncertainty information about future populations in decision-making, respondents wrote, “[It’s] most important that people know and understand that they are possibilities or estimates” and “If the aim is to improve people’s use of population projections, then I think the starting point has to be the assumption that the person knows nothing (because if they’re an expert they probably already know the basics and know that they need to take account of uncertainty). And if you assume people know nothing, you have to start the explanation in very, very simple terms.” Another respondent warned that quantifying uncertainty itself could imply we are more certain about it: “In communicating any uncertainty ‘quantities’ it should be clear that the methodology [sic] makes certain assumptions. Quantitative uncertainty may give the impression that we know more than what we really know, not less, as supposedly intended.”
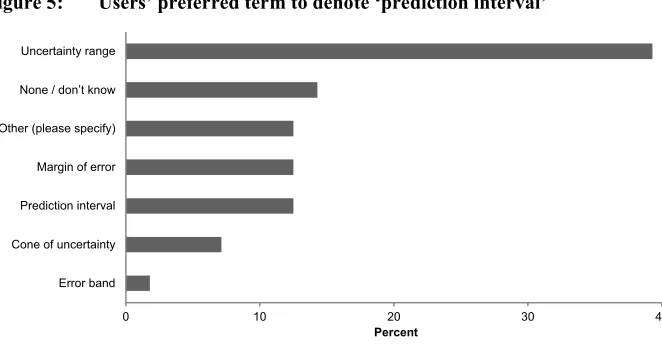
In focus groups we defined a prediction interval as ‘the interval in which future populations will fall with a certain probability.’ Some participants were uncomfortable with this definition: “I don’t like the word certain used with probability” and “The last two words are almost contradictory.” Participants felt “known probability” or “assumed probability” was a better description. The survey asked if users liked the term ‘prediction interval’ or if some other suggested terms were preferred. Figure 5 presents the results. ‘Uncertainty range’ proved the most popular with respondents, with relatively little support for the alternatives. Amongst the other options, users suggested
0 200000 400000 600000 800000 1000000
1981 1986 1991 1996 2001 2006 2011 2016 2021 2026 2031 2036 2041 2046
Populatio
n
Past Forecast
0 200000 400000 600000 800000 1000000
1981 1986 1991 1996 2001 2006 2011 2016 2021 2026 2031 2036 2041 2046
Populatio
n
‘reliability range,’ ‘confidence interval,’ ‘likelihood,’ or just ‘range.’ Focus group participants were almost unanimous in their support for ‘uncertainty range.’
Figure 5: Users’ preferred term to denote ‘prediction interval’
Source: Charles Darwin University Using Population Projections Survey 2018.
The interpretation of other terms was also discussed in focus groups. The definitions of ‘population estimate,’ ‘population projection,’ ‘population forecast,’ and ‘forecast error’ were explored. There was robust discussion about the understanding of the term ‘population estimate’ with many participants, saying there were high levels of user confusion around population numbers in general, particularly in relation to accuracy and which figure was the most appropriate to use. Some suggested that the word ‘estimate’ sounded more “forward looking” and that users needed to better “engage with the dynamic nature of population numbers.”
Participants also thought that a ‘population projection’ and ‘population forecast’ were essentially the same thing and could be used interchangeably. Some participants, however, suggested that a ‘population forecast’ was more likely to be correct, describing it as the “most likely outcome.” There was an observation made that although ‘projection’ and ‘forecast’ sounded like they described the future, in reality they can also refer to the recent past. This was confusing to users and required clarity.
Many participants felt ‘forecast error’ was difficult to understand and that users needed to understand how it was measured. One participant said that they talked about error in terms of risk to the forecast. Another participant explained that the development of probabilistic projections was considered by the government demographers but the move was halted because users wanted the certainty associated with a single population
0 10 20 30 40
Error band Cone of uncertainty Prediction interval Margin of error Other (please specify) None / don’t know Uncertainty range
number: “We were asked about accuracy, but then we were told that they just wanted one number.”
3.5 Would the concept of a forecast shelf life assist in understanding uncertainty?
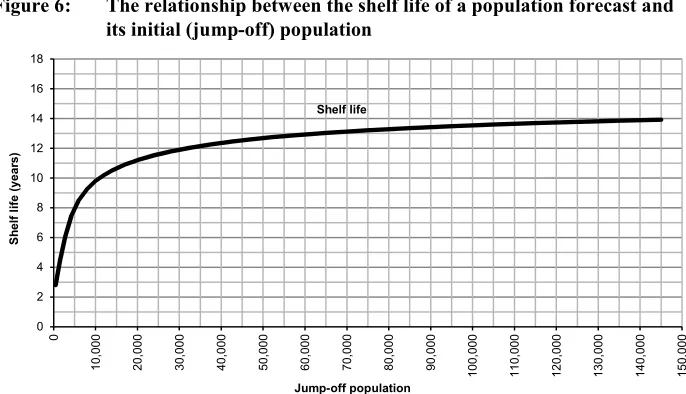
Focus group participants were introduced to the idea of a population forecast shelf life (Wilson 2018) and asked if this might be a useful way of describing how uncertainty (or accuracy) changes over time. Informal discussions with users and producers of population forecasts prior to this study had revealed support for it. The concept is borrowed from perishable food labelling to describe the number of years into the future a population forecast is likely to remain of reasonable quality. In practice ‘reasonable quality’ could be defined as the period in which the 80% prediction interval, or 80% of past errors, remain within ±10% error.
Focus group participants were presented with the graph in Figure 6. This was based on an analysis of past local government area population forecasts in Australia (Wilson et al. 2018). It shows a fitted curve describing the relationship between jump-off population size and shelf life, defined for illustrative purposes as the number of years into the forecast horizon in which 80% of past absolute percentage errors for a population of that size were within 10%.
Figure 6: The relationship between the shelf life of a population forecast and its initial (jump-off) population
Source: Based on the analysis in Wilson et al. (2018). 0
2 4 6 8 10 12 14 16 18
0
10,000 20,000 30,000 40,000 50,000 60,000 70,000 80,000 90,000 100,000 110,000 120,000 130,000 140,000 150,000
Sh
elf l
ife (year
s)
Generally participants related to the concept of shelf life because of their experience with its use on perishable food items. They offered feedback on their initial impression of the idea, such as, “Actually the method here I understand. It is actually good. It’s like milk. It can be that one day before expiring it could be off. But one day after you bought it then it is unlikely to be off but most chance before the expiry date it will be ready to consume”; “Looks quite useful. Based on errors in the past. [It] allows us to have some validity in making these assertions”; and “It’s not so much that you would be using it in 10 years. It’s just at that point you can plan for where you are going to be at 10 years.” There was clear support for its use as a communication tool to warn users about uncertainty and for providing guidance on the overall accuracy of population forecasts. Many alluded to circumstances where political representatives required briefings around future population assumptions. In these circumstances, use of a shelf life was considered a straightforward, “easy to understand” way of explaining the accuracy of a population forecast over time: “Politically there is real value in having this.”
Despite this broad support for the idea, there was some more cautious discussion about the tool and how it was created. Some queried the arbitrary nature of the 10% error margin and questioned whether the shelf life would be stable for a broad range of population densities, geographic remoteness areas, and the diversity of motivations associated with population migration. They also raised the issue of one-off events and its usefulness for very small populations. Finally there was further discussion around whether increased access to data and improved modelling techniques would obviate the need for such a tool and whether it was just too generalised and the inherent uncertainty associated with a modelled outcome is thus understated.
4. Discussion
4.1 Demand for forecast uncertainty information
Probably the most surprising finding of our study was the high level of support expressed by population forecast users for having information about forecast uncertainty. We had expected a lot more resistance to the idea of ranges of possible population futures rather than the simplicity and apparent reassurance of a single number. Population forecasts with prediction intervals, or other uncertainty information, increases the cognitive load on users, so we had expected them to be less popular. It is certainly true that our survey was not a representative sample and that many of our respondents were well-educated professionals and presumably interested in taking part in a survey on population forecasting (Table 1). But nonetheless this finding is encouraging. It shows there is a level of demand among current users for subnational population forecasts accompanied by explicit information and data about uncertainty. Even among the survey respondents who responded no to wanting information about uncertainty, the reasons given did not indicate a wholesale rejection of the concept. Reasons stated for not wanting uncertainty information included not knowing how to use such information and a concern that there would not be a uniform set of forecasts used across government departments.
The demand for information about uncertainty is further demonstrated in the finding that six in ten survey respondents reported trying to take uncertainty into account at the present. The most common response was through the use of high and low variant projections. Unfortunately the high-low range has been shown to be a poor measure of forecast uncertainty because it has no stated probability attached to it, and because it is inconsistent over time and across demographic variables (see, for example, the discussions in Lee 1999; Keilman, Pham, and Hetland 2002; Bell, Wilson, and Charles-Edwards 2011). But in the absence of much other information about uncertainty, it is understandable that users turn to high-low ranges.
4.2 The modelling challenge
It is clear that many users are receptive to information on forecast uncertainty and understand the concept. The challenge now for demographers and statisticians is to make progress with developing models for quantifying forecast uncertainty at various subnational geographical scales. Some initial progress has been made (as noted in the introduction) but much remains to be done. The models need to be able to represent the variability of uncertainty at regional and local scales but not be so complex, data hungry, and time-consuming that only a select few statistical offices are able to use them.
The modelling challenge is undoubtedly considerable. Probabilistic forecasts even at the national scale involve nontrivial amounts of data, data preparation, and expertise. Shifting to the subnational scale hugely increases the dimensionality of the modelling and could potentially involve hundreds or thousands of local areas. The richness and time series of demographic data tends to diminish as geographies become more detailed. Simpler empirically based prediction intervals may have to be applied. But irrespective of the means of preparing prediction intervals, difficult questions remain. For example, how should prediction intervals be created for greenfield areas which are expected to undergo major residential development but where the timing is unknown? How do we create prediction intervals for population forecasts of remote mining towns where the mines have limited (but uncertain) lifespans?
From a practical standpoint it would probably be helpful if uncertainty measures could be introduced into forecasting models without wholly replacing existing deterministic models and all the knowledge and expertise embedded in them. One option is to incorporate uncertainty in the form of separate programs or modules which could be added on to current systems, perhaps using the same computing platform (e.g., Excel/VBA, SAS). This approach may increase the chances of statistical offices embracing uncertainty and producing population forecasts with prediction intervals.
4.3 The communication challenge
different audiences, with information about uncertainty perhaps divided into summary, intermediate, and detailed categories.
We made only a limited foray into testing communication methods in our study. We asked survey respondents which one of a small number of ways of illustrating prediction intervals they preferred. We also asked users what they thought about several terms relating to uncertainty, finding that ‘uncertainty range’ was preferred over ‘prediction interval.’ Using terms which may not be technically precise or standard is less important in this context than effectively delivering the message about uncertainty to users. Some focus group participants found ‘forecast error’ difficult to understand, as well as the use of ‘population estimate’ to refer to past populations. Additionally, the fact that ‘projections’ and ‘forecasts’ also include population figures for the recent past – because the jump-off point of forecasts is often a year or two behind the publication date – similarly confused some focus group participants. Careful thinking about terms such as these is needed. Perhaps it would be better not to talk about forecast error but focus instead on ‘forecast uncertainty’; likewise, perhaps ‘past populations’ would be better than ‘estimates.’ Whatever terms are used, clear and simple definitions need to be available. We also tested the idea of population forecasts having a shelf life, like perishable foods, to ascertain if this would help in understanding how uncertainty changes over time. Focus group participants generally liked the idea and thought the principle was easy to understand. But more testing is required to see how users react to population forecast outputs which make use of the term.
4.4 Limitations
Of course, our study contains some limitations. Most importantly, with the convenience sampling approach, the results of our survey are clearly not representative of the total population forecast user group. A majority of survey respondents were from the government sector who we know are heavy users of population forecasts for planning and service delivery. However, the sample included respondents with a diversity of occupations, suggesting that we were successful in targeting users with a range of expertise and experience. The study is also limited to the user group and circumstances of population forecasts in Australia. We also acknowledge the sample is relatively small and overall results should be viewed with caution. Nonetheless, we feel that the findings provide useful information on how users respond to various forms of data and information on population forecasts and uncertainty and thus offer guidance on the communication of population forecast uncertainty.
4.5 Concluding remarks
This paper has presented the main findings from an online survey and focus groups of subnational population forecast users. Amongst respondents, the vast majority were interested in receiving information about the uncertainty of subnational population forecasts. Respondents also demonstrated a good understanding of key aspects of uncertainty through a guided set of questions illustrated with fictitious probabilistic population forecasts. These findings make a strong case for the provision of explicit information and data about the forecast uncertainty of subnational population forecasts. It was clear from our study, however, that the graphics and terminology used to communicate forecast uncertainty need to be chosen carefully. More research is required on, first, the further development of models to create prediction intervals for subnational forecasts and, second, effective communication tools and strategies.
5. Acknowledgements
References
ABS (2018). Australian Statistical Geography Standard (ASGS) [electronic resource]. Canberra: Australian Bureau of Statistics. http://www.abs.gov.au/websitedbs/
D3310114.nsf/home/Australian+Statistical+Geography+Standard+(ASGS).
Alders, M., Keilman, N., and Cruijsen, H. (2007). Assumptions for long-term stochastic population forecasts in 18 European countries.European Journal of Population
23(1): 33–69.doi:10.1007/s10680-006-9104-4.
Bell, M., Wilson, T., and Charles-Edwards, E. (2011). Australia’s population future: probabilistic forecasts incorporating expert judgement.Geographical Research
49(3): 261–275.doi:10.1111/j.1745-5871.2011.00702.x.
Bijak, J., Alberts, I., Alho, J., Bryant, J., Buettner, T., Falkingham, J., Forster, J.J., Gerland, P., King, T., Onorante, L., Keilman, N., O’Hagan, A., Owens, D., Raftery, A., Ševčíková, H., and Smith, P.F. (2015). Letter to the editor.Journal of Official Statistics 31(4): 537–544.doi:10.1515/jos-2015-0033.
Billari, F.C., Graziani, R., and Melilli, E. (2012). Stochastic population forecasts based on conditional expert opinions.Journal of the Royal Statistical Society Series A: Statistics in Society 175(2): 491–511.doi:10.1111/j.1467-985X.2011.01015.x.
Bongaarts, J. and Bulatao, R.A. (1999). Completing the demographic transition.
Population and Development Review 25(3): 515–529.doi:10.1111/j.1728-4457. 1999.00515.x.
Dunstan, K. and Ball, C. (2016). Demographic projections: User and producer experiences of adopting a stochastic approach. Journal of Official Statistics
32(4): 947–962.doi:10.1515/jos-2016-0050.
Guimarães, R.R. (2014). Uncertainty in population projections: The state of the art.
Revista Brasileira de Estudos de População 31(2): 277–290. doi:10.1590/ S0102-30982014000200003.
Johnstone, K. (2015). Communicating population projections to stakeholders: A case study from New South Wales. In: Wilson, T., Charles-Edwards, E., and Bell, M. (eds.). Demography for planning and policy: Australian case studies. Cham: Springer: 71–89.doi:10.1007/978-3-319-22135-9_5.
Keilman, N. (2008). Using deterministic and probabilistic population forecasts. In: Østreng, W. (ed.). Complexity: Interdisciplinary communications 2006/2007. Oslo: Norwegian Academy of Science and Letters: 22–28.
Keilman, N. (2018). Probabilistic demographic forecasts. Vienna Yearbook of Population Research 16: 25–35.doi:10.1553/populationyearbook2018s025.
Keilman, N., Pham, D.Q., and Hetland, A. (2002). Why population forecasts should be probabilistic: Illustrated by the case of Norway.Demographic Research 6(15): 409–454.doi:10.4054/DemRes.2002.6.15.
Keyfitz, N. (1981). The limits of population forecasting.Population and Development Review 7(4): 579–593.doi:10.2307/1972799.
Lee, R. (1999). Probabilistic approaches to population forecasting. In: Lutz, W., Vaupel, J.W., and Ahlburg, D.A. (eds.). Frontiers of population forecasting. New York: Population Council: 156–190.
Lee, R., Miller, T., and Edwards, R.D. (2003). The growth and aging of California’s population: Demographic and fiscal projections, characteristics and service needs. Berkeley: Center for the Economics and Demography of Aging.
Lutz, W., Sanderson, W.C., and Scherbov, S. (1998). Expert-based probabilistic population projections. Population and Development Review 24(Supplement: Frontiers of Population Forecasting): 139–155.doi:10.2307/2808054.
Morss, R.E., Demuth, J.L., and Lazo, J.K. (2008). Communicating uncertainty in weather forecasts: A survey of the US public. Weather and Forecasting 23: 974–991.doi:10.1175/2008WAF2007088.1.
Raftery, A.E., Li, N., Ševčíková, H., Gerland, P., and Heilig, G.K. (2012). Bayesian probabilistic population projections for all countries. Proceedings of the National Academy of Sciences 109(35): 13915–13921. doi:10.1073/pnas. 1211452109.
Rayer, S. (2008). Population forecast errors: A primer for planners.Journal of Planning Education and Research 27(4): 417–430.doi:10.1177/0739456X07313925.
Rayer, S. and Smith, S.K. (2010). Factors affecting the accuracy of subcounty population forecasts. Journal of Planning Education and Research 30(2): 147–
161.doi:10.1177/0739456X10380056.
Rayer, S., Smith, S.K., and Tayman, J. (2009). Empirical prediction intervals for county population forecasts. Population Research and Policy Review 28: 773–793.
doi:10.1007/s11113-009-9128-7.
Rees, P. and Turton, I. (1998). Investigation of the effects of input uncertainty on population forecasting. Paper presented at the GeoComputation 98 Conference, Bristol, UK, September 17–19, 1998.
Ševčíková, H. and Raftery, A.E. (2012). bayesPop: Probabilistic population projection R package: Version 1.0–3 [electronic resource]. Vienna: R Foundation for Statistical Computing.http://CRAN.R-project.org/package=bayesPop.
Simpson, L., Wilson, T., and Shalley, F. (2018). The shelf life of sub-national population forecasts, from Australia to England. Darwin: Northern Institute, Charles Darwin University (Working Paper 03/2018). https://www.cdu.edu.au/ sites/default/files/the-northern-institute/working_paper_2018_03.pdf.
Statistics Netherlands (2017). Forecast: 18.4 million inhabitants in 2060 [electronic resource]. The Hague: Statistics Netherlands. https://www.cbs.nl/en-gb/news/
2017/51/forecast-18-4-million-inhabitants-in-2060 (accessed April 18, 2018).
Statistics New Zealand (2008). How accurate are population projections? An evaluation of Statistics New Zealand population projections, 1991–2006. Wellington: Statistics New Zealand.http://archive.stats.govt.nz/browse_for_stats/population/
estimates_and_projections/how-accurate-are-population-projections.aspx.
Statistics New Zealand (2016). National population projections: 2016(base)–2068. Wellington: Statistics New Zealand.
https://www.stats.govt.nz/information-releases/national-population-projections-2016base2068.
Stoto, M.A. (1983). The accuracy of population projections.Journal of the American Statistical Association 78(381): 13–20.doi:10.1080/01621459.1983.10477916.
Tayman, J. (2011). Assessing uncertainty in small area forecasts: State of the practice and implementation strategy. Population Research and Policy Review 30(5): 781–800.doi:10.1007/s11113-011-9210-9.
United National Economic Commission for Europe (UNECE) (2018). Recommendations on communicating population projections. Geneva: UNECE.
https://www.unece.org/fileadmin/DAM/stats/publications/2018/ECECESSTAT2
0181.pdf.
United Nations (2019). World Population Prospects 2019. New York: United Nations.
Wilson, T. (2012). Forecast accuracy and uncertainty of Australian Bureau of Statistics state and territory population projections. International Journal of Population Research 2012(419824): 1–16.doi:10.1155/2012/419824.
Wilson, T. (2013). Quantifying the uncertainty of regional demographic forecasts.
Applied Geography 42: 108–115.doi:10.1016/j.apgeog.2013.05.006.
Wilson, T. (2018). Communicating population forecast uncertainty using perishable food terminology. Darwin: Northern Institute, Charles Darwin University (Research Brief RB03/2018). http://www.cdu.edu.au/sites/default/files/research-brief-2018-03_0.pdf.
Wilson, T., Brokensha, H., Rowe, F., and Simpson, L. (2018). Insights from the evaluation of past local area population forecasts. Population Research and Policy Review 37(1): 137–155.doi:10.1007/s11113-017-9450-4.
Wisniowski, A. and Raymer, J. (2016).Bayesian multiregional population forecasting: England. Paper presented at the Joint Eurostat/UNECE Work Session on Demographic Projections, Geneva, Switzerland, April 18–20, 2016.
World Meteorological Organization (2008). Guidelines on communicating forecast uncertainty. Geneva: WMO. https://library.wmo.int/doc_num.php?explnum_
id=4687.