MSEB SERVICE RESTORATION USING WEB BASED SCADA
Kurhe P. S.*, Madhuri Unde
*Department of Electronics and Telecommunication, SRES’ Sanjivani College of Engineering,
Kopargaon. S. P. University of Pune, (M.S.) India ME Information Technology SPPU, (M.S.) India
DOI: 10.5281/zenodo.51762
KEYWORDS
:
SCADA, Arduino, Set Points, Supervisory control, .Net Interface.ABSTRACT
In our day today life electricity may be interrupted due to afternoon storms, snow storms and natural disasters. When these events occur we may think that it is due to some MSEB technical fault & the power will come after some time. If it is not coming, then we are calling to MSEB operator. Then the available tools and analytic techniques are applied to locate the fault, isolate the faulted area, complete repairs and restore service to the faulted area. This is done by the control room staff closely coordinating with field personnel. Now a days for monitoring of critical infrastructure we are using SCADA (Supervisory Control And Data Acquisition), It acquires the real time data from field devices and performs supervisory control on it, where operators can monitor & control the behavior of system. But SCADA system is too costly. That’s why the idea of proposed work is to design a system which is very cost effective. This system can be used to monitor MV/LV application also.
INTRODUCTION
SCADA is not a particular technology, but actually it is a type of application. In this application it collects data to control that system. SCADA system has two elements:
1. The system which we want to monitor and control, this can be a power distribution plant, a water treatment system, traffic lights system, air pollution monitoring system etc.
2. A network of some electronic intelligent devices that interfaces with the first system i.e. control unit through sensors and control outputs. This application that is SCADA system, allows us to measure and control specific parameters of the first system.
Need of SCADA system:
We can use SCADA to manage and control any kind of system or equipment. Typically, SCADA systems are used in automation of complex industrial processes or critical infrastructures where human control is difficult. Systems where there are more and fast moving control parameters, than human beings can manage comfortably.
Often, they are used in critical infrastructures (CIs) where security and safety are important factors. Due to this, they have to meet with strict regulatory standards. Traditional SCADA systems are deployed in an undiversified way in which there is a central data centre and with a large amount of wiring required to connect different hardware elements with the data centre. Due to the limited access to these wired elements, traditional security provision mainly focuses on physical protection measures [1].
SCADA systems use to control following applications:
1) Electric power generation, transmission and distribution: Electric applications use SCADA systems to
measure current flow and voltage across line, to monitor the operation of circuit breakers, and to take sections of the power grid online/ offline
2) Water treatment and monitoring: Municipal water utilities use SCADA to monitor and regulate water
flow, reservoir levels, pipe pressure etc
3) Manufacturing: SCADA systems manage listing of parts for manufacturing in time, regulate industrial
automation and robots, and monitor process and quality control
5) Traffic signals: SCADA regulates traffic lights, controls traffic flow and detects out-of-order signals.
RELATED WORK
G. Larry Clark (Jan/Feb 2014) in the article [2] states that- in the past the status of the electric system was shown on map board that was typically mounted on wall. The map board states the location of switches and isolating points. A pin on the map board indicates the state of each switch; different pin colors denote the various states in which a switch could be placed. The map board was located near the radio so that the operator could communicate with field personnel while viewing the map board and recording all switch steps and activity.
Antonio M. Grilo (Aug 2014) in the paper[1] states that SCADA (Supervisory Control And Data Acquisition) system refers to a system that collects data from various sensors at a Power distribution plant at remote location and then sends this data to a central computer which then manages and controls the data. But the cost of SCADA is too high. That’s why in this paper the author proposed a system which is integration of WSAN and SCADA for monitoring a critical infrastructure.
In integrated SCADA system: An integration transportation system control platform author states that Integrated SCADA system should simplify complex central control facilities and their operations, to reduce the operations load by controllers, as well as improving the emergency response capabilities and shortening the operations training period.
R Kirubashankar in paper "Remote monitoring system for distributed control of industrial plant process" developed the system Industrial process plant which can be monitor remotely by architecture having GPRS and wireless Internet connection in conjunction with DCS-SCADA. It improves reliability, response time, plant interface under continuous remote real time monitoring under adverse environmental conditions of process plants for maximizing plant operational conditions.
SYSTEM DESIGN
In the past, the status of the electric system was displayed on a paper map board that was typically mounted on the wall. The map board states the location of switches and isolating points. Pins on the map board indicate the state of each switch; different pin colors denote the various states in which a switch could be placed. The map board was located near the radio, so that the operator could communicate with field person while viewing the map board and recording all switch steps and activity [2].
Traditionally, this work is done by collecting this information manually by recording the chart parameters. This might be done at any time depending on available staff. While manual collection of this data is the rule, plants wants to move to process using a central station for all monitoring and controlling, this can reduce or eliminate the need for manual data collections. Nowadays these types of applications are controlled by using Supervisory Control and Data Acquisition (SCADA) system. This article examines the use of .NET interface in SCADA applications, means a real time control system is developed by using the .NET interface which can perform all the data repository and controlling function in a better manner than a SCADA system[4], at very low cost as that of the SCADA. This system cannot only perform these industrial SCADA applications but also proposes a fine web based solution to access all these acquired data and equipments. A SCADA System usually consists of the following subsystems:
1) A Human Machine Interface (HMI) / Graphical User Interface (GUI is the application which presents
process data to operator and through which the operator monitors and controls the process.
2) A supervisory system which gathers (acquires) data on the process and sends commands (control) to the
process.
3) Remote Terminal Units (RTUs) connects to sensors in the process, converts sensor signals to digital data and sends digital data to the supervisory system.
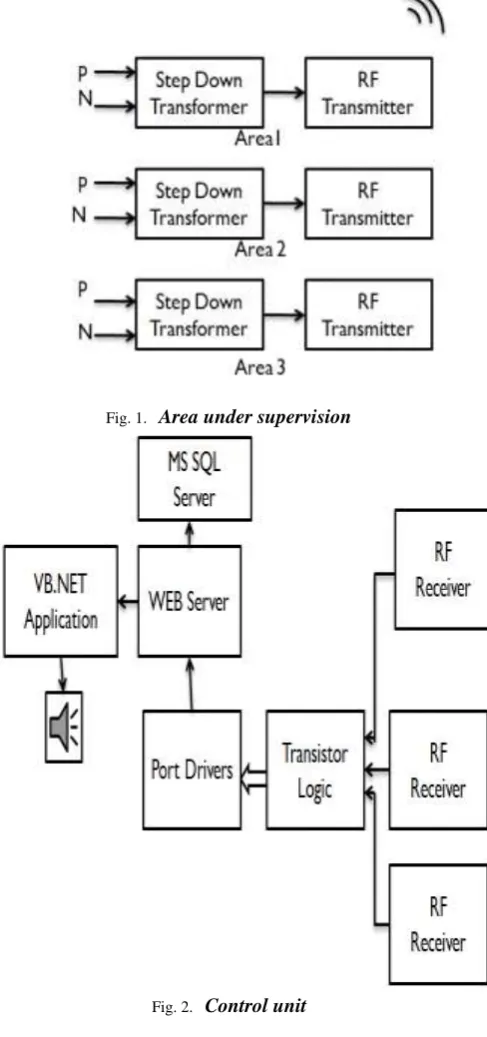
As shown in below fig.1 and 2 Web based SCADA system consist of following 2 units.
2. Control unit
Detailed Operation is described below. Area under supervision
This part consists of grids. That is area which we want to monitor. In Proposed system three areas are considered. Step down transformer is used to transform high voltage into low voltage, because this system is also designed for LV/MV application.
Fig. 1. Area under supervision
STEPS:
1. RF transmitter transmits high pulse if there is no fault and transmits low pulse if any fault occur in area under supervision.
2. RF receiver receives frequency transmitted by RF transmitter.
Control unit
This is actual web based SCADA system. Interfacing of hardware and software is done by using port drivers. For interfacing dll interface is used.
STEPS:
1. Some set points are defined for each area.
2. Pulse received by RF receiver is transferred to transistor logic.
3. Transistor logic converts it into HEX number as it is in BIN (HEX->BIN conversion). 4. It is compared against defined set points.
5. If match found (Step sequence algorithm) then fire a supervisory control action.
6. Corresponding operator and users from that area are found out from database and messages are send to
them by using web API.
7. Alarm handling is done.
8. Service restoration takes place.
The application works with Intel Pentium IV processor and compatible hardware platform. The application software will give the expected performance with (recommended) minimum 1GB of RAM.
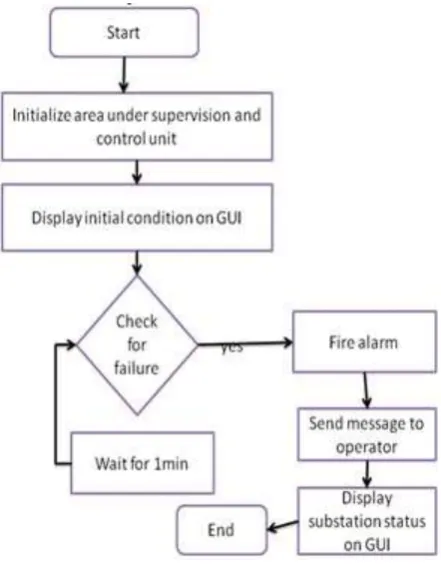
Flow chart of system:
Fig. 3. Flow chart
Fig. 4. RF transmitter
HT12E Encoder IC will convert the 4 bit parallel data given to pins D0 – D3 to serial data and will be available at DOUT. This output serial data is given to ASK RF Transmitter. Address inputs A0 – A7 can be used to provide data security and can be connected to GND (Logic ZERO) or left open (Logic ONE). Status of these Address pins should match with status of address pins in the receiver for the transmission of the data. Data will be transmitted only when the Transmit Enable pin (TE) is LOW. 1.1MΩ resistor will provide the necessary external resistance for the operation of the internal oscillator of HT12E.
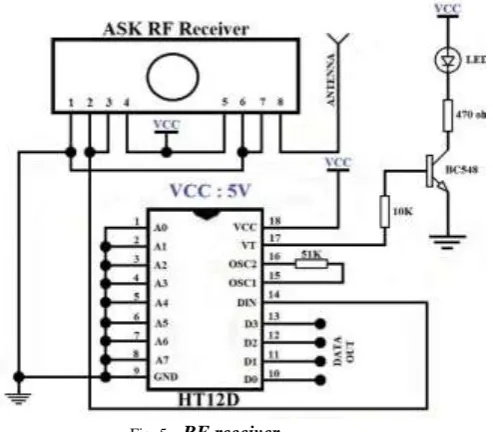
RF receiver
ASK RF Receiver receives the data transmitted using ASK RF Transmitter. HT12D decoder will convert the received serial data to 4 bit parallel data D0 – D3. The status of these address pins A0-A7 should match with status of address pin in the HT12E at the transmitter for the transmission of data. The LED connected to the above circuit glows when valid data transmission occurs from transmitter to receiver. 51KΩ resistor will provide the necessary resistance required for the internal oscillator of the HT12D.
ADVANTAGES
1. Traditional SCADA system uses ModBus. Following are some disadvantages of ModBus which are removed by using HTTP.
Limited number of data types for ModBus.
No standard way for a node to find the description of a data object.
Consumes more bandwidth and requires more network time.
Limits the number of field devices that may be connected to master station.(247 devices)
Limits the type of remote communication devices.
No security against unauthorised commands [8].
2. Cost effective than SCADA.
3. Able to monitor low voltage part.
4. Real time decision making system.
5. Provides standard alarm and monitoring.
6. Service Restoration time is less.
COMPARISON
TABLE I Comparison of traditional SCADA with web based SCADA
Feature Traditional
SCADA
Web based
SCADA
Design Complex(Requires
wiring)
Simple design
Security No security Security provided
by using HTTP protocol
Web interface No web interface
available
Web interface
provided
Message loss Packet loss No packet loss
Voltage Medium Low/Medium
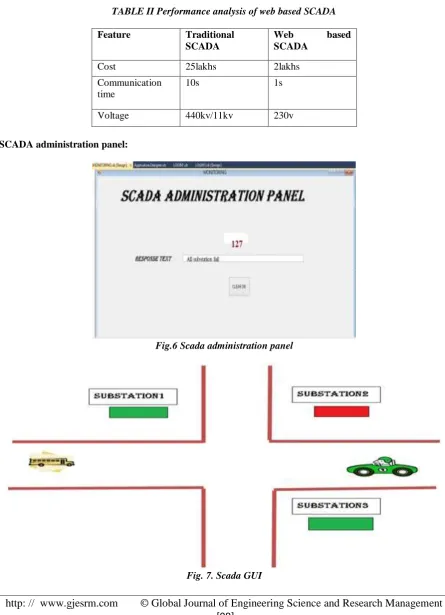
RESULTS
of power transmission line that is substation failure. Green color at substation 1 and substation 2 indicates that it is working properly where as red color at substation 2 indicates failure.
TABLE II Performance analysis of web based SCADA
Feature Traditional
SCADA
Web based
SCADA
Cost 25lakhs 2lakhs
Communication time
10s 1s
Voltage 440kv/11kv 230v
SCADA administration panel:
Fig.6 Scada administration panel
CONCLUSION
The proposed system that is Web based SCADA system which is very cost effective, which can be used to monitor MV/LV application also. This system is designed using HTTP protocol. It can be used for remote monitoring and also provides standard alarm and messaging system. It improves the visibility of the distribution system for the operator. It provides the techniques to improve the efficiency and reliability of the distribution9 system. All processing and controlling is performed in real time at the server station.
REFERENCES
1. Antnio M. Grilo, Member, IEEE, Jaime Chen, Manuel Daz, Daniel Garrido, and Augusto Casaca, "An
Integrated WSAN and SCADA System for Mon1itoring a Critical Infrastructure? ,"IEEE Transactions On Industrial Informatics, VOL. 10, NO. 3, AUGUST 2014.
2. G. Larry Clark, “Four Decades of Service Restoration at Alabama Power,"IEEE power and Energy magazine.
3. D.C. Darandale, Prof B.L.Gunjal, " Development of Web-Based SCADA like Application using Arduino
Platform,", International Journal of Emerging Technology and Advanced Engineering, Volume 3, Issue 8, August 2013.
4. Hosny A. Abbas and Ahmed M. Mohamed, " Review on the Design of Web Based SCADA Systems
Based on OPC DA Protocol,",International Journal Of Computer Networks (IJCN), Volume (2) : Issue (6)
5. Thomas Dreyer, David Leal, Andrea Schrder and Michael Schwan, "Scada On Web Based Supervisory
Control and Data Acquisition,"ISWC 2003.
6. Antnio Grilo, Augusto Casaca, Mrio Nunes and Carlos Fortunato,"Wireless Sensor Networks for the Protection of an Electrical Energy Distribution Infrastructure,"What Kind of Information Society? Governance, Virtuality, Surveillance, Sustainability, Resilience Springer (Ed.) (2012).
7. Ming-Shou An, Hye-Youn Lim and Dae-Seong Kang,"Implementation of Remote Condition Monitoring
System of O shore Wind Turbine Based on NI WSN," International Journal of Control and Automation Vol. 6, No. 2, April, 2013
8. ht tp://www.scadaonweb.com
9. Brendan Galloway and Gerhard P. Hancke, ,” Introduction to Industrial Control Networks” IEEE communication surveys & tutorials, VOL. 15, NO. 2, second quarter 2013.
10. Madhuri Unde and Bharat Borkar,”MSEB service restoration using web based SCADA utility” Spvryan